CONTENTS
Ⅰ. INTRODUCTION
Ⅱ. MATERIALS AND METHODS
Ⅲ. RESULTS
Ⅳ. DISCUSSION
Ⅴ. CONCLUSIONS REFERENCES KOREAN ABSTRACT
Ⅰ. INTRODUCTION
Masticatory muscle disorder is frequently con- current with chronic orofacial pain. It is classified into myofascial pain disorder, protective muscle splinting, myospasm, myositis, and muscle contrac- ture. Muscle disorder can occur with or without joint disorder. Schiffman et al. reported epidemiologic study that 33% of the general population was involved with temporomandibular disorder and 41 % had masticatory muscle disorder
1). Muscle pain is the most frequent symptom in patients with masticatory muscle disorder.
Muscular fatigue originated from parafunction, postural muscle tension, and hyperactivity of the masticatory muscles. Muscular fatigue is known as a major cause of muscle pain in the orofacial region
2). Local muscular fatigue may be defined as a transient decrease in the capacity to perform work due to prior physical activity. Therefore muscle tenderness during palpation has been reported as the most common diagnostic tool of masticatory muscle disorder. The mechanism of muscle tenderness is clearly unknown. It is suspected that type III or IV nociceptors are sensitized to pressure stimuli or activated by local factors giving rise to an increase in nociceptive afferent fiber activity
3). The most common method to evaluate tenderness in the masticatory muscles is manual palpation but it is difficult to measure various levels of muscle tenderness. A patient's response is dependent on the strength of palpation and it is therefore difficult to objectively measure this response. As a tool of measurement, the pressure algometer is one of the reliable methods used to quantify changes in muscular pain threshold. This instrument is
A Study on the Changes in Motor Unit Action Potential, EMG Power Spectrum, and Pressure Pain Threshold of
Masticatory Muscles during Sustained Fatiguing Contraction
Cheol Kim
1, D.D.S.,M.S.D., Young-Jun Kim
2, D.D.S.,M.S.D., Kyung-Nyun Kim
3, D.D.S.,Ph.D.
Department of Oral Medicine and Diagnosis, College of Dentistry, Kangnung National University
1Department of Oral Medicine and Diagnosis, College of Dentistry, Seoul National University
2Department of Oral Physiology, College of Dentistry, Kangnung National University
3therefore used in many studies as a means of evaluating muscle tenderness and of measuring the pressure pain threshold (PPT) in the orofacial region. It has been shown to be sensitive and reliable
4,5).
Another sensitive research tool for measuring muscular functions and conditions is the Electromyography (EMG). Moyers first introduced it into dental research
6). Three types of electrodes:
surface, needle and fine wire have been used for EMG examinations. The surface electrode is used to evaluate the overall activity of whole muscles. The needle electrode and fine wire electrode are used to evaluate the functions of deep muscles and the properties of motor units.
A motor unit is composed of the motor neuron, axon, and muscle fibers. It is an individually activated functional basic unit of the motor system, without any relation to an activating state of other motor units. Stålberg reported that the feature of motor unit action potential (MUAP) was determined by the structure of a motor unit, i.e. the number, size, distribution of muscle fibers in a motor unit and geometric form of end-plate zone
7). Stålberg also reported that the structure of a motor unit could be changed by loss of muscle fibers and re-innervation
7). The intensity of muscle contraction is determined by the number of recruited motor units, firing frequency of an individual motor unit, and the degree of resistance to fatigue during muscle contraction. The size, distribution and function of a motor unit can be changed by various physiologic factors and by diseases. Therefore, it can be possible to detect physiologic and pathologic changes of a motor unit by observing the changes of MUAP with EMG. There are a number of parameters for analyzing MUAP such as duration, amplitude, area, and phase. From the analysis of these parameters we can estimate the physiologic and pathologic changes in muscles.
Analysis of muscular fatigability induced by sustained muscle contraction can be also performed with power spectral analysis. The conversion of time-domained myoelectric signals into frequency-
domained signals can be done with the aid of fast Fourier transformation
8). Many authors reported that power spectrum of myoelectric signal was shifted to lower frequency range as muscular fatigue induced by sustained masticatory muscle contraction
8,9,10). The relation between EMG activity and PPT has been investigated by several researchers. Fricton et al. reported that the motor unit electrical activity in trigger points was found to be significantly higher than that of the normal muscle
11). Jensen reported that muscle tenderness and EMG-amplitude levels in tension-type headache patients were signifi- cantly increased over those of a control group
12). He suggested one of the primary sources of pain in tension-type headache might be a local sensitization of nociceptors in the pericranial muscles. Sandrini et al. reported EMG and pressure pain threshold of patient with chronic tension-type headache were lower than those of normal population and patients with migraine
13).
The purpose of this study is to investigate the relationships between the level of pressure pain threshold and the parameters of MUAP in human masseter and the anterior temporal muscle. This study purposes to as well examine the changes in morphologic parameters of motor unit action potential, pressure pain threshold, and EMG power spectrum during experimentally induced acute muscular fatigue.
Ⅱ. MATERIALS AND METHODS 1. Subjects
Thirty-six subjects, 26 males (26.5±2.1 years old)
and 10 females (23.8±2.7 years old), without past
history and present symptoms of pain and
discomfort in temporo-mandibular joints and
masticatory muscles, with normal bilateral posterior
occlusion were included in this study. Because there
were no significant differences of myoelectric signal
and PPT between right and left side of masticatory
muscles in pilot study, MUAP, EMG power
spectrum, and PPT were measured in the right
anterior temporal and masseter muscles before and after sustained isometric contraction.
For the estimation of the maximum voluntary contraction level (MVC), the subjects were asked to clench for 3 seconds three times with maximum forces in maximal intercuspal position. The highest force among the three trials was defined as the maximum voluntary contraction level. After 5 minutes rest, each subject performed a sustained clenching at 70 % MVC with visual feedback until endurance time when they could not maintain the level.
Simultaneous examination of MUAP and EMG power spectrum was difficult in anterior temporal muscle because of its small size, however it was possible in a masseter muscle. In the case of anterior temporal muscle, MUAP and power spectrum were analyzed on different days. PPTs were also measured with each analysis, respectively. Each muscle was analyzed at different days.
2. Pressure pain threshold
PPT measurement was performed with the Electric Algometer Type II (Somedic Production AB, Stockholm, Sweden). The algometer has 1 cm
2circular probe. The subjects were seated and Frankfort planes were parallel to the floor. The force was applied perpendicularly to the anterior temporal and masseter muscle, and the increasing rate of force is maintained at 40 kPa/sec.
Each application was repeated twice and the mean values were obtained. The interval between the first and second pressure algometer application was at least five minutes. In order to avoid experimental bias neither the examiner nor the subjects could watch the digital display.
3. Motor unit action potential
The EMG equipment, Nicolet Viking IV electro- diagnostic system (Nicolet Biomedical Inc., U.S.A.) was used for recording myoelectric signals. This system can perform MUAP analysis automatically
with a concentric needle electrode. The concentric needle electrode (Nicolet Biomedical Inc., U.S.A.) was inserted in the right masseter muscle, in the area of 1 cm superior and anterior to the angle of the mandible about 1 cm in depth. And the pre-gelled, silver/silver chloride surface electrodes (Nicolet Biomedical Inc., U.S.A.) were aligned in the direction of the muscle fibers as the same position which PPTs were measured. The ground electrode was installed on the skin of the neck of the subject just below the earlobe. Then the examiner let the subject generate a few motor units with minimum effort. As this effort measurably appeared on the displayed screen, the examiner carefully moved the needle electrode until it was inside the motor unit's territory as shown by the on-screen display.
Once the needle electrode was inserted into the motor unit territory a few MUAPs were recorded.
Then the needle electrode was carefully repositioned to the other site in the tested muscle in order to record different MUAPs until the twenty different MUAPs were obtained in a tested muscle for the statistical analysis. MUAPs were recorded at a sensitivity of 100-200 μV per division. The low pass and high pass filter of amplifier set at 10 kHz and 2 Hz respectively for undistorted recording of MUAPs. Analysis was performed using a computer-assisted program and the MUAP features were quantitated. In recording MUAPs, the motor unit action potentials selected for assessment must
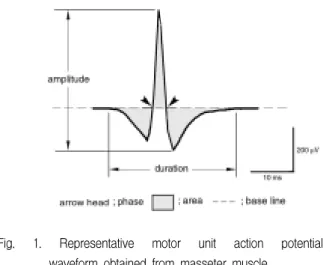
Fig. 1. Representative motor unit action potential
waveform obtained from masseter muscle.
have a rise time less than 0.5 ms and an area value in range of mean ± 2 standard deviation among different twenty MUAPs. Fig. 1 shows a typical MUAP waveform with important parameters.
4. EMG power spectrum
Power spectral analysis of the EMG signal was performed by Nicolet Viking IV electrodiagnostic system. It determined the individual frequency components and their power contained within the EMG signal. Time-domained myoelectric signals could be transformed into frequency-domained signals. During the sustained isometric contraction, integrated EMG activity and the firing frequency from both anterior temporal and masseter muscles were recorded.
5. Statistical analysis
For each subject the mean values and standard error of means of each MUAP parameter of twenty MUAPs were calculated. All the statistical analyses were performed by SPSS/PC
+program. Paired t-test was used to evaluate the difference between
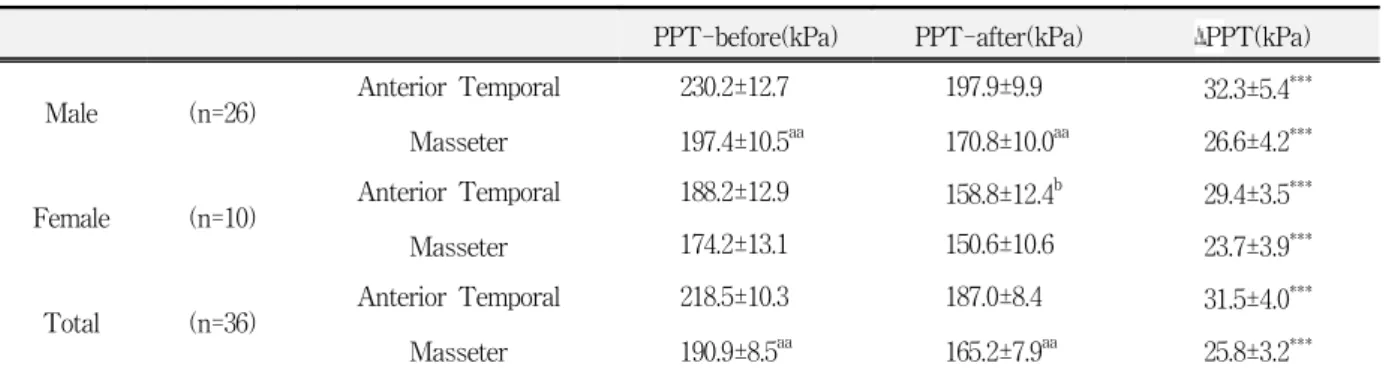
Table 1. Pressure pain threshold (PPT) values before and after sustained isometric contraction. Data presented as mean ± standard error of means. Asterisks indicate statistically significant difference between before and after sustained isometric contraction within the same muscle (***: p<0.001). The 'a' indicates a statistically significant difference between anterior temporal and masseter muscle in either before or after sustained isometric contraction (aa: p<0.01). The 'b' indicates a statistically significant gender difference of PPT values (b: p<0.05).
PPT-before(kPa) PPT-after(kPa) ΔPPT(kPa)
Male (n=26) Anterior Temporal 230.2±12.7 197.9±9.9 32.3±5.4
***Masseter 197.4±10.5
aa170.8±10.0
aa26.6±4.2
***Female (n=10) Anterior Temporal 188.2±12.9 158.8±12.4
b29.4±3.5
***Masseter 174.2±13.1 150.6±10.6 23.7±3.9
***Total (n=36) Anterior Temporal 218.5±10.3 187.0±8.4 31.5±4.0
***Masseter 190.9±8.5
aa165.2±7.9
aa25.8±3.2
***PPT-before : PPT values before sustained isometric contraction
PPT-after : PPT values immediately after sustained isometric contraction ΔPPT : the difference between PPT-before and PPT-after
anterior temporal and masseter muscles and the difference of median frequency and pressure pain threshold between before and after sustained isometric contraction. Student t-test was performed to examine the gender difference. The slope of median frequencies was calculated by means of linear regression analysis to evaluate decline pattern of median frequencies during sustained isometric contraction of masticatory muscles.
The correlation between the PPTs and MUAP parameters and median frequency was investigated by Pearson correlation coefficients. Whenever statistical tests were performed they were two-tailed and at the 5 % significance level.
Ⅲ. RESULTS
During sustained fatiguing contraction the means and standard errors of pressure pain threshold (PPT) of both anterior temporal and masseter muscles are shown in Table 1 and Fig. 2.
Before sustained isometric contraction, PPTs in
both anterior temporal and masseter muscle were
significantly higher than those measured after
sustained isometric contraction (P < 0.001). In the
Fig. 2. Pressure pain threshold (PPT) values before and after sustained isometric contraction in both anterior temporal muscle (A) and masseter muscle (B). Asterisks indicate a statistically significant difference of PPT values between before and after sustained isometric contraction (***: p<0.001). The 'a' indicates a statistically significant PPT difference between anterior temporal and masseter muscle (aa: p<0.01). The 'b' indicates a statistically significant gender difference of PPT (b: p<0.05).
male group, all of PPTs in anterior temporal muscle were significantly higher than in masseter muscles (p < 0.01), however, all PPTs did not show any significant differences between two muscles in the female group. For all subjects PPTs in anterior temporal muscles were significantly higher than those in masseter muscles (p < 0.01), and only statistically significant gender difference were found in PPTs, which measured after contraction in anterior temporal muscles (Fig. 2).
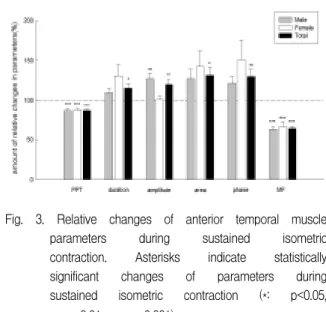
In anterior temporal muscle of the male group, 3 MUAP parameters, except amplitude, which meas- ured after fatiguing contraction were significantly higher than those before fatiguing contraction.
Statistical significances were as follows; duration, phase (p < 0.001), and area (p < 0.01). In the female group, all MUAP parameters did not show any significant differences between before and after
Fig. 3. Relative changes of anterior temporal muscle parameters during sustained isometric contraction. Asterisks indicate statistically significant changes of parameters during sustained isometric contraction (*: p<0.05,
**: p<0.01, ***: p<0.001).
fatiguing contraction. For all subjects, 3 MUAP parameters, except amplitude, which measured after fatiguing contraction were significantly higher than those before fatiguing contraction. Statistical significances were as follows: phase (p < 0.001), duration, and area (p < 0.05) (Table 2, Fig. 3).
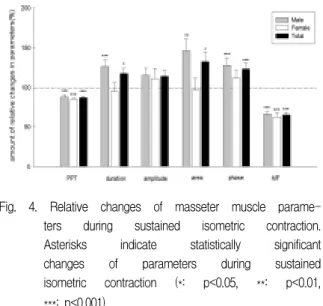
In a masseter muscle of the male group, MUAP amplitude (p < 0.01) which measured after fatiguing contraction was significantly higher than those before fatiguing contraction. In the female group, all MUAP parameters did not show any significant differences between before and after fatiguing contraction. For all subjects, all MUAP parameters, which measured after fatiguing contraction were significantly higher than those before fatiguing contraction. Statistical significances were as follows; duration, area (p < 0.05), amplitude, phase (p < 0.01) (Table 3, Fig. 4).
The median frequencies (MFs) were found to be
compressed significantly to lower frequency range
as muscle contraction was sustained in all subjects
(p < 0.001). The MFs did not show any significant
differences between male and female groups in both
muscles. There were no significant differences
between male and female groups/between anterior
temporal and masseter muscles in the amount of
change in MFs and slope of median frequency shift.
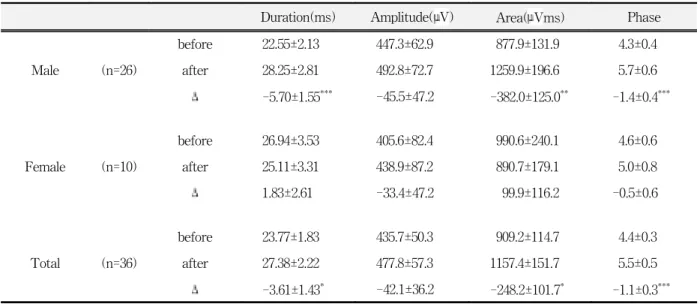
Table 2. Motor unit action potential (MUAP) parameters in anterior temporal muscle before and after sustained isometric contraction. Data presented as mean±standard error of means. Asterisks indicate statistically significant differences of MUAP parameters between before and after sustained isometric contraction (*: p<0.05, **: p<0.01, ***: p<0.001).
Duration(ms) Amplitude(μV) Area(μVms) Phase
before 22.55±2.13 447.3±62.9 877.9±131.9 4.3±0.4
Male (n=26) after 28.25±2.81 492.8±72.7 1259.9±196.6 5.7±0.6
Δ -5.70±1.55
***-45.5±47.2 -382.0±125.0
**-1.4±0.4
***before 26.94±3.53 405.6±82.4 990.6±240.1 4.6±0.6
Female (n=10) after 25.11±3.31 438.9±87.2 890.7±179.1 5.0±0.8
Δ 1.83±2.61 -33.4±47.2 99.9±116.2 -0.5±0.6
before 23.77±1.83 435.7±50.3 909.2±114.7 4.4±0.3
Total (n=36) after 27.38±2.22 477.8±57.3 1157.4±151.7 5.5±0.5
Δ -3.61±1.43
*-42.1±36.2 -248.2±101.7
*-1.1±0.3
***before : before sustained contraction after : after sustained contraction
Δ : the difference of MUAP parameter values between before and after sustained contraction
Table 3. Motor unit action potential (MUAP) parameters in masseter muscle before and after sustained isometric contraction. Data presented as mean ± standard error of means. Asterisks indicate statistically significant differences of MUAP parameters between before and after sustained isometric contraction (*: p<0.05, **: p<0.01)
Duration(ms) Amplitude(μV) Area(μVms) Phase
Male
before 29.36±1.74 432.8±33.0 1198.0±133.4 5.4±0.4
(n=26) after 31.55±2.07 537.8±47.7 1381.9±155.7 6.3±0.6
Δ -2.20±1.53
.-105.0±31.6
**-183.9±131.6 -9.7±0.5
Female
before 30.29±1.85 548.9±64.6 1292.7±197.3 5.9±0.6
(n=10) after 38.05±2.88 556.2±65.3 1623.9±172.2 8.5±1.2
Δ -7.76±3.58 -7.3±21.9 -331.2±206.2 -2.6±1.2
Total
before 29.62±1.35 465.1±30.6 1224.3±109.6 5.5±0.3
(n=36) after 33.36±1.74 542.9±38.5 1449.1±122.3 6.9±0.6
Δ -3.74±1.52
*-77.8±24.6
**-224.8±110.0
*-1.4±0.5
**before : before sustained contraction after : after sustained contraction
Δ : difference of MUAP parameters between before and after sustained contraction
Fig. 4. Relative changes of masseter muscle parame- ters during sustained isometric contraction.
Asterisks indicate statistically significant changes of parameters during sustained isometric contraction (*: p<0.05, **: p<0.01,
***: p<0.001).
The MFs in anterior temporal muscles of the male group were significantly higher than those in masseter muscles in both beginning (p < 0.001) and endpoint (p < 0.05) of sustained isometric contra- ction. But the MFs in the female group did not show significant differences between anterior temporal
Table 4. Median frequency(MF) values before and after sustained isometric contraction. Data presented as mean ± standard error of means. Asterisks indicate statistically significant differences of MF values between before and after sustained isometric contraction (***: p<0.001). The 'a' indicates statistically significant differences of MF values between anterior temporal and masseter muscle (a:
p<0.05, aaa: p<0.001).
MF-start(Hz) MF-end(Hz) ΔMF(Hz) Slope of MF shift
Male (n=26) Anterior Temporal 176.2±5.9
aaa117.3±7.5
a58.8±5.1
***-3.74±0.38
Masseter 152.3±5.9 98.1±6.9 54.2±4.0
***-3.32±0.29
Female (n=10) Anterior Temporal 190.0±14.5 118.0±13.4 72.0±11.5
***-4.26±0.59
Masseter 163.0±8.4 106.0±10.1 57.0±11.1
***-3.48±0.56
Total (n=36) Anterior Temporal 180.0±5.8
aaa117.5±6.5
a62.5±4.9
***-3.88±0.31
Masseter 155.3±4.9 100.3±5.7 55.0±4.1
***-3.37±0.25
MF-start : median frequency at the beginning of sustained isometric contraction MF-end : median frequency at the end of sustained isometric contraction ΔMF : the frequency difference between MF-start and MF-end
and masseter muscles. For all subjects, the MFs were significantly higher in anterior temporal muscles than those in masseter muscles in both the beginning (p < 0.001) and endpoint (p < 0.05) of sustained isometric contraction (Table 4, Fig. 5).
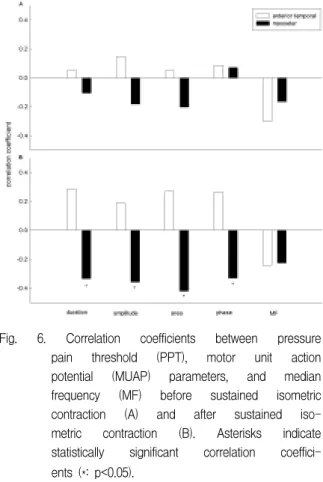
Tables 5 and 6 showed correlations between PPT, MUAP parameters, and MF in both anterior temporal and masseter muscles. Before sustained isometric contraction we could not find any significant correlations between PPT and MUAP parameters/ between PPT and MF in both two muscles. Although no significant correlations were found between PPT and MUAP parameters of anterior temporal muscle, the masseter muscle had significant weak negative correlations between PPT and MUAP parameters after sustained isometric contraction. Each correlation coefficients were as follows; duration (r = -0.335, p < 0.05), amplitude (r
= -0.359, p < 0.05), area (r = -0.421, p < 0.05), and
phase (r = -0.331, p < 0.05). In both muscles no
significant correlation was found between MF and
PPT/ between MF and MUAP parameters,
regardless of fatiguing contraction. On the other
Fig. 5. Median frequency (MF) changes during sustained isometric contraction in the male group (A), the female group (B), and total subjects (C). Asterisks indicate statistically significant decrease of median frequencies during sustained isometric contraction (***:
p<0.001). The 'a' indicates statistically significant differences of MFs between anterior temporal and masseter muscle (a:
p<0.05, aaa: p<0.001).
Table 5. Correlation coefficients between motor unit action potential parameters, pressure pain threshold (PPT), and median frequency (MF) in both anterior temporal and masseter muscles before sustained isometric contraction. Values presented as Pearson correlation coefficients (anterior temporal/masseter). Asterisks indicate statistically significant correlation coefficients (**: p<0.01).
PPT Duration Amplitude Area Phase
Duration 0.053/-0.106
Amplitude 0.148/-0.182 0.654
**/0.472
**Area 0.049/-0.202 0.901
**/0.884
**0.777
**/0.535
**Phase 0.086/ 0.072 0.880
**/0.534
**0.669
**/0.620
**0.764
**/0.338
**MF -0.300/-0.165 -0.075 /-0.168 0.009 /-0.146 0.041 /-0.119 -0.137/-0.217
Fig. 6. Correlation coefficients between pressure pain threshold (PPT), motor unit action potential (MUAP) parameters, and median frequency (MF) before sustained isometric contraction (A) and after sustained iso- metric contraction (B). Asterisks indicate statistically significant correlation coeffici- ents (*: p<0.05).
hand, there were relatively strong correlations between MUAP parameters in both muscles (p <
0.01). Figure 6 showed correlation coefficients
between PPT, MUAP parameters and MF in both
anterior temporal and masseter muscles.
Ⅳ. DISCUSSION
The definition of muscular fatigue is a failure of the muscle tissues to maintain an expected force. It can be classified into two types. One is central fatigue that is explained as a failure of the command from the motor cortex and the upper motor neuron, the other is peripheral fatigue at the end plate of motor neuron. It may be caused by a disruption in either transmission or contraction
14). Fatigue by prolonged submaximal voluntary contraction such as 70 % of maximum voluntary isometric contraction in this study resembles contraction fatigue that interferes with excitation- contraction coupling and/or metabolic processes related to these reactions. In contraction fatigue the EMG amplitude is unchanged as the force drops, or the EMG amplitude is increased while the force remains unchanged. Several factors such as low level of Ca
2+, glycogen, and adenosine triphosphate (ATP), and high level of lactate are associated with contraction fatigue
14). Two mechanisms for opti- mizing force production under fatiguing conditions are recruitment of motor units and modulation of motor unit discharge following recruitment
15). A motor unit constitutes the smallest functional element of contraction. The anatomic and physi- ologic properties of a motor unit are based on the innervation ratio, fiber density, propagation velocity, and integrity of neuromuscular transmission
16). The
shape of the MUAP waveform depends upon the motor unit architecture, i.e., the number, size, distribution of muscle fibers in the motor unit and the geometry of the end-plate zone. If the motor unit architecture is changed by disease processes such as loss of fibers and re-innervation, the MUAP waveform will equally be changed.
Quantification of the MUAP parameters such as duration, amplitude, area, and phase has been used to characterize neuromuscular disorders. For an ideal MUAP quantification one must count at least 20 different motor units in each muscle using multiple needle insertions
16). Engstrom et al.
studied the influence of MUAP sample size tolerance limits, intertrial variability, and diagnostic sensitivity in both myopathic patients and normal control group
17). They reported that although analysis of 5 potentials might be adequate for diagnosis occasionally, quantitative analysis of 20 MUAPs narrowed tolerance limits, reduced intertrial variability, and improved diagnostic sensitivity. The needle electrode registers muscle action potentials only from a restricted area of the muscle. For an adequate survey frequent needle repositioning is necessary for multiple sampling in small steps. Exploration in various directions from a single puncture site minimizes the patient's discomfort. Therefore the author measured 20 different MUAPs with careful repositioning of the needle electrode within the insertion site in the Table 6. Correlation coefficients between motor unit action potential parameters, pressure pain threshold (PPT), and median frequency (MF) in both anterior temporal and masseter muscles after sustained isometric contraction. Values presented as Pearson correlation coefficients (anterior temporal/masseter). Asterisks indicate statistically significant correlation coefficients (*: p<0.05, **:
p<0.01).
PPT Duration Amplitude Area Phase
Duration 0.285/-0.335
*Amplitude 0.188/-0.359
*0.898
**/0.564
**Area 0.268/-0.421
*0.934
**/0.918
**0.934
**/0.647
**Phase 0.263/-0.331
*0.934
**/0.897
**0.860
**/0.593
**0.853
**/0.765
**MF -0.242/-0.227 -0.289/-0.174 -0.035/-0.086 -0.121/-0.163 -0.184/-0.136
tested muscle.
The MUAP abnormalities may be assessed from their peak-to-peak amplitude, duration, and phases of the waveform and the firing rate of the motor unit. A number of parameters have been used to characterize the MUAP. It is important that these parameters reflect morphological or physiological features and can be changed by disease. Not all parameters have proven useful. The most commonly used parameters are duration, amplitude, rise-time, area and phase
18).
In this study amplitude, phase, duration, and area of MUAPs after sustained isometric contraction of masseter muscles were significantly higher than those before contraction. In anterior temporal muscle phase, duration, and area were significantly increased after sustained isometric contraction.
Lindström et al. showed that the average change in MUAP duration was linearly related to the change in the mean frequency of the power spectrum
19). Sandercock et al. have observed increases in both MUAP amplitude and duration during low- frequency electrical stimulation of the medial gastrocnemius muscle of the cats
20). Celichowski et al. studied on the changes in amplitude, duration and latency of MUAPs during fatigue in the medial gastrocnemius muscle of the rats
21). They found the amplitude of MUAPs decreased during fatigue.
They explained that redistribution of ions across cell membrane of individual muscle fibers was the main cause of the decreased MUAP amplitude during fatigue.
In this study, there was an increase of MUAP amplitude and duration during fatiguing contraction.
It is suggested that the increase in MUAP amplitude resulted from efficient synchronization of negative and positive phases of muscle fiber action potentials within the motor unit and better synchronization may also have some relation to the prolonged duration of muscle fiber action potentials. In most previous studies duration of action potential became prolonged after muscular fatigue
20,21,22). Those studies also suggested that an increased duration of action potential was related to a decreased muscle
fiber conduction velocity after muscular fatigue.
Therefore the duration of action potentials can illustrate the feature of muscular fatigue more properly than the amplitude of the potentials.
The higher number of phases in the MUAPs may be due to their higher amplitude and complexity.
Slow conduction in terminal axons and increased variability of muscle fiber diameter by muscle fiber recruitment also attribute to an increase of phases
18). Although amplitude of MUAP in anterior temporal muscle was increased during sustained isometric contraction, the statistical significance did not exist in this study. This result might be due to variable amplitude value dependent upon electrode position within same motor unit territory. Amplitude is determined by less than eight fibers, sometimes one or two fibers, within 0.5 mm from the electrode
18). Therefore the amplitude may vary considerably within the motor unit territory and the same motor unit can generate many motor unit action potentials with different amplitudes at different recording sites
16). It is therefore suggested that MUAP amplitude is not a pertinent parameter of muscular fatigue.
Duration reflects the total current generated by the fibers in the motor unit. The total current is determined by the number of muscle fibers and their cross-sectional area that are up to 2.5 mm from the recording electrode. This radius includes a large portion of the motor unit territory in muscles. The MUAP duration is increased in neuropathic patients where the motor unit size is increased due to collateral sprouting and re-innervation of the denervated muscle fibers. In myopathic patients, the MUAP duration decreases due to loss of muscle fibers, atrophy and probably fibrosis. This may alter volume conduction properties
23).
The area that is calculated by integrating the
rectified MUAP over the duration reflects the
number and the diameter of muscle fibers, as well
as the temporal distribution of the single fiber action
potentials. The area can reflect the activity of
muscle fibers better than the amplitude. Therefore
it represents similar motor unit characteristics as
amplitude and duration. In general, increase of both duration and amplitude results in increase of area.
All of amplitude, area, and duration can also reflect the diameter of the muscle fibers, the number of muscle fibers, and the fiber density of the motor units. The main difference between these parameters is the uptake area. Both duration and area are global estimators with a large uptake area while amplitude reflects activity of the fibers closest to the electrode. According to the study of Stålberg et al., amplitude and area were larger in men than in women
18). This is probably due to larger muscle fiber diameter in men than in women. No gender differences in these MUAP parameters in this study may be due to low statistical power because female subjects were not enough.
In normal motor units arrival times of the single fiber action potentials at the electrode is evenly distributed and the MUAP has a smooth bi- or triphasic shape. During the fatiguing contraction uneven distribution of the single fiber action potentials into separate groups and an increased temporal dispersion of the single fiber action potentials can result in an increased number of phases. In both neuropathic and myopathic conditions there is an increased number of complex or polyphasic MUAPs. These complex MUAPs are due to an increased variation among pathologic muscle fiber diameters causing a wider range of conduction velocities along muscle fiber membranes and, to some degree, are due to the scattered positions of end-plates after re-innervation. These two phenomena produce increased temporal dispersion among individual single fiber action potentials, causing the typical changes in MUAP shape.
Rise-time usually refers to the time it takes for signals to go from the positive to the negative peak.
It helps estimate the distance between the recording tip of the electrode and the discharging motor unit.
A MUAP accepted for quantitative measurement should have a rise time less than 0.5 ms, preferably 0.1 to 0.2 ms
16). This study includes the MUAPs whose rise time was less than 0.5 ms.
In this study there were significant correlations within MUAP parameters regardless of muscle contraction. These results consistent with the definition and representative features of each MUAP parameters.
EMG power spectral analysis was used to provide an index of localized muscular fatigue
8,9,10). There are several frequency parameters such as mean, median, and the ratio of low-frequency components to high-frequency components of the spectrum in EMG power spectral analysis. Among them it has been found that the median frequency was the least sensitive to noise and preferred parameters in most of power spectral analyses
24).
Many investigators proved that the power spectrum of the myoelectric signal is compressed into lower frequency range during sustained muscle contraction
8,9). Median frequencies in both anterior temporal and masseter muscles were equally found to be compressed significantly to lower frequency range during muscular fatigue
25,26). Theories of transition of power spectrum to lower frequency range are reduction of action potential conduction velocity, change in action potential shape, recruitment of new motor unit, and synchronization of motor unit or some combinations of these factors
9,19,27)