Received: Dec 18, 2018 Revised: Jan 12, 2019 Accepted: Feb 10, 2019 Published online Apr 3, 2019 Correspondence to: Hai-Tao Niu https://orcid.org/0000-0002-6986-9957
Department of Urology, Affiliated Hospital of Qingdao University, 16 Jiangsu Road, Shinan district, Qingdao, 266000, China.
Tel: +86-18661803117, Fax: +86-053282911825, E-mail: [email protected] Correspondence to: Wei Jiao https://orcid.org/0000-0001-9102-4478
Department of Urology, Affiliated Hospital of Qingdao University, 16 Jiangsu Road, Shinan district, Qingdao, 266000, China.
Tel: +86-15990997666, Fax: +86-053282911825, E-mail: [email protected]
*These authors contributed equally to this work as co-first authors.
Copyright © 2020 Korean Society for Sexual Medicine and Andrology
pISSN: 2287-4208 / eISSN: 2287-4690 World J Mens Health 2020 Apr 38(2): 208-219 https://doi.org/10.5534/wjmh.180124
Diagnostic Performance of 68 Gallium Labelled
Prostate-Specific Membrane Antigen Positron Emission Tomography/Computed Tomography and Magnetic Resonance Imaging for Staging the Prostate Cancer with Intermediate or High Risk Prior to Radical
Prostatectomy: A Systematic Review and Meta-Analysis
Hui Wu1,2,* , Ting Xu3,* , Xiao Wang1,2 , Yong-Bo Yu1,2 , Zhong-Yuan Fan1,2 , Dan-Xia Li1,2 , Lei Luo1,2 , Xue-Cheng Yang1,2 , Wei Jiao1,2 , Hai-Tao Niu1,2
1Department of Urology, Affiliated Hospital of Qingdao University, 2Key Laboratory of Urinary System Diseases, 3Department of Geratology, The 971th Hospital of PLA, Qingdao, China
Purpose: To compare the diagnostic efficiency of 68Gallium labelled prostate-specific membrane antigen positron emission tomography (68Ga-PSMA PET) and magnetic resonance imaging (MRI) for staging the lymph node metastases (LNMs) in the prostate cancer.
Materials and Methods: A broad search of scientific databases including PubMed, EMBASE, Web of Science, Cochrane Data- base, and Chinese Biomedicine Literature Database (updated prior to November 1st, 2018) was conducted systematically by two reviewers. In this paper, we evaluated the methodological quality of each included article independently and performed a systematic review and meta-analysis to reveal the summary of the diagnostic performance of 68Ga-PSMA PET and MRI in properly identifying LNMs of intermediate- and/or high-risk prostate cancer.
Results: Thirteen eligible articles comprising 1,597 patients were included. For LNMs detection, the pooled sensitivity and specificity of 68Ga-PSMA PET were 0.65 (95% confidence interval [CI]: 0.49–0.79) and 0.94 (95% CI: 0.88–0.97), respec- tively, while the corresponding values of MRI were 0.41 (95% CI: 0.26–0.57) and 0.92 (95% CI: 0.86–0.95). The area under the symmetric receiver-operating characteristic (SROC) curve for 68Ga-PSMA PET and MRI were 0.92 and 0.83, respectively.
Conclusions: In intermediate- or high-risk pre-treatment prostate cancer, 68Ga-PSMA PET had a higher sensitivity and a slight- ly different specificity in probing the LNMs when comparing with MRI. Moreover, the area under the SROC curve indicated that 68Ga-PSMA PET was a more effective weapon for predicting the LNMs prior to radical surgery.
Keywords: Magnetic resonance imaging; Metastasis; Meta-analysis; Positron-emission tomography; Prostate cancer
This is an Open Access article distributed under the terms of the Creative Commons Attribution Non-Commercial License (http://creativecommons.org/licenses/by-nc/4.0) which permits unrestricted non-commercial use, distribution, and reproduction in any medium, provided the original work is properly cited.
INTRODUCTION
Prostate cancer, the most frequent solid malignancy among men, has become the third leading cause of cancer-associated deaths worldwide [1,2]. An accurate preoperative assessment of the tumor stage plays an crucial role for therapy planning, and radical pros- tatectomy is a extensively used potentially curative strategy [3]. While the detection of serum prostate spe- cific antigen (PSA) levels has led to earlier diagnosis of prostate cancer [4], the conventional imaging modali- ties, including computed tomography (CT), magnetic resonance imaging (MRI), choline-based positron emis- sion tomography (PET)/CT as well as 99mTc–methylene diphosphate bone scan, are more likely to be used for evaluating local tumor stage, seminal vesicle invasion, lymph node metastases (LNMs), and skeleton meta- static lesions. However, regardless of promising results that the conventional imaging techniques including MRI have performed, a wide range of reported sensi- tivities and specificities still exhibit their limitations in the current clinical scenarios [5].
Prostate-specific membrane antigen (PSMA), a trans- membrane protein over-expressed in prostate cancer, has increasingly attracted the interest as a newly emerging approach for clinical imaging. Evidences have shown that the expression of PSMA in prostate cancer is 100- to 1,000-fold higher than that in normal tissues [6,7], and higher levels of PSMA expression have been demonstrated to be associated with increasing stage, Gleason grade and PSA level in prostate cancer [6,8].
To date, various PET ligands have been applied for the detection of prostate cancer [9], and despite the most common ligands 11 C- or 18 F-choline, a late-model probe named 68Gallium labelled prostate-PSMA ligands (68Ga-PSMA) recently has drawn a concentration of researchers [10,11]. It has been well reported that 68Ga- PSMA-PET has superior sensitivity and specificity when comparing with choline-based PET [12]. Besides, a rising number of evidence has suggested that this targeted modality may provide more precise imaging for detecting prostate cancer [13,14].
Perera et al [15] have previously performed a sys- tematic review and meta-analysis to identify the sen- sitivity and specificity in advanced prostate cancer, indicating its high level of accuracy as a predictor.
However, no relevant systematical review and meta- analysis over the comparison between 68Ga-PSMA-PET
and the conventional imaging modalities has been yet published. The utility of 68Ga-PSMA PET imaging in intermediate- and high-risk prostate cancer outlined in studies were systematically reviewed. Hence, we de- cided to perform this meta-analysis. Because the data from multi-central randomized control trials was rare, we collected as many literatures as possible to system- atically evaluate the diagnostic accuracy of Ga-PSMA PET imaging and conventional imaging modalities.
The aim of our study was to complete a meta-analysis comparing the diagnostic performance of 68Ga-PSMA- PET and the conventional imaging modalities MRI in the detection of LNMs in intermediate- and high-risk preoperative prostate cancer patients.
MATERIALS AND METHODS
1. Data sources and search strategies
A systematic review and meta-analysis was conduct- ed according to Preferred Reporting Items for System- atic Review and Meta-analysis (PRISMA) guidelines [16].
The scientific databases (PubMed, EMBASE, Web of Science, Cochrane Database, Chinese Biomedicine Literature Database) were searched by two authors independently to pick out eligible published articles (up to November 2018) using the combination of several keywords, including: (1) “prostate neoplasms” or “pros- tatic neoplasm” or “prostate cancer” or “cancer of the prostate” or “prostate malignancy”, (2) “prostate specific membrane antigen” or “PSMA”, (3) “positron emis- sion tomography” or “PET”, (4) “magnetic resonance imaging” or “MRI”. Besides, additional studies were identified from the references of original articles and reviews related to this topic.
2. Study selection criteria
Following were the inclusion criteria: (1) patients should have undergone 68Ga-PSMA PET and/or MRI.
(2) Patients should not receive radical prostatectomy or other non-surgical treatment before accepting the im- aging modalities above. (3) Patients should have been biopsy-proven intermediate- or high-risk prostate can- cer. (4) Histopathology (treated with pelvic lymph node dissection or extended pelvic lymph node dissection) as a golden standard for lymph node detection. (5) A min- imum of 10 patients should be included in the study. (6) The numbers of true-positive (TP), false-positive (FP),
true-negative (TN), and false-negative (FN) results can be calculated, (7) language of inclusion studies should be either English or Chinese.
Duplicated articles, case reports, review articles, edi- torials, clinical conference abstracts, cell and animal articles, meta-analysis were excluded to ensure the ac- curacy of the data.
3. Quality assessment
In order to evaluate the methodological quality of the eligible studies, the Quality Assessment Tool for Diagnostic Accuracy Studies version 2 (QUADAS-2) were used by two evaluators independently [17], and any discrepancies were discussed and resolved. The tool assesses the following four domains: patient selection, index test, reference standard, as well as the timing of reference test. The four domains above are all assessed in terms of risk of bias when we also assessed the degree of applicability of first three. Finally, we used Review Manager 5.3 software to evaluate the method- ological quality and draw the figures.
4. Data extraction and statistical analysis
The extracted data from the enrolled studies should obtain following basal characteristics: author, year of publication, location, study design, the number of patients, age, pre-PET PSA level, Gleason scores, his-
topathologic data, rates of imaging modalities (68Ga- PSMA PET and MRI) positivity, the stage and size of tumor. If available, the numbers of TP, FP, FN, and TN from each paper would also be calculated. The numbers were used to measure sensitivity, specificity as well as a corresponding confidence interval (CI). If needed, we would contact the corresponding author for further details and the study would be excluded if there was no response.
To synthesize the data extracted, we used the bivari- ate mixed-effects regression model [18] in our meta- analysis. Based on the two-dimensional model, we obtained logit sensitivity and specificity with their 95%
CIs. Then, pooled analysis of sensitivity, specificity and diagnostic odds ratios (DORs) for 68Ga-PSMA PET and MRI with corresponding 95% CIs was performed. Next, a summary receiver-operating characteristic (SROC) curve was back-transformed from the obtaining sum- mary sensitivity, specificity and DORs. All the data was analyzed through MIDAS module for Stata soft- ware version 14.0.
5. Heterogeneity and publication bias
The chi-square test were used to analyze the hetero- geneity between the eligible studies. I2 were measured as it lies between 0% and 100%. The respective value were approximately divided into 0%, 25%, 50%, 75%,
Records identified through database searching (n=3,044)
Records after duplicated removed (n=2,318)
Additional records identified through other sources
(n=4)
No direct linking records excluded
(n=2,130)
Records screened (n=188)
Eligible articles included for meta-analysis
(n=13)
Full-text excluded with reasons (n=175) Review article (n=12)
Case report (n=53) Comment (n=4) Meta-analysis (n=1) Not English or Chinese (n=1)
The patients accepted treatment (n=67) The raw data can not be extracted (n=30) The golden standard was not histopathology
(n=7)
Fig. 1. Flow diagram of the literature search.
Table 1. Study characteristics First author (year)CountryStudy typeSubjectMedian age (y)Median PSA (ng/mL)HPIndex testTPFPTNFNSSSP LNMs Maurer (2016) [14]GermanyRetrospective13066.511.55Yes68 Ga PET, 27188140.660.99 (45–84)(0.57–244.00)MRI181376230.440.85 van Leeuwen (2018) [21]AustraliaRetrospective140NR9.4Yes68 Ga PET, 271178240.530.88 (NR)MRI7188440.140.99 Öbek (2017) [22]TurkeyProspective516426.5Yes68 Ga PET, 853170.530.86 (58–70)(4.1–47.9)MRI193130.250.76 Zhang (2017) [23]ChinaRetrospective426937.25Yes68 Ga PET, 1412610.930.96 (55–82)(7.2–348.0)MRI1422510.930.96 Gupta (2017) [24]IndiaRetrospective12NRNRYes68 Ga PET, 714010.8 MRI41430.570.8 Budäus (2016) [25]GermanyRetrospective30628.8Yes68 Ga PET401880.331 (44–75)(1.4–376.0) Berger (2018) [26]AustraliaRetrospective50NRNRYes68 Ga PET144410.50.92 van Leeuwen (2017) [27]AustraliaProspective30658.1Yes68 Ga PET711840.640.95 (60–71)(5.2–10.1) Jeong (2013) [28]KoreaRetrospective9226710.7YesMRI827837500.140.97 (42–85)(0.3–737.0) Pinaquy (2015) [29]FranceProspective476324YesMRI333260.330.84 (50–79)(5–371) Selnæs (2018) [30]NorwayProspective2866.116.7YesMRI421460.40.88 (55–72)(6.3–56.9) von Below (2016) [31]SwedenProspective40NRNRYesMRI1121890.550.9 Van den Bergh (2015) [32]BelgiumProspective7564.610.4YesMRI13236230.360.95 (49–74)(52–71) Values are presented as number only, median (range), or percent only. PSA: prostate specific antigen, HP: histopathology, TP: true positive, FP: false positive, TN: true negative, FN: false negative, SS: sensitivity, SP: specificity, LNMs: lymph node metastases, NR: not re- ported, 68 Ga PET: 68 Gallium positron emission tomography, MRI: magnetic resonance imaging.
which indicate no, low, moderate and high heterogene- ity [19]. We would choose the random-effects models when I2 was superior to 50%; on the contrary, we pre- ferred to choose the fixed-effects models when I2 was less than 50%. To validate if there existed a threshold which was thought as one of main source of heteroge- neity, we performed Spearman correlation coefficients.
If the p-value >0.05, there was no threshold.
To test the publication bias in each study, we used the Stata 14.0 software (STATA Corp., College Station, TX, USA) to analyze all included studies according to the Deek’s test [20].
6. Ethics statement
All analyses were based on previous published stud- ies, thus no ethical approval and patient consent are required.
RESULTS
1. Study selection and the characteristics
We systematically retrieved through the scientific database (PubMed, EMBASE, Web of Science, Co- chrane Database, Chinese Biomedicine Literature Database), which identified 3,044 citations. Additional 4 citations were from the references of the eligible ar- ticles. Then, 730 duplicated and 2,130 irrelevant studies were excluded by the abstracts screening. The remain- ing 188 studies were assessed in detail and 175 of them were excluded because (1) the study type was review, case report, comment or meta-analysis (n=70); (2) the language was not English or Chinese (n=1); (3) the raw data could not be extracted from the articles (n=30);
(4) the golden standard was not histopathology (n=7);
(5) the patients accepted surgery or hormone therapy (n=67). Finally, 13 eligible articles met the inclusion cri-
Fig. 2. The detail of risk of bias.
teria. The flow diagram of the study selection process was shown in Fig. 1.
Thirteen eligible studies containing 1,597 patients who suffered biopsy-proven intermediate- or high-risk prostate cancer were included in our meta-analysis.
All the patients were prior to surgery and non-treated with hormone therapy when undergoing the imaging
examination method. The age of the patients was rang- ing from 42 to 84 years; the PSA level from 0.3 to 737 ng/mL; and the patient number ranged from 12 to 922.
In total, seven of the eligible studies were retrospec- tive, and the remaining five studies were prospective.
Among these studies, 3 were from Australia, 2 were from Germany, and 1 of each was from China, Turkey,
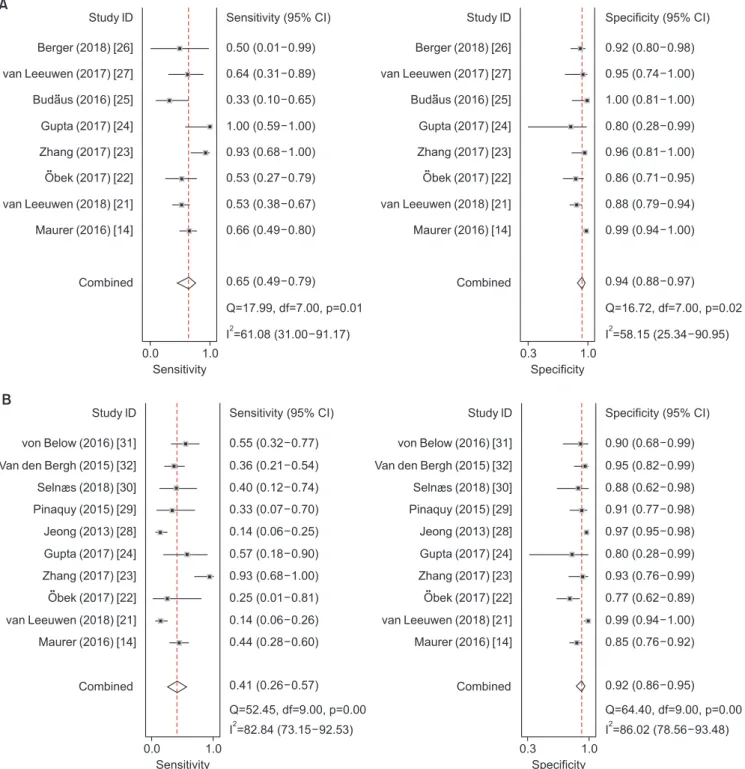
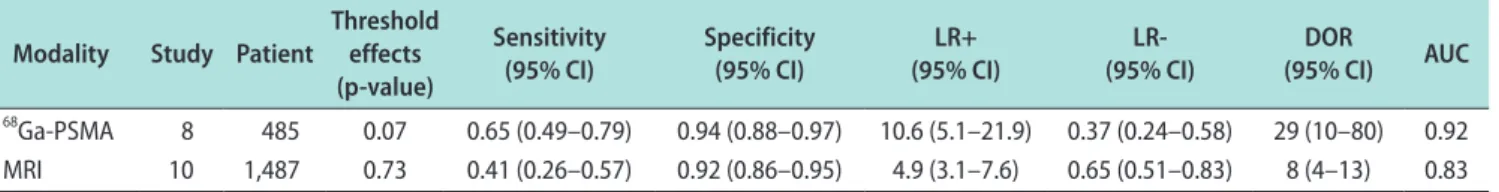
Fig. 3. Forest plot concluded the sensitivity and specificity of the two modalities. (A) the diagnostic performance of 68Gallium positron emission tomography group; (B) the diagnostic performance of magnetic resonance imaging. CI: confidence interval, df: degree of freedom.
Specificity (95% CI)
0.92 (0.80 0.98) 0.95 (0.74 1.00) 1.00 (0.81 1.00) 0.80 (0.28 0.99) 0.96 (0.81 1.00) 0.86 (0.71 0.95) 0.88 (0.79 0.94) 0.99 (0.94 1.00)
0.94 (0.88 0.97) Q=16.72, df=7.00, p=0.02 I =58.15 (25.34 90.95)2 Study lD
Berger (2018) [26]
van Leeuwen (2017) [27]
Gupta (2017) [24]
van Leeuwen (2018) [21]
Maurer (2016) [14]
Combined
0.3 1.0
Specificity
Study lD Specificity(95% CI) 0.90 (0.68 0.99) 0.95 (0.82 0.99) 0.88 (0.62 0.98) 0.91 (0.77 0.98) 0.97 (0.95 0.98) 0.80 (0.28 0.99)
0.77 (0.62 0.89) 0.99 (0.94 1.00) 0.85 (0.76 0.92) 0.93 (0.76 0.99)
0.92 (0.86 0.95) Q=64.40, df=9.00, p=0.00 I =86.02 (78.56 93.48)2
0.3 1.0
von Below (2016) [31]
Van den Bergh (2015) [32]
Pinaquy (2015) [29]
Jeong (2013) [28]
Gupta (2017) [24]
Zhang (2017) [23]
van Leeuwen (2018) [21]
Maurer (2016) [14]
Budaus (2016) [25]
Obek (2017) [22]
Obek (2017) [22]
Seln s (2018) [30]
Specificity Zhang (2017) [23]
Combined Study lD
Berger (2018) [26]
van Leeuwen (2017) [27]
Gupta (2017) [24]
Zhang (2017) [23]
van Leeuwen (2018) [21]
Maurer (2016) [14]
Sensitivity (95% CI)
0.50 (0.01 0.99) 0.64 (0.31 0.89) 0.33 (0.10 0.65) 1.00 (0.59 1.00) 0.93 (0.68 1.00) 0.53 (0.27 0.79) 0.53 (0.38 0.67) 0.66 (0.49 0.80)
0.65 (0.49 0.79) Q=17.99, df=7.00, p=0.01 I =61.08 (31.00 91.17)2
A
Combined
0.0 1.0
Sensitivity
B Study lD Sensitivity(95% CI)
0.55 (0.32 0.77) 0.36 (0.21 0.54) 0.40 (0.12 0.74) 0.33 (0.07 0.70) 0.14 (0.06 0.25) 0.57 (0.18 0.90) 0.93 (0.68 1.00) 0.25 (0.01 0.81) 0.14 (0.06 0.26) 0.44 (0.28 0.60)
0.41 (0.26 0.57) Q=52.45, df=9.00, p=0.00 I =82.84 (73.15 92.53)2
0.0 1.0
Sensitivity von Below (2016) [31]
Van den Bergh (2015) [32]
Pinaquy (2015) [29]
Jeong (2013) [28]
Gupta (2017) [24]
Zhang (2017) [23]
van Leeuwen (2018) [21]
Maurer (2016) [14]
Budaus (2016) [25]
Obek (2017) [22]
Obek (2017) [22]
Seln s (2018) [30]
Combined
Korea, India, France, Sweden, Norway and Belgium.
Other critical information is summarized in Table 1.
2. Methodological quality assessment
Referring to the QUADAS-2 quality assessment tool, seven studies enrolled consecutive patients. The index test was prior to surgery, while postoperative pathology was the only golden standard in all eligible articles, which indicated the reference standard barely influenced the result of the index test. According to the result of assessment, the overall quality of included research was credible. The summary of risk of bias and quality assessment is shown in Fig. 2.
3. Findings
In 68Ga-PSMA PET/CT group, we included eight studies [14,21-27] which represented 485 patients to identify its efficiency. The forest plot exhibited the results that the sensitivity for 68Ga-PSMA PET/CT ranged from 0.33 to 1.00, as the specificity ranged from 0.69 to 1.00 (Fig. 3A). The summary pooled parameters in 68Ga-PSMA PET/CT group were as follows: sensitiv- ity: 0.65 (95% CI: 0.49–0.79); specificity: 0.94 (95% CI:
0.88–0.97); positive likelihood ratio (LR+): 10.6 (95% CI:
5.1–21.9); negative likelihood ratio (LR-): 0.37 (95% CI:
0.24–0.58); DOR: 29 (95% CI: 10–80).
Meanwhile, in MRI group, ten articles [14,21-24,28-32]
represented 1,487 patients were evaluated. The corre- sponding values in the forest plot ranged from 0.14 to 0.93 and 0.57 to 0.96 (Fig. 3B). The summary pooled pa- rameters in MRI group were as follows: sensitivity: 0.41 (95% CI: 0.26–0.57); specificity: 0.92 (95% CI: 0.86–0.95);
LR+: 4.9 (95% CI: 3.1–7.6); LR-: 0.65 (95% CI: 0.51–0.83);
DOR: 8 (95% CI: 4–13).
Comparing the pooled data between 68Ga-PSMA PET/CT and MRI, the overall sensitivity was 0.65 (95%
CI: 0.49–0.79) versus 0.41 (95% CI: 0.26–0.57); the overall
specificity was 0.94 (95% CI: 0.88–0.97) versus 0.92 (95%
CI: 0.86–0.95), respectively; the overall LR+ was 10.6 (95% CI: 5.1–21.9) versus 4.9 (95% CI: 3.1–7.6); the overall LR- was 0.37 (95% CI: 0.24–0.58) versus 0.65 (95% CI:
0.51–0.83); and the DOR was 29 (95% CI: 10–80) versus 8 (95% CI: 4–13). 68Ga-PSMA PET/CT had a higher pooled sensitivity (0.65 versus 0.41) and a close pooled specificity (0.94 versus 0.92) when comparing with MRI.
The results above were shown in Fig. 3 and Table 2.
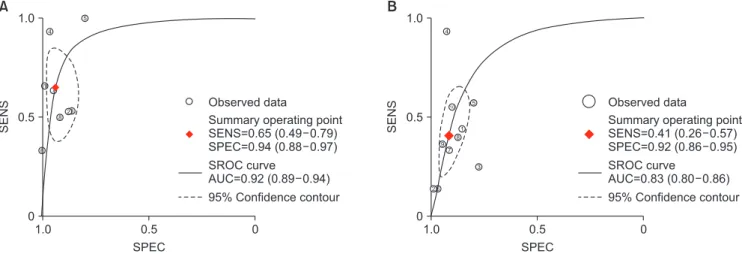
Moreover, we performed the SROC curve of 68Ga- PSMA PET/CT and MRI (Fig. 4). The area under the curve (AUC) of 68Ga-PSMA PET/CT was larger than that of MRI (0.92 versus 0.83), which suggested 68Ga- PSMA PET/CT a more efficient imaging modality when comparing with MRI.
4. Heterogeneity test
According to the result of the forest plot, the het- erogeneity of 68Ga-PSMA PET/CT and MRI was high in both sensitivity (I2=61.08% and 82.84%, respectively) and specificity (I2=58.15% and 86.02%, respectively).
For MRI group, meta-regression was used to find out the source of heterogeneity. Subsequently, we found the heterogeneity of specificity might come from the electric field strength (1.5 T or 3.0 T), and the results of meta-regression showed the p-value of specificity in electric field strength was 0.03. However, there was no significant differences between the 1.5 T group and 3.0 T group when we performed a sub-group analysis.
Therefore, our results of MRI were reliable. As for
68Ga-PSMA PET/CT, lacking enough included studies (n=8) for meta-regression, we decided to choose a ran- dom effects model to pool the data of 68Ga-PSMA PET/
CT.
Stata 14.0 software was used to analyze the diagnos- tic threshold, indicating that the Spearman correlation coefficient was 0.26 and the p-value was 0.07 for 68Ga-
Table 2. Summary of the parameters in 68Ga-PSMA PET/CT and MRI groups Modality Study Patient
Threshold effects (p-value)
Sensitivity (95% CI)
Specificity (95% CI)
LR+
(95% CI)
LR- (95% CI)
DOR
(95% CI) AUC
68Ga-PSMA 8 485 0.07 0.65 (0.49–0.79) 0.94 (0.88–0.97) 10.6 (5.1–21.9) 0.37 (0.24–0.58) 29 (10–80) 0.92 MRI 10 1,487 0.73 0.41 (0.26–0.57) 0.92 (0.86–0.95) 4.9 (3.1–7.6) 0.65 (0.51–0.83) 8 (4–13) 0.83 Values are presented as number only, median (range), or index only.
68Ga-PSMA PET/CT: 68Gallium–prostate-specific membrane antigen positron emission tomography/computed tomography, MRI: magnetic reso- nance imaging, CI: confidence interval, LR+: positive likelihood ratio, LR-: negative likelihood ratio, DOR: diagnostic odds ratio, AUC: area under the curve.
PSMA PET/CT. Meanwhile, the corresponding index for MRI was -0.85 and 0.73. No evidence revealed a sig- nificant threshold effect existing in our meta-analysis.
5. Publication bias
The results of Deek’s funnel plot test revealed that the p-values for 68Ga-PSMA PET/CT and MRI were 0.98 and 0.78, which indicated that there existed no severe publication bias. The results of Deek’s funnel plot was shown in Fig. 5.
DISCUSSION
Appropriate preoperative evaluation for the LNMs is critical for planning the most efficient prostate-cancer
therapy strategy [33]. In the recent clinical scenarios, MRI has been widely applied to predict the primary staging of the patients with prostate cancer. As a stan- dard modality, MRI is indispensable in current practice guidelines, but it still has many deficiencies. In general, MRI excessively relies on pathological changes such as morphological information and the sizes of lymph nodes. By defining pelvic lymph nodes lager than 8 to 10 mm as suspicious lesions [34,35], the fact that ap- proximately 80% of them in prostate cancer are smaller than 8 mm [36] results in the low sensitivity of LNMs detection for MRI. Hence, there is an urgent need for a more accurate implement.
As a novel targeted imaging modality, 68Ga-PSMA PET/CT has been well used in numerous published A
SENS
1.0 0
0 1.0
0.5
0.5 SPEC
Observed data
Summary operating point SENS=0.65 (0.49 0.79) SPEC=0.94 (0.88 0.97) SROC curve
AUC=0.92 (0.89 0.94) 95% Confidence contour
1
3 4
5
6 7
8
6
B
1.0 0
0 1.0
0.5
0.5
Observed data
Summary operating point SENS=0.41 (0.26 0.57) SPEC=0.92 (0.86 0.95) SROC curve
AUC=0.83 (0.80 0.86) 95% Confidence contour
1
3 4
5
7 8
2 10
9 2
SPEC
SENS
Fig. 4. Symmetric receiver-operating characteristic (SROC) curve. (A) 68Gallium–prostate-specific membrane antigen positron emission tomogra- phy/computed tomography; (B) magnetic resonance imaging group. SENS: sensitivity, SPEC: specificity, AUC: area under the curve.
A B
1/root(ESS)
1 1,000
0.10
0.15
0.20
0.25
0.30
0.35
100 Diagnostic odds ratio
Study
Regression line
1
3 4
5 6
7
8 2
10
Deeks funnel plot asymmetry test p-value=0.98
1/root(ESS)
1 1,000
0.05
0.10
0.15
0.20
0.25
0.30
100 Diagnostic odds ratio
Study
Regression line
1
3
4
5 6
7 8
2
10
Deeks funnel plot asymmetry test p-value=0.78
10 9
Fig. 5. Funnel Plot of publication bias. (A) 68Gallium–prostate-specific membrane antigen positron emission tomography/computed tomography;
(B) magnetic resonance imaging. ESS: effective sample size.
studies. However, in most of outlined data, the utility of 68Ga-PSMA PET just served as a predictor for the secondary staging with biochemical recurrence (BCR).
The published studies setting of primary staging with- out therapy are still limited. Budäus et al [25] previous- ly reported the initial experience on 68Ga-PSMA PET/
CT predicting the LNMs in the patients with prostate cancer who were prior to radical surgery. The authors retrospectively analyzed 30 patients and concluded the sensitivity and specificity of 0.33 and 1.00. Later on, in 2017, Gupta et al [24] published a research, indicating the sensitivity and specificity for detection of metastat- ic lymph nodes were 66.7% and 98.9%. In the same year, Zhang et al [23], a research team from China, delivered the results that the corresponding values changed into 93.3% and 96.6%. However, there are few multicentre prospective randomized studies. A clinical trial protocol for the comparation between 68Ga-PSMA PET and the conventional imaging modalities, which was published by Hofman et al [37], may help promote more research and offer beneficial evidence. According to the varied results, we performed this meta-analysis to identify the true efficiency of 68Ga-PSMA PET/CT.
In our meta-analysis which included 13 studies com- prising 1,597 patients, we compared the sensitivity and specificity of 68Ga-PSMA PET/CT and MRI. Previous studies reported the varied sensitivity and specificity of 68Ga-PSMA PET/CT and MRI. For 68Ga-PSMA PET/
CT, sensitivity and specificity ranged from 0.33 to 1.00 and 0.82 to 1.00, respectively. The corresponding val- ues of MRI ranged from 0.14 to 0.93 and 0.76 to 0.99, respectively. The pooled results of the eligible studies highlighted that 68Ga-PSMA PET/CT has a higher sensitivity than that of MRI (0.65 versus 0.39), and a comparable specificity (0.94 versus 0.92). When compar- ing the SROC curve, the results of AUC indicated that
68Ga-PSMA PET/CT was a more effective predictor for LNMs detection in intermediate- and high-risk prostate cancer.
Our results of 68Ga-PSMA PET/CT are different from those of a previously published meta-analysis per- formed by Perera et al [15]. In this article, they enrolled 16 articles with 1,309 patients, obtaining a pooled sen- sitivity and specificity of 0.86 and 0.86 for 68Ga-PSMA PET/CT, respectively. Moreover, they constructed the SROC curve, indicating 68Ga-PSMA PET/CT a valuable diagnostic method.
Despite the similar result of AUC, we are not sur-
prised by the difference between the two meta-analy- sis, because the different inclusion criteria resulted in the different pooled data. Specifically, in the patient selection, we only enrolled the preoperative patients without hormone therapy, however, Perera et al [15]
included a result of mixed staging patients including primary staging and secondary staging patients with BCR. With regard to the patients with BCR, several previous articles revealed a high sensitivity of LNMs detection, ranging from 77.9% to 98.8% [38-40]. The results above prompted us that 68Ga-PSMA PET/CT probably had a superior detection rate in the patients with BCR. Therefore, there is no doubt that the pooled sensitivity of Perera’s study [15] is higher than that of our meta-analysis. In addition, referring to the results mentioned above, we conferred that hormone therapy and surgery might influence the exploration ability of
68Ga-PSMA. Hence, we excluded the patients who ac- cepted hormone therapy or radical prostatectomy to dispel the confounding factors which might lead to a potentially rising bias.
As for MRI, dating back to 2008, Hövels et al [34]
had already reported a meta-analysis which included 10 studies comprising 628 patients, with a result that the pooled sensitivity and specificity of LNMs detec- tion in prostate cancer were 0.39 (95% CI: 0.19–0.56) and 0.82 (95% CI: 0.73–0.83), respectively. The outlined results above are similar to those in our study, suggest- ing MRI possess bounded ability in LNMs detection in prostate cancer. Also, MRI has its own advantages when comparing with 68Ga-PSMA PET/CT. On the one hand, the anatomic discriminative resolution of MRI is higher than that of 68Ga-PSMA PET/CT. On the other hand, the price of the two imaging techniques are not comparable. A modest price of MRI makes it a more acceptable diagnostic method for Chinese patients.
In addition, according to the result of I2 value, the heterogeneity of 68Ga-PSMA PET/CT and MRI is high in our study. Therefore, we performed meta-regression and sub-group analysis for MRI, dividing it into 1.5 T MRI and 3.0 T MRI groups, finding no significant dif- ferences between the patients receiving 3.0 T MRI and 1.5 T MRI, which demonstrated our results reliable for MRI. As for 68Ga-PSMA PET/CT group, as a result of limited statistical method to explore heterogeneity, we finally choose a random-effect model. Besides, the dif- ferences between included studies in both 68Ga-PSMA PET/CT and MRI thresholds for positivity may become
the potential source of heterogeneity.
There are a few limitations in our study.
First, without a sufficient evidence from prospective studies, a majority of the included studies for the meta- analysis were providing a small, retrospective data. As what was mentioned above, the multicentre prospective randomized studies will help accelerate the research.
Meanwhile, there was still limited data for more sub- group analysis of different characteristics, such as race (black, white and yellow race) or PSA level. Undoubt- edly, additional data will be of benefit for consummat- ing the sub-group analysis.
Second, some criteria or definition in our included literature may not conform the same standard, such as imaging protocol or the definition of sensitivity.
Third, we only enrolled published English articles, leaving out non-English or unpublished studies, which might give rise to selection bias.
CONCLUSIONS
Our meta-analysis suggested that, when comparing with MRI, 68Ga-PSMA PET had a higher sensitivity and a comparable specificity for staging the preopera- tive LNMs in the intermediate- and high-risk prostate cancer. The area under the SROC curve indicated that
68Ga-PSMA PET was potentially a more effective and appropriate imaging modality to predict the LNMs prior to a surgery strategy.
ACKNOWLEDGEMENTS
This study was financially supported by the Na- tional Natural Science Foundation of China (81772713, 81472411, 81372752, 81401899), Taishan Scholar Program of Shandong Province (tsqn20161077), Natural Science Foundation of Shandong Province (ZR2014HM088), Key Research and Development Program of Shandong Province (2018GSF118197), China Postdoctoral Science Foundation (2017M622144), Qingdao Postdoctoral Ap- plication Research Project and Qingdao Young Scien- tist Applied Basic Research Fund (15-9-1-51-jch).
Disclosure
The authors have no potential conflicts of interest to disclose.
Author Contribution
Conceptualization: HW, TX. Data curation: XW, YBY, ZYF.
Formal analysis: DXL, LL, XCY. Funding acquisition: HTN.
Investigation: YBY. Methodology: WJ. Project administration:
HTN, WJ. Resources: HW, TX. Software: HW. Supervision: HTN, WJ. Validation: XW, ZYF. Visualization: DXL. Writing–original draft: HW, TX. Writing–review & editing: HTN, WJ.
REFERENCES
1. Babb C, Urban M, Kielkowski D, Kellett P. Prostate cancer in South Africa: pathology based national cancer registry data (1986-2006) and mortality rates (1997-2009). Prostate Cancer 2014;2014:419801.
2. Bray F, Ferlay J, Soerjomataram I, Siegel RL, Torre LA, Jemal A. Global cancer statistics 2018: GLOBOCAN estimates of incidence and mortality worldwide for 36 cancers in 185 countries. CA Cancer J Clin 2018;68:394-424.
3. Loeb S, Smith ND, Roehl KA, Catalona WJ. Intermediate- term potency, continence, and survival outcomes of radical prostatectomy for clinically high-risk or locally advanced prostate cancer. Urology 2007;69:1170-5.
4. Bartsch G, Horninger W, Klocker H, Reissigl A, Oberaigner W, Schönitzer D, et al. Prostate cancer mortality after introduc- tion of prostate-specific antigen mass screening in the Federal State of Tyrol, Austria. Urology 2001;58:417-24.
5. de Rooij M, Hamoen EH, Witjes JA, Barentsz JO, Rovers MM.
Accuracy of magnetic resonance imaging for local staging of prostate cancer: a diagnostic meta-analysis. Eur Urol 2016;
70:233-45.
6. Bostwick DG, Pacelli A, Blute M, Roche P, Murphy GP.
Prostate specific membrane antigen expression in prostatic intraepithelial neoplasia and adenocarcinoma: a study of 184 cases. Cancer 1998;82:2256-61.
7. Silver DA, Pellicer I, Fair WR, Heston WD, Cordon-Cardo C. Prostate-specific membrane antigen expression in normal and malignant human tissues. Clin Cancer Res 1997;3:81-5.
8. Minner S, Wittmer C, Graefen M, Salomon G, Steuber T, Haese A, et al. High level PSMA expression is associated with early PSA recurrence in surgically treated prostate cancer.
Prostate 2011;71:281-8.
9. Jadvar H. positron emission tomography in prostate cancer:
summary of systematic reviews and meta-analysis. Tomogra- phy 2015;1:18-22.
10. Pfob CH, Ziegler S, Graner FP, Köhner M, Schachoff S, Blech- ert B, et al. Biodistribution and radiation dosimetry of (68) Ga-PSMA HBED CC-a PSMA specific probe for PET imag-
ing of prostate cancer. Eur J Nucl Med Mol Imaging 2016;43:
1962-70.
11. Herrmann K, Bluemel C, Weineisen M, Schottelius M, Wester HJ, Czernin J, et al. Biodistribution and radiation dosimetry for a probe targeting prostate-specific membrane antigen for imaging and therapy. J Nucl Med 2015;56:855-61.
12. Afshar-Oromieh A, Zechmann CM, Malcher A, Eder M, Eisenhut M, Linhart HG, et al. Comparison of PET imaging with a (68)Ga-labelled PSMA ligand and (18)F-choline-based PET/CT for the diagnosis of recurrent prostate cancer. Eur J Nucl Med Mol Imaging 2014;41:11-20.
13. Herlemann A, Wenter V, Kretschmer A, Thierfelder KM, Bartenstein P, Faber C, et al. (68)Ga-PSMA positron emission tomography/computed tomography provides accurate stag- ing of lymph node regions prior to lymph node dissection in patients with prostate cancer. Eur Urol 2016;70:553-7.
14. Maurer T, Gschwend JE, Rauscher I, Souvatzoglou M, Haller B, Weirich G, et al. Diagnostic efficacy of (68)Gallium-PSMA positron emission tomography compared to conventional im- aging for lymph node staging of 130 consecutive patients with intermediate to high risk prostate cancer. J Urol 2016;195:
1436-43.
15. Perera M, Papa N, Christidis D, Wetherell D, Hofman MS, Murphy DG, et al. Sensitivity, specificity, and predictors of positive (68)Ga-Prostate-specific membrane antigen positron emission tomography in advanced prostate cancer: a system- atic review and meta-analysis. Eur Urol 2016;70:926-37.
16. Liberati A, Altman DG, Tetzlaff J, Mulrow C, Gøtzsche PC, Ioannidis JP, et al. The PRISMA statement for reporting sys- tematic reviews and meta-analyses of studies that evaluate healthcare interventions: explanation and elaboration. BMJ 2009;339:b2700.
17. Whiting PF, Rutjes AW, Westwood ME, Mallett S, Deeks JJ, Reitsma JB, et al. QUADAS-2: a revised tool for the quality assessment of diagnostic accuracy studies. Ann Intern Med 2011;155:529-36.
18. Van Houwelingen HC, Zwinderman KH, Stijnen T. A bivari- ate approach to meta-analysis. Stat Med 1993;12:2273-84.
19. Higgins JP, Thompson SG, Deeks JJ, Altman DG. Measuring inconsistency in meta-analyses. BMJ 2003;327:557-60.
20. Deeks JJ, Macaskill P, Irwig L. The performance of tests of publication bias and other sample size effects in systematic reviews of diagnostic test accuracy was assessed. J Clin Epide- miol 2005;58:882-93.
21. van Leeuwen PJ, Donswijk M, Nandurkar R, Stricker P, Ho B, Heijmink S, et al. 68Ga PSMA PET/CT predicts complete biochemical response from radical prostatectomy and lymph node dissection in intermediate and high-risk prostate cancer.
BJU Int 2018. doi: 10.1111/bju.14506 [Epub].
22. Öbek C, Doğanca T, Demirci E, Ocak M, Kural AR, Yıldırım A, et al. The accuracy of 68Ga-PSMA PET/CT in primary lymph node staging in high-risk prostate cancer. Eur J Nucl Med Mol Imaging 2017;44:1806-12.
23. Zhang Q, Zang S, Zhang C, Fu Y, Lv X, Zhang Q, et al. Com- parison of 68Ga-PSMA-11 PET-CT with mpMRI for preop- erative lymph node staging in patients with intermediate to high-risk prostate cancer. J Transl Med 2017;15:230.
24. Gupta M, Choudhury PS, Hazarika D, Rawal S. A compara- tive study of 68gallium-prostate specific membrane antigen positron emission tomography-computed tomography and magnetic resonance imaging for lymph node staging in high risk prostate cancer patients: an initial experience. World J Nucl Med 2017;16:186-91.
25. Budäus L, Leyh-Bannurah SR, Salomon G, Michl U, Heinzer H, Huland H, et al. Initial experience of (68)Ga-PSMA PET/
ct imaging in high-risk prostate cancer patients prior to radi- cal prostatectomy. Eur Urol 2016;69:393-6.
26. Berger I, Annabattula C, Lewis J, Shetty DV, Kam J, Maclean F, et al. 68Ga-PSMA PET/CT vs. mpMRI for locoregional prostate cancer staging: correlation with final histopathology.
Prostate Cancer Prostatic Dis 2018;21:204-11.
27. van Leeuwen PJ, Emmett L, Ho B, Delprado W, Ting F, Nguy- en Q, et al. Prospective evaluation of 68Gallium-prostate- specific membrane antigen positron emission tomography/
computed tomography for preoperative lymph node staging in prostate cancer. BJU Int 2017;119:209-15.
28. Jeong IG, Lim JH, You D, Kim MH, Choi HJ, Kim JK, et al.
Incremental value of magnetic resonance imaging for clini- cally high risk prostate cancer in 922 radical prostatectomies.
J Urol 2013;190:2054-60.
29. Pinaquy JB, De Clermont-Galleran H, Pasticier G, Rigou G, Alberti N, Hindie E, et al. Comparative effectiveness of [(18) F]-fluorocholine PET-CT and pelvic MRI with diffusion- weighted imaging for staging in patients with high-risk pros- tate cancer. Prostate 2015;75:323-31.
30. Selnæs KM, Krüger-Stokke B, Elschot M, Willoch F, Størk- ersen Ø, Sandsmark E, et al. 18F-Fluciclovine PET/MRI for preoperative lymph node staging in high-risk prostate cancer patients. Eur Radiol 2018;28:3151-9.
31. von Below C, Daouacher G, Wassberg C, Grzegorek R, Gestblom C, Sörensen J, et al. Validation of 3 T MRI includ- ing diffusion-weighted imaging for nodal staging of newly diagnosed intermediate- and high-risk prostate cancer. Clin Radiol 2016;71:328-34.
32. Van den Bergh L, Lerut E, Haustermans K, Deroose CM, Oyen R, Isebaert S, et al. Final analysis of a prospective trial
on functional imaging for nodal staging in patients with prostate cancer at high risk for lymph node involvement. Urol Oncol 2015;33:109.e23-31.
33. Van Poppel H, Joniau S. An analysis of radical prostatectomy in advanced stage and high-grade prostate cancer. Eur Urol 2008;53:253-9.
34. Hövels AM, Heesakkers RA, Adang EM, Jager GJ, Strum S, Hoogeveen YL, et al. The diagnostic accuracy of CT and MRI in the staging of pelvic lymph nodes in patients with prostate cancer: a meta-analysis. Clin Radiol 2008;63:387-95.
35. Hricak H, Dooms GC, Jeffrey RB, Avallone A, Jacobs D, Ben- ton WK, et al. Prostatic carcinoma: staging by clinical assess- ment, CT, and MR imaging. Radiology 1987;162:331-6.
36. Heesakkers RA, Hövels AM, Jager GJ, van den Bosch HC, Witjes JA, Raat HP, et al. MRI with a lymph-node-specific contrast agent as an alternative to CT scan and lymph-node dissection in patients with prostate cancer: a prospective mul- ticohort study. Lancet Oncol 2008;9:850-6.
37. Hofman MS, Murphy DG, Williams SG, Nzenza T, Herschtal A, Lourenco RA, et al. A prospective randomized multicentre
study of the impact of gallium-68 prostate-specific membrane antigen (PSMA) PET/CT imaging for staging high-risk pros- tate cancer prior to curative-intent surgery or radiotherapy (proPSMA study): clinical trial protocol. BJU Int 2018;122:
783-93.
38. Hijazi S, Meller B, Leitsmann C, Strauss A, Meller J, Ritter CO, et al. Pelvic lymph node dissection for nodal oligometa- static prostate cancer detected by 68Ga-PSMA-positron emis- sion tomography/computerized tomography. Prostate 2015;
75:1934-40.
39. Hamed MAG, Basha MAA, Ahmed H, Obaya AA, Afifi AHM, Abdelbary EH. 68Ga-PSMA PET/CT in patients with rising prostatic-specific antigen after definitive treatment of prostate cancer: detection efficacy and diagnostic accuracy.
Acad Radiol 2018. doi: 10.1016/j.acra.2018.05.020 [Epub].
40. Rauscher I, Maurer T, Beer AJ, Graner FP, Haller B, Weirich G, et al. Value of 68Ga-PSMA HBED-CC PET for the assessment of lymph node metastases in prostate cancer patients with biochemical recurrence: comparison with histopathology af- ter salvage lymphadenectomy. J Nucl Med 2016;57:1713-9.
![Table 1. Study characteristics First author (year)CountryStudy typeSubjectMedian age (y)Median PSA (ng/mL)HPIndex testTPFPTNFNSSSP LNMs Maurer (2016) [14]GermanyRetrospective13066.511.55Yes68Ga PET, 27188140.660.99 (45–84)(0.57–244.00)MRI181376230.440.8](https://thumb-ap.123doks.com/thumbv2/123dokinfo/5409021.220892/4.892.157.718.107.1099/characteristics-countrystudy-typesubjectmedian-median-hpindex-testtpfptnfnsssp-maurer-germanyretrospective.webp)