저작자표시-비영리-변경금지 2.0 대한민국 이용자는 아래의 조건을 따르는 경우에 한하여 자유롭게
l 이 저작물을 복제, 배포, 전송, 전시, 공연 및 방송할 수 있습니다. 다음과 같은 조건을 따라야 합니다:
l 귀하는, 이 저작물의 재이용이나 배포의 경우, 이 저작물에 적용된 이용허락조건 을 명확하게 나타내어야 합니다.
l 저작권자로부터 별도의 허가를 받으면 이러한 조건들은 적용되지 않습니다.
저작권법에 따른 이용자의 권리는 위의 내용에 의하여 영향을 받지 않습니다. 이것은 이용허락규약(Legal Code)을 이해하기 쉽게 요약한 것입니다.
Disclaimer
저작자표시. 귀하는 원저작자를 표시하여야 합니다.
비영리. 귀하는 이 저작물을 영리 목적으로 이용할 수 없습니다.
변경금지. 귀하는 이 저작물을 개작, 변형 또는 가공할 수 없습니다.
의학석사 학위논문
수술 가능한 췌장암 환자에서의 PET/CT 의 유용성: 림프절 전이 진단 및 생존율 예측
The utility of
18F-fluorodeoxyglucose positron emission tomography/computed tomography in patients with resectable
pancreatic cancer: Diagnosing lymph node metastasis and predicting survival
울 산 대 학 교 대 학 원
[UCI]I804:48009-200000002794 [UCI]I804:48009-200000002794
수술 가능한 췌장암 환자에서의 PET/CT 의 유용성; 림프절 전이 진단 및 생존율 예측
지 도 교 수 조 재 철
이 논문을 의학석사 학위 논문으로 제출함
2017년 12월
울 산 대 학 교 대 학 원 의 학 과
김 형 래
김형래의 의학석사학위 논문을 인준함
심사위원 박설훈 인 심사위원 조재철 인 심사위원 박형우 인
울 산 대 학 교 대 학 원
ABSTRACT
Hyung Rae Kim
Department of Internal Medicine, Graduate School, University of Ulsan
Directed by Professor Jae-Cheol Jo M.D.
Purpose: To evaluate the diagnostic accuracy of 18F-fluorodeoxyglucose positron emission
tomography/computed tomography (FDG PET/CT) for lymph node (LN) metastasis and the
prognostic significance of FDG PET/CT LN parameters in patients with resectable
pancreatic cancer.
Patients and Methods: Patients with resectable pancreatic cancer who underwent staging
FDG PET/CT between May 2007 and September 2016 were retrospectively enrolled and
analyzed through medical record and image reevaluation. The diagnostic accuracy of FDG
PET/CT in predicting LN metastasis was evaluated and compared with that of enhanced CT.
Prognostic variables, including LN parameters assessed by FDG PET/CT (standardized
uptake value [SUV]LNand LN/tumor SUV ratio), that affect disease-free survival (DFS) and
overall survival (OS) were evaluated by regression analysis.
Results:When predicting LN metastasis, FDG PET/CT showed greater sensitivity, positive
predictive value, negative predictive value, and accuracy than enhanced CT. Among
prognostic factors affecting DFS, PET-positive LN (p= 0.008) and LN/tumor SUV ratio (p=
0.003) were found to be significant by regression analysis. Among variables affecting OS,
lympho-vascular invasion (p= 0.018) and LN/tumor SUV ratio (p= 0.046) were found to be
significant.
FDG PET/CT was an independent prognostic variable in both DFS and OS.
Keywords:pancreatic cancer, FDG PET/CT, LN metastasis, lymph node to tumor SUV ratio,
disease free survival, overall survival
CONTENTS
Abstract in English ··· ⅰ
Contents ··· ⅳ
List of Figures ··· ⅵ
List of Tables ··· ⅶ
Abbreviations ··· ⅷ
Introduction ··· 1
Patients and methods ··· 4
1. Patients ··· 4
2. PET/CT acquisition ··· 5
3. Image analysis ··· 6
4. Survival analysis ··· 7
5. Statistical analysis ··· 7
Results ··· 9
1. Patients characteristics ··· 9
2. Diagnostic performance for prediction of LN metastasis; FDG PET/CT vs enhanced CT ··· 12
Conclusion ··· 32
References ··· 33
Abstract in Korean ··· 42
List of Figures
Figure 1. Kaplan-Meier survival curve for DFS according to PET positive
LN(A), LN/tumor SUV ratio (B) ··· 19
Figure 2. Kaplan-Meier survival curve for OS according to LVI (A), LN/tumor
SUV ratio (B) ··· 23
List of Tables
Table 1. Clinico-pathologic characteristics ··· 10
Table 2. Diagnostic performance of FDG PET/CT and enhanced CT for LN metstasis ··· 13
Table 3. Univariate analysis of prognostic factors for DFS and OS ··· 15
Table 4. Multivariate analysis for DFS ··· 18
Table 5. Multivariate analysis for OS ··· 22
Abbreviations
CA 19-9, carbohydrate antigen 19-9 CI, confidence interval
CT, computed tomography DFS, disease free survival FDG, 18F-fluorodeoxyglucose HR, hazard ratio
LN, lymph node
LN ratio, metastatic LNs/retrieved LNs
LN/tumor SUV ratio, LN SUVmax/ tumor SUVmax
LVI, lympho-vascular invasion MD, moderate differentiation NPV, negative predictive value OS, overall survival
PD, poor differentiation
pLN stage, pathologic LN stage
pN1 stage, pathologic N1 stage
PNI, perineural invasion PPV, positive predictive value pT stage, pathologic T stage SUV, standardized uptake value SUVLN, LN SUVmax
SUVmax, maximum standardized uptake value SUVtumor, tumor SUVmax
WD, well differentiation
INTRODUCTION
Despite advances in medical technology, pancreatic cancer remains one of the
world’s deadliest malignancies. Although complete resection is curative in early-stage
pancreatic cancer, only 15%-20% of cancers are found to be resectable at the time of
diagnosis [1]. Even when complete resection is performed, recurrence develops in as high as
42% to 68% of patients, especially within the first 6 to 12 months [2]. Inoperative pancreatic
cancer is known to have a poor prognosis. The 5-year overall survival rate is usually poor,
reports being as low as <5% for locally advanced unresectable pancreatic cancer [3].
Known prognostic factors for pancreatic cancer include carbohydrate antigen 19-9
(CA 19-9) [4], pathologic T stage (pT stage), tumor size, lympho-vascular invasion (LVI),
perineural invasion (PNI), involvement of resection margin, and lymph node (LN) metastasis
[5-7]. Due to the aggressive biology of pancreatic cancer, LN metastasis is often present
from the time of cancer detection [8] and is associated with poor prognosis [9]. Thus,
accurate evaluation of LN metastasis is important for determining operative field and
predicting prognosis in pancreatic cancer [9].
Among modalities for detecting LN metastasis, conventional anatomical imaging
such as enhanced computed tomography (CT) is initially recommended [10]. However, the
diagnostic accuracy of CT in evaluating LN metastasis in pancreatic cancer is relatively low
because of the presence of many sub-centimeter LN metastases [11]. The fact that 18F-
fluorodeoxyglucose (FDG) positron emission tomography/computed tomography (PET/CT)
shows higher accuracy in the detection of pancreatic cancer and distant metastasis than
enhanced CT has been demonstrated by many previous studies [12-15]. However, although
many reports have shown that FDG PET/CT is more accurate for LN staging than enhanced
CT [16-18] in various cancers, few studies have assessed LN detection by FDG PET/CT in
pancreatic cancer, and these have presented conflicting results, with a wide range of
diagnostic accuracy [1, 19-21]. Moreover, to our knowledge, there is no study on the
prognostic significance of LN parameters in pancreatic cancer.
The aim of our study was to determine the diagnostic performance of FDG PET/CT
in predicting LN metastasis and to evaluate whether the obtained LN parameters have
prognostic significance for survival in patients with resectable pancreatic cancer.
PATIENTS AND METHODS
1.Patients
From May 2007 to September 2016, 85 patients underwent radical surgery and
were found to have pancreatic ducal adenocarcinoma. Exclusion criteria were as follows;
preoperative FDG PET/CT not performed (n=9), incomplete FDG PET/CT information (ex.:
outside PET/CT, could not measure FDG uptake, n=3), and patients treated with neoadjuvant
therapy (n=3). Finally, 70 patients were enrolled in this study.
All clinical and pathological data such as sex, age, dates of clinical importance
(operation, disease recurrence, death, and last follow-up), initial serum CA 19-9 level,
history of postoperative chemotherapy and/or radiotherapy, pT stage, pathologic LN stage
(pLN stage), tumor differentiation, T size, status of LVI or PNI, number of metastatic LNs
and LN ratio (total number of metastatic LNs divided by total number of retrieved LNs)
were collected and reviewed. TNM staging of pancreatic cancer was determined according
to the 7th edition of the American Joint Committee on Cancer manual [22]. This
retrospective study was approved by the institutional review board of our hospital.
2.PET/CT acquisition
FDG PET/CT scans were obtained from the skull base to the upper thigh using
dedicated PET/CT scanners (DSTe 8, Milwaukee, WI & Gemini 64, Philips Medical
Systems, Andover, MA, USA) after at least 6 hours of fasting and checking the blood
glucose level. The injection dose of FDG was 0.1 (Gemini) to 0.2 (DSTe) mCi/body weight
(kg) and the time interval between FDG injection and image acquisition was approximately
60 to 70 min. Low-dose non-contrast CT was performed for attenuation correction, followed
by PET acquisition of 1.5 (Gemini) to 2.5 (DSTe) min per bed (a total of 6-9 bed positions)
in 3D mode. All PET/CT images were reconstructed using an ordered-subsets expectation
maximization algorithm. Maximum intensity projection and cross-sectional (trans-axial,
coronal, sagittal) images with PET/CT fusion were generated and uploaded into the GE AW
3.Image analysis
All FDG PET/CT images were analyzed on a GE AW 4.5 workstation. To
determine whether a specific LN was positive on PET (PET-positive LN), two experienced
nuclear medicine physicians visually analyzed the scans without knowledge of the patient’s
pathologic findings. PET-positive LNs were defined as LNs whose FDG uptake was higher
than that of adjacent blood pool activity. To compare diagnostic accuracy, positive LN on CT
was defined as when the short-axis size is greater than 1 cm. Quantitative analysis of
primary tumor and LN parameters on FDG PET/CT was performed using maximum
standardized uptake value (SUVmax). SUVtumorand SUVLNwere defined as the SUVmaxof the
most avid tumor and LN. When there was no visible LN on FDG PET/CT, adjacent blood
pool activity was considered as the SUVLN. The margin of volume of interest was manually
readjusted by visual inspection to avoid overlapping of adjacent LN or non-LN FDG uptakes.
LN/tumor SUV ratio was defined as the SUVmaxratio of LN to primary tumor.
4.Survival analysis
This study assessed both disease-free survival (DFS) and overall survival (OS) as
primary outcomes. DFS was defined as the time interval (months) between the surgery and
tumor recurrence or death from any cause. Tumor recurrence based on clinical follow-up
data of the medical record was used in this study. OS was defined as the time interval
(months) between surgery and death or last follow-up.
5.Statistical Analysis
The sensitivity, specificity, positive predictive value, and negative predictive value
and accuracy of FDG PET/CT and enhanced CT in predicting LN metastasis were
statistically compared using McNemar’s test. The chi-square test and Fisher’s exact test were
used to evaluate the association between categorical variables. The independent t-test was
analysis was conducted using the Kaplan-Meier method. The Cox proportional-hazards
model was used to assess prognostic variables. All statistical analyses were performed using
SPSS (version 24 for windows; SPSS Inc.). P-value of less than 0.05 was considered
statistically significant.
RESULTS
1.Patients characteristics
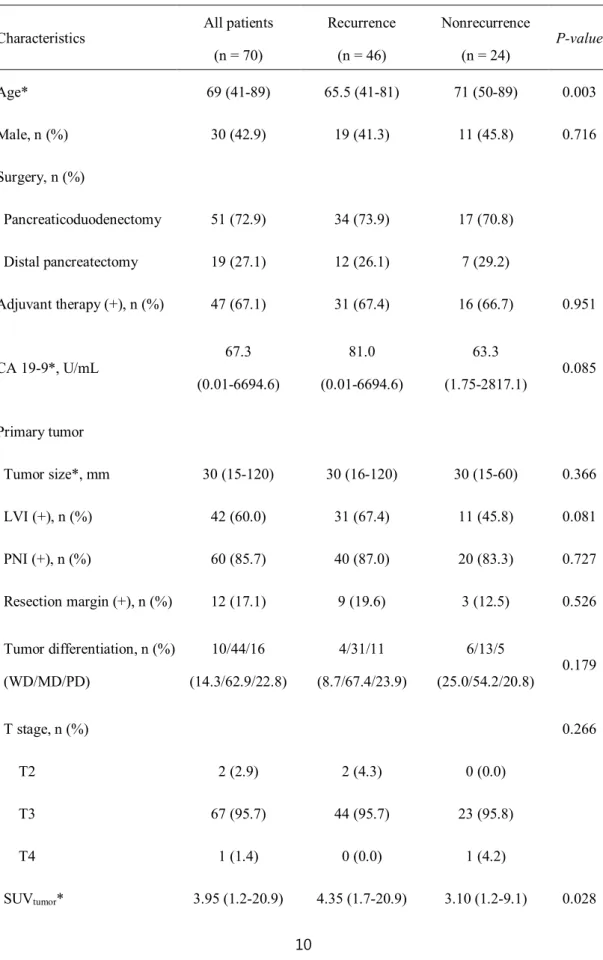
The median age of the 70 patients was 69 (41-89) years and 30 patients were men
(42.9%). The median value (range) of baseline CA 19-9 level was 67.3 (0.01-6694.6) U/mL.
The median value (range) of primary tumor size was 30 (15–120) mm, and resection margin
was positive in 12 patients (17.1%). LVI and PNI were positive in 42 (60.0%) and 60 (85.7%)
patients, respectively. N1 stage was present in 41 patients (58.6%), The median value of LN
ratio was 0.049 (0.000-1.000). The majority of pancreatic cancers showed moderate
differentiation (62.9%). In FDG PET/CT analyses, PET-positive LN was present in 31
patients (44.3%). The median values of SUVtumor, SUVLN, and LN/tumor SUV ratio were
3.95 (1.2–20.9), 1.5 (0.7–3.8), and 0.384 (0.060–1.455) respectively. Adjuvant therapy
(chemotherapy and/or radiotherapy) was performed in 47 (67.1%) patients. The detailed
characteristics of the 70 study patients are shown in Table 1.
Table 1.Clinico-pathologic Characteristics
Characteristics All patients (n = 70)
Recurrence (n = 46)
Nonrecurrence (n = 24)
P-value
Age* 69 (41-89) 65.5 (41-81) 71 (50-89) 0.003
Male, n (%) 30 (42.9) 19 (41.3) 11 (45.8) 0.716
Surgery, n (%)
Pancreaticoduodenectomy 51 (72.9) 34 (73.9) 17 (70.8)
Distal pancreatectomy 19 (27.1) 12 (26.1) 7 (29.2)
Adjuvant therapy (+), n (%) 47 (67.1) 31 (67.4) 16 (66.7) 0.951
CA 19-9*, U/mL 67.3
(0.01-6694.6)
81.0 (0.01-6694.6)
63.3
(1.75-2817.1) 0.085
Primary tumor
Tumor size*, mm 30 (15-120) 30 (16-120) 30 (15-60) 0.366
LVI (+), n (%) 42 (60.0) 31 (67.4) 11 (45.8) 0.081
PNI (+), n (%) 60 (85.7) 40 (87.0) 20 (83.3) 0.727
Resection margin (+), n (%) 12 (17.1) 9 (19.6) 3 (12.5) 0.526 Tumor differentiation, n (%)
(WD/MD/PD)
10/44/16 (14.3/62.9/22.8)
4/31/11 (8.7/67.4/23.9)
6/13/5
(25.0/54.2/20.8) 0.179
T stage, n (%) 0.266
T2 2 (2.9) 2 (4.3) 0 (0.0)
T3 67 (95.7) 44 (95.7) 23 (95.8)
T4 1 (1.4) 0 (0.0) 1 (4.2)
SUVtumor* 3.95 (1.2-20.9) 4.35 (1.7-20.9) 3.10 (1.2-9.1) 0.028
Metastatic LN
pN1 stage, n (%) 41 (58.6) 26 (56.5) 15 (62.5) 0.630
LN ratio* 0.049
(0.000-1.000)
0.052 (0.000-0.667)
0.048
(0.000-1.000) 0.861
CT positive LN, n (%) 14 (21.2) 11 (25.6) 3 (13.0) 0.346
PET positive LN, n (%) 31 (44.3) 23 (50.0) 8 (33.3) 0.183
SUVLN* 1.5 (0.7-3.8) 1.6 (0.7-3.6) 1.4 (1.0-3.8) 0.999
TNM stage, n (%) 0.530
ⅠB 2 (2.9) 2 (4.3) 0 (0.0)
ⅡA 27 (38.6) 18 (39.1) 9 (37.5)
ⅡB 40 (57.1) 26 (56.6) 14 (58.3)
Ⅲ 1 (1.4) 0 (0.0) 1 (4.2)
LN/tumor SUV ratio* 0.384
(0.060-1.455)
0.362 (0.060-0.958)
0.542
(0.190-1.455) 0.010
* Median (range)
CA 19-9, carbohydrate antigen 19-9; LVI, lympho-vascular invasion; PNI, peri-neural invasion; RM, resection margin; WD, well differentiation; MD, moderate differentiation; PD, poor differentiation;
SUVtumor, tumor SUVmax; LN, lymph node; pN1 stage, pathologic N1 stage; LN ratio, metastatic LNs/retrieved LNs; SUVLN, LN SUVmax; LN/tumor SUV ratio, LN SUVmax/ tumor SUVmax
2.Diagnostic performance for prediction of LN metastasis; FDG PET/CT vs enhanced CT
Among the 70 patients, 4 were excluded because enhanced CT was not performed, and
the remaining 66 were analyzed. Although enhanced CT showed slightly higher specificity
than FDG PET/CT, FDG-PET/CT showed higher diagnostic performance in sensitivity
(61.0%), positive predictive value (PPV, 80.7%), negative predictive value (NPV, 59.0%),
and accuracy (68.6%) than enhanced CT (p < 0.001) (Table 2).
Table 2. Diagnostic peformance of FDG PET/CT and enhanced CT for LN metastasis
Sensitivity (%) Specificity (%) PPV (%) NPV (%) Accuracy (%)
FDG PET/CT 61.0 79.3 80.7 59.0 68.6
Enhanced CT 25.0 84.6 71.4 42.3 48.5
PPV, positive predictive value; NPV, negative predictive value,
3.Evaluation of prognostic factors for DFS and OS
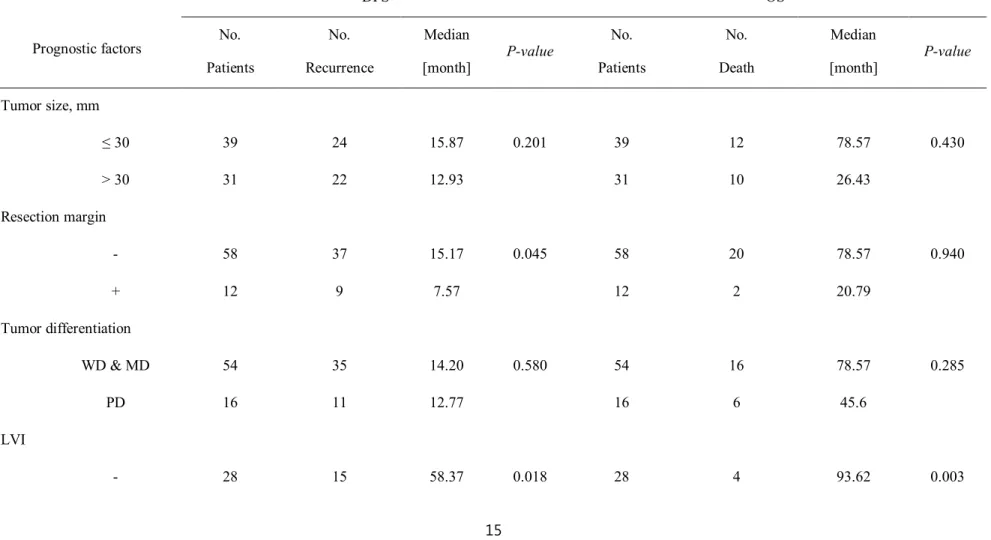
The cut-off values for tumor size, SUVtumor, LN ratio, SUVLN, LN/tumor SUV ratio,
and CA 19-9 level were 30 mm, 3.95, 0.049, 1.5, 0.384, 67.30 U/mL, respectively. In
univariate analysis for DFS, the resection margin (p= 0.045), LVI (p= 0.018), SUVtumor(p=
0.021), PET positive LN (p= 0.049) and LN/tumor SUV ratio (p= 0.018) were statistically
significant (Table 3). Multivariate analysis was performed using these significant parameters
and only PET-positive LN (p= 0.008, hazard ratio [HR] 2.294, 95% confidence interval [CI]
1.247 to 4.211) and LN/tumor SUV ratio (p= 0.003, HR 2.396, 95% CI 0.213 to 0.735) were
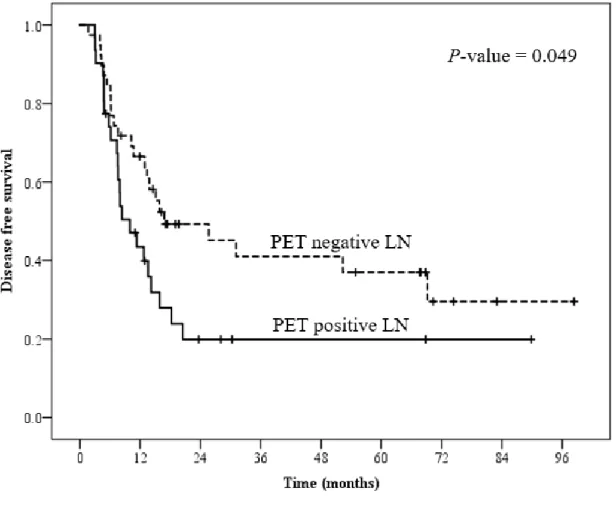
determined to be independent prognostic factors associated with DFS (Table 4). Figure 1
shows Kaplan-Meier survival graphs according to PET-positive LN and LN/tumor SUV
ratio in DFS.
Table 3. Univariate analysis of prognostic factors for DFS and OS
Prognostic factors
DFS OS
No.
Patients
No.
Recurrence
Median
[month] P-value No.
Patients
No.
Death
Median
[month] P-value Tumor size, mm
≤ 30 39 24 15.87 0.201 39 12 78.57 0.430
> 30 31 22 12.93 31 10 26.43
Resection margin
- 58 37 15.17 0.045 58 20 78.57 0.940
+ 12 9 7.57 12 2 20.79
Tumor differentiation
WD & MD 54 35 14.20 0.580 54 16 78.57 0.285
PD 16 11 12.77 16 6 45.6
+ 42 31 12.77 42 18 26.43 PNI
- 10 6 20.47 0.457 10 2 68.38 0.273
+ 60 40 13.40 60 20 78.57
SUVtumor
≤ 3.95 35 20 25.67 0.021 35 9 78.57 0.073
> 3.95 35 26 8.40 35 13 41.64
pLN stage
N0 29 20 13.40 0.993 29 11 68.15 0.686
N1 41 26 14.20 41 11 78.57
LN ratio
≤ 0.049 35 23 15.17 0.500 35 11 74.86 0.645
> 0.049 35 23 12.93 35 11 41.23
PET positive LN
- 39 23 16.87 0.049 39 12 78.57 0.435
+ 31 23 9.97 31 10 41.23 SUVLN
≤ 1.5 38 23 16.87 0.058 38 13 78.57 0.724
> 1.5 32 23 8.40 32 9 31.87
LN/tumor SUV ratio
≤ 0.384 34 26 10.70 0.018 34 15 26.43 0.007
> 0.384 36 20 20.47 36 7 90.86
Adjuvant therapy
- 23 15 12.77 0.554 23 5 72.34 0.678
+ 47 31 13.87 47 17 41.23
CA19-9, U/mL
≤ 67.30 35 23 14.20 0.707 35 14 41.23 0.420
> 67.30 35 23 12.93 35 8 72.22
DFS, disease free survival; OS, overall survival; WD, well differentiation; MD, moderate differentiation; PD, poor differentiation; LVI, lympho-vascular invasion;
Table 4. Multivariate analysis for DFS
Prognostic factors P-value Hazard Ratio
(Confidence interval)
PET positive LN 0.008 2.294 (1.247-4.211)
LN/tumor SUV ratio 0.003 0.396 (0.213-0.735)
DFS, disease free survival; LN/tumor SUV ratio, LN SUVmax/ tumor SUVmax
Figure 1. Kaplan-Meier survival curve for DFS according to PET positive LN(A), LN/tumor SUV ratio (B).
(A)
(B)
DFS, disease free survival; LN/tumor SUV ratio, LN SUVmax/ tumor SUVmax;
In univariate analysis for OS, LVI (p= 0.003) and LN/tumor SUV ratio (p= 0.007)
were significant factors. The LVI (p = 0.018, HR 3.894, 95% CI 1.263 to 12.005) and
LN/tumor SUV ratio (p = 0.046, HR 0.390, 95% CI 0.155 to 0.983) were also found to be
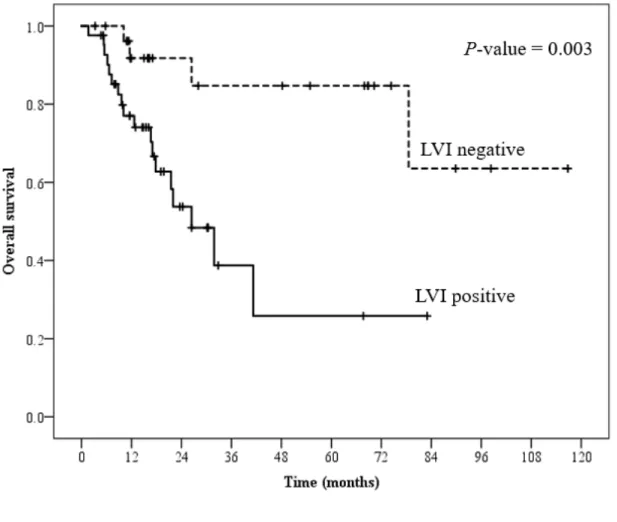
statistically independent prognostic factors in multivariate analysis (Table 5). Figure 2 shows
Kaplan-Meier survival graphs according to LVI and LN/tumor SUV ratio in OS.
Table 5. Multivariate analysis for OS
Prognostic factors P-value Hazard Ratio
(Confidence interval)
LVI 0.018 3.894 (1.263 - 12.005)
LN/tumor SUV ratio 0.046 0.390 (0.155 - 0.983)
OS, overall survival; LVI, lympho-vascular invasion; LN/tumor SUV ratio, LN SUVmax/ tumor SUVmax
Figure 2. Kaplan-Meier survival curve for OS according to LVI (A), LN/tumor SUV ratio (B).
(A)
(B)
OS, overall survival; LVI, lympho-vascular invasion; LN/tumor SUV ratio, LN SUVmax/ tumor SUVmax
DISCUSSION
The aims of this study were to evaluate whether LN evaluation by FDG PET/CT is
feasible for predicting LN metastasis and whether FDG PET/CT-derived LN parameters
may serve as prognostic factors in patients with resectable pancreatic cancer. The present
study found that FDG PET/CT has a higher diagnostic accuracy than enhanced CT and that
PET-positive LN and LN/tumor SUV ratio are independent prognostic factors for survival.
To our knowledge, this study is the first to assess the value of PET/CT-derived LN
parameter as a prognostic parameter in patients with pancreatic cancer.
Unlike other types of cancer, only a small number of studies have assessed LN
metastasis by using FDG PET/CT in pancreatic cancer. When first reported in 1994, the
sensitivity of PET for predicting LN metastasis was 76%, whereas that of CT was as low as
18% in 17 patients with pancreatic cancer [21]. Another study reported that the sensitivity,
specificity, and accuracy of FDG PET for predicting metastasis were 70%, 97%, and 87%
cancer. However, the sensitivity of FDG PET/CT was as low as 30% in a prospective study
[1]. The reason for this variability in diagnostic performance is thought to be due to the
differences in study population and cut-off values used for determining LN metastasis. In the
present study in which we evaluated a relatively larger population and used blood-pool
activity for cut-off SUV values, the diagnostic performance of FDG PET/CT was
statistically greater than that of enhanced CT and results were similar to those of a previous
meta-analysis [14].
Several studies have assessed the value of FDG PET/CT for predicting prognosis in
pancreatic cancer. SUVtumor reflects glucose metabolic activity of the primary tumor and its
prognostic significance has been reported in several studies [23-27]. Although SUVtumor is
associated with survival in pancreatic cancer, the optimal cut-off SUVmaxof primary tumor
has been variably reported, with a wide range from 3.0 to 6.8 [23-27]. The reason for various
cut-off values may be due to differences in patient number and characteristics (cancer stage).
A recent study with similar patient characteristics and cut-off value as in our study reported
that SUVtumor > 4.2 (p = 0.047) is an independent prognostic factor for recurrence-free
survival in pancreatic cancer [28]. In our study, SUVtumor was significantly associated with
DFS (p = 0.021) by univariate analysis, even though it was not significant by multivariate
analysis. SUVtumor was not significantly associated with OS. For these reasons, SUVtumor
alone may not be enough to predict preoperative prognosis in resectable pancreatic cancer
despite its importance.
The association between the PET/CT-derived LN parameter and prognosis has not
been reported in pancreatic cancer. In other types of cancer, as with high metabolic activity
of the primary tumor, high metabolic activity of LNs is also associated with poor prognosis
[29-32]. In the present study, metabolic activity of LNs higher than that of the adjacent blood
pool was positively associated with DFS (p= 0.049). We suggest that pancreatic cancer with
PET-positive LN may require close follow-up to quickly detect tumor recurrence. However,
this was a retrospective study performed at a single center and there may be limitations in
multicenter trials are needed to evaluate the prognostic value of PET-positive LN in
pancreatic cancer.
Because a LN is usually much smaller than the primary tumor, its metabolic
activity often shows a partial volume effect [33]. For this reason, a PET-derived LN
parameter, such as SUVLN, is often underestimated and may not be a reliable prognostic
factor. To overcome this problem, LN/tumor SUV ratio was proposed as a factor that is less
affected by the partial volume effect because it assesses the relationship between SUVmax
values of the primary tumor and the LN. Several recent studies have evaluated the clinical
significance of this new parameter [34-37]. Mattes et al. reported that LN/tumor SUV ratio
was more accurate than SUVtumorwhen assessing nodes of low-to-intermediate SUV in non-
small cell lung cancer [34]. Cerfolio et al. reported that LN/tumor SUV ratio of the
mediastinal lymph nodes predicts mediastinal nodal pathology in patients with non-small
cell lung cancer [37]. Park et al. reported that LN/tumor SUV ratio predicts the presence of
axillary LN metastasis in breast cancer [36]. Kim et al. reported that LN/tumor SUV ratio
was an independent factor for predicting relapse in invasive ductal breast cancer [35].
To date, the prognostic significance of LN/tumor SUV ratio in pancreatic cancer has not
been reported. In the present study, LN/tumor SUV ratio was a statistically significant
parameter for predicting both DFS and OS. Unlike previous studies that showed a positive
correlation, we detected a negative correlation between LN/tumor SUV ratio and survival,
using a cut-off ratio value of 0.384. This may be because unlike in other types of cancer,
SUVLNwas much lower than SUVtumorand was within a narrow range. Primary tumor SUV
seems to be a more significant factor for LN/tumor SUV ratio than in other types of cancer.
Further studies are needed to clarify the relationship between LN/tumor SUV ratio and
survival in pancreatic cancer.
This study also analyzed other well-known prognostic factors obtained from
clinicopathologic data along with PET-derived LN parameters. Among these, resection
margin and LVI were statistically significant factors for DFS by univariate analysis.
parameters in multivariate analysis. For OS, LVI alone was an independent factor. There is a
limitation in applying these results in the general population because this study assessed only
a limited group with resectable pancreatic cancer. There have been conflicting results on the
prognostic significance of LVI [38-40]. Further large studies are needed to clarify the extent
to which LVI affects prognosis.
This study had several limitations. First, it was a retrospective study performed at a
single institution. Selection bias may be present, although our study had relatively more
patients than those of prior studies. Second, these results were derived from patients who
underwent surgical resection and may not be applicable to patients with inoperable
pancreatic cancer. Third, partial volume effects in small sized tumors and LNs may have
affected the results of this study. However, LN/tumor SUV ratio, which is relatively
unaffected by the partial volume effect, was found to be an independent prognostic factor in
this study.
The clinical implication of the present study is that FDG PET/CT is applicable for risk
stratification in pancreatic cancer before surgery. In particular, PET/CT-derived LN
parameters, such as PET-positive LN and LN/tumor SUV ratio, were significant for survival
in resectable pancreatic cancer. Unlike pathologic parameters that are assessable only after
surgery, PET/CT-derived LN parameters can predict prognosis before surgery and may be
useful for establishing a fast and proper treatment plan. In addition, the parameters can help
in selecting a high-risk group that requires active surveillance for the early detection of
recurrence after treatment.
CONCLUSION
FDG PET/CT has a higher diagnostic accuracy in predicting LN metastasis than
that of enhanced CT in patients with resectable pancreatic cancer. This is the first study to
evaluate the prognostic significance of PET/CT-derived LN parameters in pancreatic cancer.
PET-positive LN and LN/tumor SUV ratio were independent prognostic factors for DFS.
LVI and LN/tumor SUV ratio were significant factors for OS. LN/tumor SUV ratio was the
only prognostic parameter for DFS and OS and may be used for risk stratification in patients
with resectable pancreatic cancer.
REFERENCES
1. Kauhanen, S.P., et al., A prospective diagnostic accuracy study of 18F-
fluorodeoxyglucose positron emission tomography/computed tomography,
multidetector row computed tomography, and magnetic resonance imaging in
primary diagnosis and staging of pancreatic cancer. Ann Surg, 2009. 250(6): p.
957-63.
2. Kleeff, J., et al., Surgery for recurrent pancreatic ductal adenocarcinoma. Ann Surg,
2007. 245(4): p. 566-72.
3. Balaban, E.P., et al., Locally Advanced, Unresectable Pancreatic Cancer: American
Society of Clinical Oncology Clinical Practice Guideline. J Clin Oncol, 2016. 34(22):
p. 2654-68.
4. Dong, Q., et al., Elevated serum CA19-9 level is a promising predictor for poor
prognosis in patients with resectable pancreatic ductal adenocarcinoma: a pilot
5. Lewis, R., et al., A contemporary analysis of survival for resected pancreatic ductal
adenocarcinoma. HPB (Oxford), 2013. 15(1): p. 49-60.
6. Hata, S., et al., Prognostic impact of postoperative serum CA 19-9 levels in
patients with resectable pancreatic cancer. Ann Surg Oncol, 2012. 19(2): p. 636-41.
7. Kato, K., et al., Prognostic factors for survival after extended pancreatectomy for
pancreatic head cancer: influence of resection margin status on survival. Pancreas,
2009. 38(6): p. 605-12.
8. Grassetto, G. and D. Rubello, Role of FDG-PET/CT in diagnosis, staging, response
to treatment, and prognosis of pancreatic cancer. Am J Clin Oncol, 2011. 34(2): p.
111-4.
9. Raut, C.P., et al., Impact of resection status on pattern of failure and survival after
pancreaticoduodenectomy for pancreatic adenocarcinoma. Ann Surg, 2007. 246(1):
p. 52-60.
10. Zamboni, G.A., et al., Pancreatic adenocarcinoma: value of multidetector CT
angiography in preoperative evaluation. Radiology, 2007. 245(3): p. 770-8.
11. Soriano, A., et al., Preoperative staging and tumor resectability assessment of
pancreatic cancer: prospective study comparing endoscopic ultrasonography,
helical computed tomography, magnetic resonance imaging, and angiography.
Am J Gastroenterol, 2004. 99(3): p. 492-501.
12. Nunna, P., et al., The Role of Positron Emission Tomography/Computed
Tomography in Management and Prediction of Survival in Pancreatic Cancer. J
Comput Assist Tomogr, 2016. 40(1): p. 142-51.
13. Rijkers, A.P., et al., Usefulness of F-18-fluorodeoxyglucose positron emission
tomography to confirm suspected pancreatic cancer: a meta-analysis. Eur J Surg
Oncol, 2014. 40(7): p. 794-804.
14. Wang, Z., et al., FDG-PET in diagnosis, staging and prognosis of pancreatic
carcinoma: a meta-analysis. World J Gastroenterol, 2013. 19(29): p. 4808-17.
influences on the management of resectable pancreatic cancer and its cost-
effectiveness. Ann Surg, 2005. 242(2): p. 235-43.
16. Heusner, T.A., et al., Diagnostic value of full-dose FDG PET/CT for axillary lymph
node staging in breast cancer patients. Eur J Nucl Med Mol Imaging, 2009. 36(10):
p. 1543-50.
17. Kato, H., et al., The additional value of integrated PET/CT over PET in initial lymph
node staging of esophageal cancer. Oncol Rep, 2008. 20(4): p. 857-62.
18. Antoch, G., et al., Non-small cell lung cancer: dual-modality PET/CT in
preoperative staging. Radiology, 2003. 229(2): p. 526-33.
19. Ruf, J., et al., Impact of FDG-PET/MRI image fusion on the detection of pancreatic
cancer. Pancreatology, 2006. 6(6): p. 512-9.
20. Nishiyama, Y., et al., Evaluation of delayed additional FDG PET imaging in patients
with pancreatic tumour. Nucl Med Commun, 2005. 26(10): p. 895-901.
21. Bares, R., et al., F-18 fluorodeoxyglucose PET in vivo evaluation of pancreatic
glucose metabolism for detection of pancreatic cancer. Radiology, 1994. 192(1): p.
79-86.
22. Edge, S.B. and C.C. Compton, The American Joint Committee on Cancer: the 7th
edition of the AJCC cancer staging manual and the future of TNM. Ann Surg
Oncol, 2010. 17(6): p. 1471-4.
23. Yamamoto, T., et al., Preoperative FDG-PET predicts early recurrence and a poor
prognosis after resection of pancreatic adenocarcinoma. Ann Surg Oncol, 2015.
22(2): p. 677-84.
24. Moon, S.Y., et al., Predictive value of maximum standardized uptake value
(SUVmax) on 18F-FDG PET/CT in patients with locally advanced or metastatic
pancreatic cancer. Clin Nucl Med, 2013. 38(10): p. 778-83.
25. Choi, H.J., et al., Prognostic value of 18F-fluorodeoxyglucose positron emission
tomography in patients with resectable pancreatic cancer. Yonsei Med J, 2013.
26. Sperti, C., et al., 18-Fluorodeoxyglucose positron emission tomography in
predicting survival of patients with pancreatic carcinoma. J Gastrointest Surg,
2003. 7(8): p. 953-9; discussion 959-60.
27. Nakata, B., et al., Prognostic predictive value of 18F-fluorodeoxyglucose positron
emission tomography for patients with pancreatic cancer. Int J Oncol, 2001. 19(1):
p. 53-8.
28. Im, H.J., et al., Prognostic Value of Metabolic and Volumetric Parameters of
Preoperative FDG-PET/CT in Patients With Resectable Pancreatic Cancer. Medicine
(Baltimore), 2016. 95(19): p. e3686.
29. Vatankulu, B., et al., Does Metastatic Lymph Node SUVmax Predict Survival in
Patients with Esophageal Cancer? Mol Imaging Radionucl Ther, 2015. 24(3): p.
120-7.
30. Shi, D., et al., The preoperative SUVmax for (18)F-FDG uptake predicts survival in
patients with colorectal cancer. BMC Cancer, 2015. 15: p. 991.
31. Okereke, I.C., et al., Standard uptake value predicts survival in non-small cell lung
cancer. Ann Thorac Surg, 2009. 88(3): p. 911-5; discussion 915-6.
32. Berghmans, T., et al., Primary tumor standardized uptake value (SUVmax)
measured on fluorodeoxyglucose positron emission tomography (FDG-PET) is of
prognostic value for survival in non-small cell lung cancer (NSCLC): a systematic
review and meta-analysis (MA) by the European Lung Cancer Working Party for
the IASLC Lung Cancer Staging Project. J Thorac Oncol, 2008. 3(1): p. 6-12.
33. Sahani, D.V., et al., State-of-the-Art PET/CT of the Pancreas: Current Role and
Emerging Indications. RadioGraphics, 2012. 32(4): p. 1133-1158.
34. Mattes, M.D., et al., Ratio of Lymph Node to Primary Tumor SUV on PET/CT
Accurately Predicts Nodal Malignancy in Non-Small-Cell Lung Cancer. Clin Lung
Cancer, 2015. 16(6): p. e253-8.
35. Kim, Y.H., et al., Axillary Lymph Node-to-Primary Tumor Standard Uptake Value
Breast Cancer. J Breast Cancer, 2015. 18(2): p. 173-80.
36. Park, J., et al., Lymph node to primary tumor SUV ratio by 18F-FDG PET/CT and
the prediction of axillary lymph node metastases in breast cancer. Clin Nucl Med,
2014. 39(4): p. e249-53.
37. Cerfolio, R.J. and A.S. Bryant, Ratio of the maximum standardized uptake value on
FDG-PET of the mediastinal (N2) lymph nodes to the primary tumor may be a
universal predictor of nodal malignancy in patients with nonsmall-cell lung cancer.
Ann Thorac Surg, 2007. 83(5): p. 1826-9; discussion 1829-30.
38. Sahin, I.H., et al., Association of diabetes and perineural invasion in pancreatic
cancer. Cancer Med, 2012. 1(3): p. 357-62.
39. Uson Junior, P.L., et al., Higher overall survival in metastatic pancreatic cancer: the
impact of where and how treatment is delivered. Einstein (Sao Paulo), 2015. 13(3):
p. 347-51.
40. Chen, J.W., et al., Predicting patient survival after pancreaticoduodenectomy for
malignancy: histopathological criteria based on perineural infiltration and
lymphovascular invasion. HPB (Oxford), 2010. 12(2): p. 101-8.
국문 요약
연구목적: 수술 가능한 췌장암 환자의 림프절 전이를 평가하는 데 있어 양전자
단층 촬영 검사의 진단 정확도를 평가하고, 양전자 단층 촬영 검사에서 얻어진
림프절 관련 변수 중 이 환자 군의 예후를 예측하는데 의미 있는 인자들에 대해
알아본다.
방법: 2007년 5월부터 2016년 9월까지 본원에서 췌장암 진단 하에 수술 전 양
전자 단층 촬영 검사를 시행하고 이어서 수술을 시행 받은 환자들의 의무기록
및 영상 검사를 후향적으로 분석 하였다. 병리 소견을 기준으로 양전자 단층 촬
영 검사와 조영 증강 전산화 단층촬영 사이 림프절 전이 진단 정확도를
McNemar test를 통해 통계학적으로 비교하였다. 양전자 단층 촬영 검사를 통해
얻어진 림프절 관련 변수들이 무병생존기간 및 전체생존기간에 미치는 영향은
Kaplan-Meier survival analysis와 Cox proportional-hazards regression을 통
하여 평가하였다.
결과: 림프절 전이를 예측하는데 있어서 양전자 단층 촬영 검사는 조영 증강 전
산화 단층 촬영보다 높은 민감도, 양성예측도, 음성 예측도, 정확도를 보여주었
다. 무병생존기간은 양전자 단층 촬영 검사에서 림프절이 주변 혈액풀보다 높은
섭취를 보일 때 (p = 0.008), 림프절과 원발 종양 사이의 FDG 섭취 비가 낮을수
록 (p = 0.003) 통계학적으로 의미 있는 감소를 보였다. 전체 생존 기간은 수술
후 얻은 종양조직에서 림프관 침윤이 있을 때 (p = 0.018) 그리고 림프절과 종양
사이의 FDG 섭취 비가 낮을수록 (p = 0.046) 의미 있게 감소하는 것으로 나타
났다.
결론: 양전자 단층 촬영 검사는 췌장암 환자에서 수술 전 림프절 전이를 평가하
는데 있어서 전통적인 영상 검사인 조영 증강 전산화 단층 촬영 보다 높은 진단
정확도를 나타내었다. 그리고 림프절과 원발 종양 사이의 FDG 섭취 비는 수술
가능한 췌장암의 무병 생존 기간과 전체 생존 기간을 예측하는 데 좋은 예후인
중심단어: 췌장암, 양전자 단층 촬영 검사, 림프절 전이, 림프절과 원발 종양 사
이의 FDG 섭취 비, 무병 생존 기간, 전체 생존 기간