Original Article: Biochemistry/Molecular Biology
Extraction Conditions for Phenolic Compounds with Antioxidant Activities from White Rose Petals
Jae Kwon Choi · Yoon Bok Lee* · Kyun Hee Lee · Hae Cheon Im · Yun Bae Kim · Ehn Kyoung Choi · Seong Soo Joo · Su Kil Jang · Nam Soo Han · Chung Ho Kim
Received: 21 December 2014 / Accepted: February 5 2015 / Published Online: 30 June 2015
© The Korean Society for Applied Biological Chemistry 2015
Abstract The extract of white rose petals has an antioxidant effect and can be used to treat allergic disease. The purpose of this study was to identify optimal conditions for extracting anti- oxidative compounds from white rose petals with 2,2-diphenyl-1- picrylhydrazyl scavenging activities. A response surface methodology based on a central composite design was used to investigate the effects of three independent variables: ethanol concentration (X1), extraction temperature (X2), and extraction time (X3). The estimated optimal conditions for obtaining phenolic compounds with antioxidant activities were as follows: ethanol concentration of 42% (X1), extraction time of 80 min (X3), and extraction temperature of 75oC (X2). The estimated optimal conditions for obtaining flavonoid compounds with antioxidant effects were an
ethanol concentration of 41% (X1), extraction time of 119 min (X3), and an extraction temperature of 75oC (X2). Under these conditions, predicted response values for the phenolic and flavonoid contents were 243.5 mg gallic acid equivalent/g dry mass and 19.93 mg catechin equivalent (CE)/g dry mass, respectively.
Keywords anti-oxidative compounds · response surface methodology · total flavanoid contents · total phenolic contents · white rose petals
Introduction
Phenolic compounds are naturally occurring bioactive phytochemicals found in plants (Cowan, 1999; Kris-Etherton et al., 2002). The chemical structures of these reagents consist of a hydroxyl group bonded directly to one or more aromatic benzene rings (Cai et al., 2006). Many types of phenolic compounds including flavonoids, anthocyanins, and carotenoids are found in a wide range of foods such as herbs, vegetables, and legumes(Rauha et al., 2000; Zheng and Shiow, 2001; Cai et al., 2004; López-Amorós et al., 2006;
Huang et al., 2007). Phenolic compounds possess antioxidant properties that help protect against free radical damage by donating a hydrogen atom, and reduce the risk of various diseases associated with oxidative stress (Rice-Evans et al., 1996; Kähkönen et al., 1999). Therefore, consumption of natural antioxidants containing phenolic compounds may help protect the human body against various disorders such as cancer, diabetes, and cardiovascular disease(Rao et al., 1995; Stephens et al., 1996; Padayatty et al., 2003; Bajpai et al., 2005; Al-Mustafa and Al-Thunibat, 2008).
Roses are ornamental plants grown in gardens or parks. Many species of roses have long been used in herbal and folk medicines to alleviate menstruation problems, treat blood circulation disorders, and control cancer growth(Kwon et al., 2006; Shafei et al., 2010;
J. K. Choi · Y. B. Lee · K. H. Lee · H. C. Im
Central Research Institute, Dr. Chung’s Food Co. Ltd., Cheongju, Chungbuk 361-782, Republic of Korea
Y. B. Kim · E. K. Choi
College of Veterinary Medicine, Chungbuk National University, Chungbuk 361-763, Republic of Korea
S. S. Joo · S. K. Jang
Department of Marine Molecular Biotechnology, College of Life Science, Gangneung-Wonju National University, Gangneung 210-702, Republic of Korea
N. S. Han
Department of Food Science and Technology, Chungbuk National University, Chungbuk 361-763, Republic of Korea
C. H. Kim
Department of Food and Nutrition, Seowon University, Cheongju, Chungbuk, 361-742, Republic of Korea
*Corresponding author (Y. B. Lee: [email protected])
This is an Open Access article distributed under the terms of the Creative Commons Attribution Non-Commercial License (http://creativecommons.
org/licenses/by-nc/3.0/) which permits unrestricted non-commercial use, distribution, and reproduction in any medium, provided the original work is properly cited.
Rezaie-Tavirani et al., 2013) A recent study demonstrated that flowers of Rosa spp. contain a high level of phenolic compounds with a significant antioxidant capacity (VanderJagt et al., 2002).
Many investigations have also revealed that roses contain a wide diversity of phenolic compounds such as gallic acid, kaempferol, rutin, myricetin, and quercetin that not only possess antioxidant activities but also exert anti-allergic, anti-inflammatory, anti- atopic, antibacterial, antiviral, antifungal, antidepressant, and anti- stress effects (Jeon et al., 2009; Ulusoy et al., 2009; Talib and Mahasneh, 2010; Boskabady et al., 2011).
In the food industry, organic cultured roses are known as edible flowers and phenolic compounds extracted from this plant have been used to make tea and functional beverages that exert beneficial effects on human health (Vinokur et al., 2006). In addition, the essential oil extracted from rose flowers are ingredients for perfumes and cosmetics. Essential rose oil is rich in polyunsaturated fatty acids derived from α-linolenic acid, linoleic acid, ascorbic acid, and α-tocopherol that have a high antioxidant capacity and can regulate numerous bodily functions.
Due to the great interest in the use of natural and functional ingredients derived from rose flowers, it is important to identify optimum conditions for extracting phenolic compounds from roses with high antioxidant capacities more effectively and economically. Until now, solvent extraction has been a widely utilized technique designed to recover soluble phenolic compounds from roses using solvents such as water, ethanol, methanol, or acetone. Baydar and Baydar (2013) reported that the organic solvent extracts from white or red rose flowers may contain high concentrations of antioxidants. In fact, extraction with 85%
ethanol produced a significantly higher yield and the antimicrobial effect of the resulting extract was more potent than that of other ethanol extracts. However, research regarding white roses is lacking and the extraction of phenolic compounds from white rose petals using a response surface methodology (RSM) has not been previously reported. RSM is a mathematical and statistical technique for exploring the interactions between several variables and one or more response variables. The objective of the present study was to identify and optimize highly efficient processes for extracting phenolic compounds from white rose petals using an RSM. A central composite design (CCD) for three variables including ethanol concentration, reaction temperature, and reaction time was employed.
Materials and Methods
Plant material and chemicals. White rose (Rosa spp.) petals harvested in May 2013 were purchased from Roserangs farm (Korea), then dried and milled using a cutter mill (Tefal Ltd., China). The milled petals were passed through a sieve (Chung Gye Sang Gong S.A., Korea) and a fraction that was sieved was then passed through a 14-mesh (1.41 mm) sieve and retained on a 20-mesh (0.84 mm) sieve before being collected. Ethanol was purchased from Merck (Whitehouse Station, USA). Folin-Ciocalteu
phenol reagent (2 N); 1,1-diphenyl-2-picrylhydrazyl (DPPH), sodium nitrite, aluminum chloride, catechin hydrate, and gallic acid monohydrate reagent were purchased from Sigma-Aldrich Chemical Co. (USA). All chemicals were of analytical grade.
Extraction procedure. Milled dry petals (10 g) were dispersed in 250 mL of solvents with various ethanol-to-water ratios (1:99- 99:1) in 1 L glass bottles (Schott UK Ltd., UK) to prevent solvent loss during extraction of the anti-oxidative compounds. The bottles were placed in a shaking water bath (Jeio Tech. Co., Ltd., Korea) set at a speed of 120 r/min and the desired temperature (25–75oC). After extraction, the petals were filtered through Whatman filter paper no. 4 (Whatman Inc., USA) using a vacuum pump (BOC International Ltd., London, UK). The extracts were vacuum evaporated on a rotary evaporator(BÜCHI, Switzerland) with water bath at 40oC until the ethanol was removed and then the extracts were freeze-dried at −60oC for 24 h using a freeze- dryer (Ilshinbiobase Co. Ltd., Korea). The dried extracts were used as experimental samples to measure phenolic extraction yield, phenolic compound contents, and antioxidant activity.
Measurement of total phenolic contents (TPC) and total flavanoid contents (TFC). The TPC of the rose petal extracts were determined according to a colorimetric Folin-Ciocalteu method (Fernandes de Oliveira et al., 2012). For this, 100µL of the diluted extract (1:20) in distilled water were mixed with 50µL of 2 N Folin-Ciocalteu reagent and incubated for 5 min at room temperature in the dark. Next, 300µL of a 20% sodium carbonate solution was added to the reaction and the solution was incubated for 15 min at room temperature. After centrifugation at 1,250 rpm for 5 min, absorbance of the supernatants was read at 725 nm using a UV-Vis Max 384 spectrophotometer (Molecular Devices, USA). The results are expressed as mg gallic acid equivalents (GAE)/g (dry weight) of sample. The TFC of the rose petal extracts were determined using a modified aluminum chloride method based on the formation of a flavonoid-aluminum complex (Zhishen Jia et al., 1999). A 5-mL aliquot of the extracts in 0.5 mL of deionized water was mixed with 0.3 mL of 5% sodium nitrite.
After 5 min, 0.3 mL of 10 % aluminum chloride was added. After 6 min, 2 mL of 1 M sodium hydroxide was added and the total volume was brought up to 10 mL with deionized water. Absorbance was read at 510 nm. The results are expressed as mg of catechin equivalents (CE)/g (dry weight) of sample.
Determination of total antioxidant activity (TAA). Antioxidant activity of the extract was evaluated with a DPPH assay as previously described(Brand-Williams et al., 1995). Briefly, 3 mL of 81µM DPPH solution was mixed with 200 µL of the rose petal extract solution and allowed to incubated in the dark at room temperature for 1 h. The absorbance was then measured at 517 nm using a UV-Vis Max 384 spectrophotometer. Ascorbic acid was used as the positive control and all measurements were performed in triplicate. The DPPH radical scavenging capability was calculated by comparing the absorbance values of the control and samples using the following formula: total antioxidant activity (%)=(1− absorbance of sample/absorbance of control)×100.
Statistical analysis. All experiments were performed in triplicate.
Data are expressed as the mean ± standard deviation (SD).
Differences were analyzed with a one-way analysis of variance (ANOVA), Tukey’s multiple comparison test, and Dunnett’s multiple comparison test using GraphPad Prism version 5.03 (USA). P-values less than 5% (p <0.05) were considered statistically significant. The CCD was established using MINITAB Release 14 software (Minitab Inc., State College, USA).
CCD. A CCD consisting of 20 experimental runs was used to characterize the relationships between the dependent variables (extraction yield, TPC, TFC, and TAA) with three independent variables (ethanol concentration, extraction temperature, and extraction time) at five levels (−1.68, −1, 0, +1, and +1.68). The coded levels and center point values of the three independent variables are presented in Table 1. The center point values were determined based on preliminary experimental data (Figs. 1, 2, and 3). All experiments were conducted in triplicate. To evaluate
suitability of the extraction conditions, a quadratic regression model was used. The equation for the model was as follows:
where Y is the predicted response, β0 is a constant, βi is the linear coefficient, βii is the quadratic coefficient, βij is the interaction coefficient, and Xi and Xj are independent variables. Adequacy of the model was determined by the coefficient of determination R2 while significance of the model was determined based on the F- test and p-values.
Results and Discussion
Determination of the experimental ranges. The appropriate experimental ranges of ethanol concentration and extraction time were examined. Differences in polarity according to the ethanol concentration may affect phenolic compound recovery and profiles. Liquid-to-solid ratio and particle size of rose petal were also important factors. Polyphenol extraction from white rose petals and anti-oxidative properties of the recovered compounds have been rarely studied, so we performed experiments to determine the appropriate experimental conditions and ranges for the extraction procedure. Extraction time for the phenolic contents varied the most among the independent variables. Time had a significant effect (p <0.05) on phenolic content extraction. The phenolic contents after 5, 10, 20, 60, 120, and 180 min of extraction were 88.33, 106.91, 201.76, 222.77, 208.00 and 194.78 mg GAE/g dry mass, respectively. When the extraction time was 60 min, the phenolic contents had a maximum of 222.77 mg GAE/g dry mass.
Y β0 βiXi
i 1=
∑
3 βiiXi2 i 1=∑
3 βijXiXj i j< 1=∑
3∑
+ + +
=
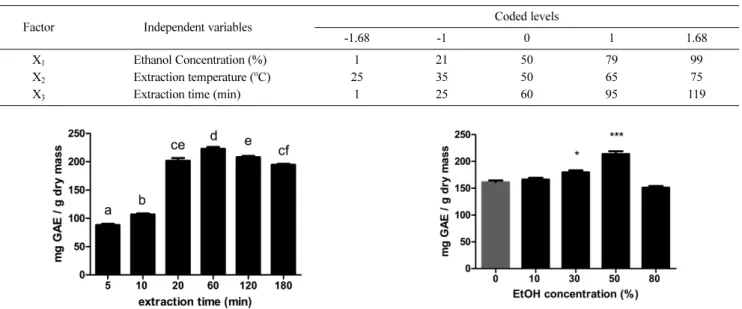
Table 1 The coded levels of 3 independent variables in the central composite design for optimization of extraction conditions
Factor Independent variables Coded levels
-1.68 -1 0 1 1.68
X1 Ethanol Concentration (%) 1 21 50 79 99
X2 Extraction temperature (oC) 25 35 50 65 75
X3 Extraction time (min) 1 25 60 95 119
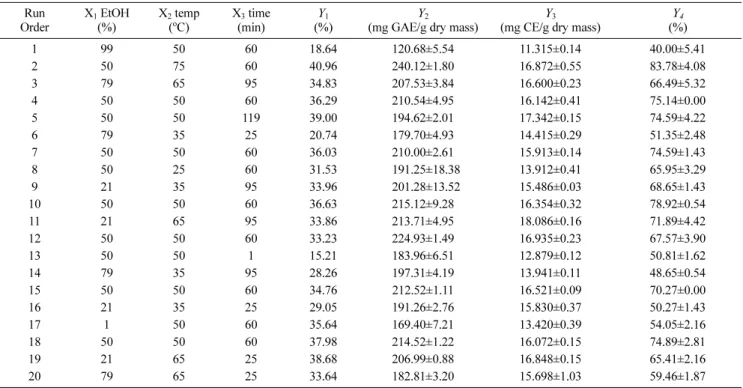
Fig. 1 Effect of time on the extraction of phenolic contents from white rose petals with 50% ethanol solution at 50oC, at the liquid-to-solid ratio of 25:1. Different letters indicate significant differences between groups (p <0.05).
Fig. 2 Effect of the liquid-to-solid ratio on the extraction of phenolic contents from white rose petals with 50% ethanol solution at 50oC for 2 h. Different letters indicate significant differences between groups (p <0.05).
Fig. 3 Effect of ethanol concentration on the extraction of phenolic contents from white rose petals at fixed extraction conditions (50oC, 2 h, liquid-to-solid ratio of 25:1). *p <0.05 in comparison to the 0% ethanol solution, ***p <0.001 in comparison to the 0% ethanol solution.
Kinetics of the extraction procedure could be divided into two phases: a first phase from 5 to 60 min, and second phase from 60 to 180 min (Fig. 1). During the first phase, the phenolic contents were quickly extracted. During the second phase, the extracted phenolic contents were slowly decreased. Prolonged extraction time could lead to degradation of some flavonoid compounds due to exposure to factors such as light, polyphenol oxidase and heating (Juntachote et al., 2006; Chirinos et al., 2007; Suganya Devi et al., 2012). Results of Tukey’s multiple comparison test showed that significant differences existed among almost all groups, but there was no significant difference between 20 and 120 min, or 20 and 180 min. Effects of the liquid-to-solid ratio on the extraction of anti-oxidative compounds from white rose petals were assessed under three conditions. The liquid-to-solid ratios varied from 15:1 to 35:1, and the extraction was carried out at 50oC for 2 h. Effects of the liquid-to-solid ratio were evaluated based on the amount of phenolic contents that was recovered (Fig.
2). The liquid-to-solid ratio had a significant effect (p <0.05) on phenolic content extraction. Phenolic contents obtained with liquid-to-solid ratios of 15:1, 25:1, and 35:1 were 188.73, 214.11, and 201.93 mg GAE/g dry mass, respectively. Results of Tukey’s multiple comparison test showed that significant differences existed among all experimental groups (p <0.05). Therefore, a ratio of 25:1 was needed to collect the most phenolic compounds (214.11 mg GAE/g dry mass) from white rose petals. Ethanol concentration is a very important independent variable that affected the yield of phenolic compounds or flavonoids from white rose petals. The impact of ethanol concentration on the extraction of phenolic compounds from white roses was evaluated with four concentrations (10, 30, 50, and 80%) of ethanol in water
(Fig. 3). Ethanol concentration had a significant effect (p <0.05) on phenolic content recovery. The phenolic contents obtained with ethanol concentrations of 0, 10, 30, 50, and 80% were 161.24, 166.38, 179.67, 213.84, and 151.16 mg GAE/g dry mass, respectively. The amount of phenolic contents increased when the ethanol concentration was increased up to 50%. When the ethanol concentration was 80%, the phenolic contents had a minimum value of 151.16 mg GAE/g dry mass. Results of Dunnett’s multiple comparison test showed that significant differences existed at concentrations of 30 and 50 % compared to the control (p <0.05), but no significant difference was observed with concentrations of 10 or 80%. Therefore, an ethanol concentration of 50% was found to be the most suitable for extracting phenolic compounds.
Statistical analysis and model fitting. The dependent variables of 20 runs using the CCD are presented in Table 2. A response surface analysis of dependent variables was performed to assess the quality of fit to the quadratic models. Results showing the quadratic model fit based on the coefficient of determination R2 are presented in Table 3. Statistical significance of the models was determined by the F and p-values. Results of the ANOVA for the independent variables are presented in Table 4. The lack-of-fit (p >0.05) indicated the suitability between models and experimental data.
Extraction yields. Unpublished data showed that the antioxidant activity of the phenolic compounds extracted using ethanol was the highest. Therefore, extraction performed in the current study was carried out using ethanol. Extraction yield expressed as the percentage of weight of the crude extract to that of the dried white rose petals (10 g) is presented in Table 2. The maximum yield (40.9%) was obtained with X1=50%, X2=75oC, and X3=60 min.
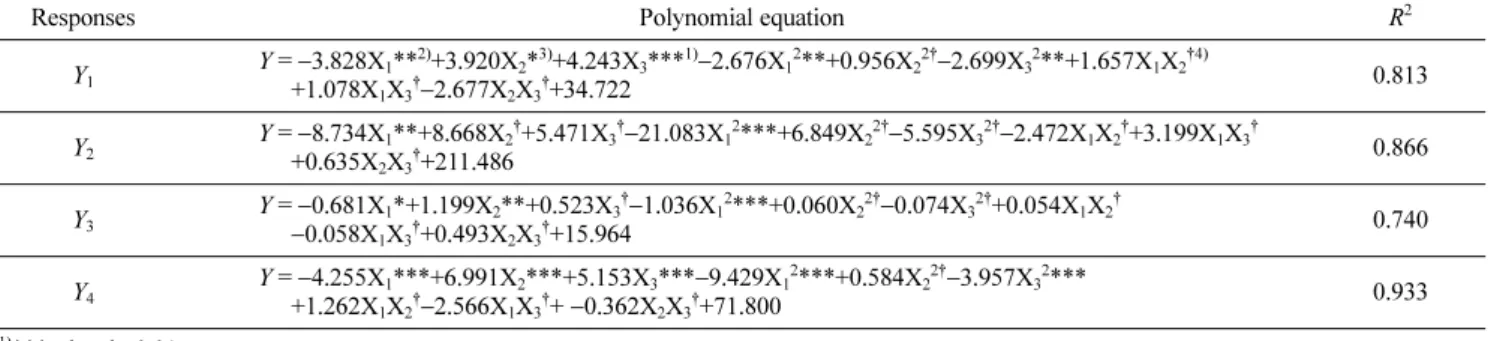
Table 2 Central composite design of the independent variables (X1, X2 and X3) and experimental results for the response variables, extraction yield (Y1), total phenolic contents (Y2), total flavonoid contents (Y3) and total antioxidant activities (Y4)
Run Order
X1 EtOH (%)
X2 temp (oC)
X3 time (min)
Y1
(%)
Y2
(mg GAE/g dry mass)
Y3
(mg CE/g dry mass)
Y4
(%)
1 99 50 60 18.64 120.68±5.54 11.315±0.14 40.00±5.41
2 50 75 60 40.96 240.12±1.80 16.872±0.55 83.78±4.08
3 79 65 95 34.83 207.53±3.84 16.600±0.23 66.49±5.32
4 50 50 60 36.29 210.54±4.95 16.142±0.41 75.14±0.00
5 50 50 119 39.00 194.62±2.01 17.342±0.15 74.59±4.22
6 79 35 25 20.74 179.70±4.93 14.415±0.29 51.35±2.48
7 50 50 60 36.03 210.00±2.61 15.913±0.14 74.59±1.43
8 50 25 60 31.53 0191.25±18.38 13.912±0.41 65.95±3.29
9 21 35 95 33.96 0201.28±13.52 15.486±0.03 68.65±1.43
10 50 50 60 36.63 215.12±9.28 16.354±0.32 78.92±0.54
11 21 65 95 33.86 213.71±4.95 18.086±0.16 71.89±4.42
12 50 50 60 33.23 224.93±1.49 16.935±0.23 67.57±3.90
13 50 50 1 15.21 183.96±6.51 12.879±0.12 50.81±1.62
14 79 35 95 28.26 197.31±4.19 13.941±0.11 48.65±0.54
15 50 50 60 34.76 212.52±1.11 16.521±0.09 70.27±0.00
16 21 35 25 29.05 191.26±2.76 15.830±0.37 50.27±1.43
17 1 50 60 35.64 169.40±7.21 13.420±0.39 54.05±2.16
18 50 50 60 37.98 214.52±1.22 16.072±0.15 74.89±2.81
19 21 65 25 38.68 206.99±0.88 16.848±0.15 65.41±2.16
20 79 65 25 33.64 182.81±3.20 15.698±1.03 59.46±1.87
The minimum yield (15.2%) was obtained with X1=50 %, X2= 50oC, and X3=1 min. The model for extraction yield had an adequate coefficient of determination R2 (0.813). Results of the
ANOVA for the model were significant (p-value =0.011). The linear and quadratic coefficients (p <0.05) were significant while the cross product not significant. The influence of X3 (extraction Table 3 The fitted model for extraction yield (Y1), total phenolic contents (Y2), total flavonoids contents (Y3) and total antioxidant activities (Y4) in coded variables
Responses Polynomial equation R2
Y1 Y = −3.828X1**2)+3.920X2*3)+4.243X3***1)−2.676X12**+0.956X22†−2.699X32**+1.657X1X2†4)
+1.078X1X3†−2.677X2X3†+34.722 0.813
Y2 Y = −8.734X1**+8.668X2†+5.471X3†−21.083X12***+6.849X22†−5.595X32†−2.472X1X2†+3.199X1X3†
+0.635X2X3†+211.486 0.866
Y3 Y = −0.681X1*+1.199X2**+0.523X3†−1.036X12***+0.060X22†−0.074X32†+0.054X1X2†
−0.058X1X3†+0.493X2X3†+15.964 0.740
Y4 Y = −4.255X1***+6.991X2***+5.153X3***−9.429X12***+0.584X22†−3.957X32***
+1.262X1X2†−2.566X1X3†+ −0.362X2X3†+71.800 0.933
1)***p-level <0.01.
2)**p-level <0.05.
3)*p-level <0.1.
4)†p-level >0.1.
Table 4 Analysis of variance for response of dependent variables (Y1, Y2, Y3, and Y4)
Responses Source DF SS MS F-value p-value
Y1 Model 9 741.94 82.438 4.84 0.011
Linear 3 482.07 152.570 8.96 0.003
Quadratic 3 205.99 68.665 4.03 0.041
Cross-product 3 53.88 17.960 1.05 0.411
Residual 10 170.30 17.030
Lack of fit 5 156.88 31.376 11.69 0.009
Pure error 5 13.42 2.684
Total 19 912.24
Y2 Model 9 10096.7 1121.86 7.15 0.002
Linear 3 2747.7 541.08 3.45 0.060
Quadratic 3 7237.8 2412.61 15.38 0.000
Cross-product 3 111.2 37.05 0.24 0.869
Residual 10 1568.5 156.85
Lack of fit 5 1419.5 283.90 9.53 0.014
Pure error 5 149.0 29.79
Total 19 11665.2
Y3 Model 9 40.453 4.495 3.15 0.044
Linear 3 23.343 5.385 3.78 0.048
Quadratic 3 15.976 5.325 3.24 0.049
Cross-product 3 1.134 0.378 0.27 0.849
Residual 10 14.249 1.425
Lack of fit 5 13.571 2.714 20.00 0.003
Pure error 5 0.679 0.136
Total 19 54.702
Y4 Model 9 2494.75 277.19 15.43 0.000
Linear 3 967.98 258.14 14.37 0.001
Quadratic 3 1466.33 488.78 27.21 0.000
Cross-product 3 60.44 20.15 1.12 0.386
Residual 10 179.66 17.79
Lack of fit 5 98.90 19.78 1.22 0.415
Pure error 5 80.76 16.15
Total 19 2674.41
time) on Y1 was most important (p <0.01, coefficient of regression
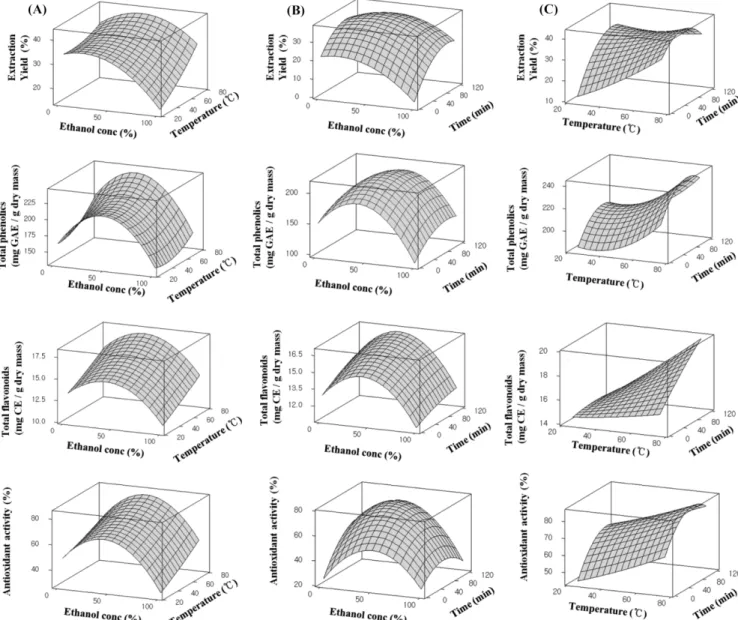
=4.243). The response surface plots for optimizing the extraction conditions are presented in Fig. 4. Extraction yield increased with an increase in extraction temperature and reached the maximum at a ethanol concentration of 43%, extraction time of 60 min. Kim and Hong. (2012) previously reported that ethanol extraction yields for Lespedeza cuneata were affected by extraction time and ethanol concentration. The response surface plots were similar to the results from our study.
TPC. As shown in Table 2, the maximum content (240.12 mg GAE/g dry mass) was obtained with X1=50%, X2=75, and X3= 60 min. The minimum content (120.68 mg GAE/g dry mass) was obtained with X1=99%, X2=50oC, and X3= 60 min. The model had an adequate coefficient of determination R2 (0.866) and the result of the ANOVA for the model was significant (p-value =
0.002). The quadratic coefficient (p <0.05) was significant while the linear and cross product were not. The influence of X1 (ethanol concentration) on Y2 was the most important (p <0.01, coefficient of regression =−21.083). Therefore, the TPC were more influenced by ethanol concentration than the other variables. The response surface plots for optimizing the extraction conditions are presented in Fig. 4. Min et al. (2010) previously reported on the TPC and TFC from Zizyphus jujuba Mill. Leaves were the most affected by ethanol concentration. These results were similar to ones from our study.
TFC. TFC ranged from 11.315 mg CE/g dry mass to 18.086 mg CE/g dry mass. The experimental conditions to recover the maximum contents were X1=21%, X2=65oC, and X3=95 min. The model had an adequate coefficient of determination R2 (0.740) and the result of the ANOVA for the model was significant (p-value =
Fig. 4 Response surface plots for extraction yield, TPC, TFC, and antioxidant activities (DPPH radical scavenging). (A) Interaction of ethanol concentration and extraction temperature; (B) Interaction of ethanol concentration and extraction time; (C) Interaction of extraction temperature and extraction time.
0.044). The linear and quadratic coefficients (p <0.05) were significant but the cross product was not. The influence of X1 (ethanol concentration) on Y3 was the most important (p <0.01, coefficient of regression =−1.036). The response surface plots for optimizing the extraction conditions are presented in Fig. 4.
TAA. According to the DPPH assay, experimental conditions that produced extracts with a maximum antioxidant activity were X1= 50%, X2=75oC, and X3=60 min. Conditions that resulted in extracts with the minimum antioxidant activity were X1=99%, X2
=50oC, and X3=60 min. The model had an adequate coefficient of determination R2 (0.933) and results of the ANOVA for the model were significant (p <0.001). The linear and quadratic coefficients (p <0.01) were significant while the cross product and lack of fit were not. The influence of all independent variables on Y4 was important (p <0.01). Our results indicated that the total antioxidant activity was more influenced by ethanol concentration than the other variables. The response surface plots for optimizing the extraction conditions are presented in Fig. 4. Koh et al. (2008) previously reported that antioxidant activity of extracts from dandelion leaves is affected by extraction time and extraction temperature. The response surface plots were similar to results from our.
Optimization and verification. The optimal conditions were identified based on combinations of two or more variables. Table 5 shows predicted values of response variables in optimal conditions.
The estimated optimal conditions for recovering phenolic contents with antioxidant activities were an ethanol concentration of 42%
(X1), extraction time of 80 min (X3), and extraction temperature of 75oC (X2). The estimated optimal conditions for collecting flavonoid contents with antioxidant properties were an ethanol concentration of 41% (X1), extraction time of 119 min (X3), and extraction temperature of 75oC. Under these conditions, the predicted responses values for the phenolic and flavonoid contents were 243.5 mg GAE/g dry mass and 19.93 mg CE/g dry mass, respectively. All models for the responses values of extraction yield had an adequate coefficient of determination R2 and great significance (p <0.05).
This results of analysis verified that the response model was adequate for reflecting the expected optimization. Therefore, the
models can be successfully employed to optimize the conditions for extracting anti-oxidative compounds from white rose petals.
Acknowledgment This research was supported by High Value-added Food Technology Development Program, Ministry of Agriculture, Food and Rural Affairs (MAFRA; grant number 113034-3).
References
Al-Mustafa AH and Al-Thunibat OY (2008) Antioxidant Activity of Some Jordanian Medicinal Plants Used Traditionally for Treatment of Diabetes. Pak J Biol Sci 11(3), 351–8.
Bajpai M, Pande A, Tewari SK, and Prakash D (2005) Phenolic Contents and Antioxidant Activity of Some Food and Medicinal Plants. Int J Food Sci Nutr 56(4), 287–91.
Baydar NG and Baydar H (2013) Phenolic Compounds, Antiradical Activity and Antioxidant Capacity of Oil-Bearing Rose ( Rosa Damascena Mill.) Extracts. Ind Crops Prod 41, 375–80.
Boskabady MH, Shafei MN, Saberi Z, and Amini S (2011) Pharmacological Effects of Rosa Damascena. Iran J Basic Med Sci 14(4), 295–307.
Brand-Williams W, Cuvelier ME, and Berset C (1995) Use of a Free Radical Method to Evaluate Antioxidant Activity. Lebensm Wiss u Technol 28(1), 25–30.
Cai YH, Luo Q, Sun M, and Corke H (2004) Antioxidant Activity and Phenolic Compounds of 112 Traditional Chinese Medicinal Plants Associated with Anticancer. Life Sci 74(17), 2157–84.
Cai YZ, Sun M, Xing J, Luo Q, and Corke H (2006) Structure–radical Scavenging Activity Relationships of Phenolic Compounds from Traditional Chinese Medicinal Plants. Life Sci 78(25), 2872–88.
Chirinos R, Rogez H, Campos D, Pedreschi R, and Larondelle Y (2007) Optimization of extraction conditions of antioxidant phenolic compounds from mashua tubers. Separation and Purification Technology 55, 217–
25.
Cowan MM (1999) Plant Products as Antimicrobial Agents. Clin Microbiol Rev 12(4), 564–82.
Fernandes de Oliveira AM, Pinheiro LS, Souto Pereira CK, Neves Matias W, Albuquerque Gomes R, Souza Chaves O et al. (2012) Total Phenolic Content and Antioxidant Activity of Some Malvaceae Family Species.
Antioxidants 1(1), 33–43.
Huang Z, Wang B, Eaves DH, Shikany JM, and Pace RD (2007) Phenolic Compound Profile of Selected Vegetables Frequently Consumed by African Americans in the Southeast United States. Food Chem 103(4), 1395–402.
Jeon JH, Kwon SC, Park DS, Shin SS, Jeong JH, Park SY et al. (2009) Anti- Allergic Effects of White Rose Petal Extract and Anti-Atopic Properties Table 5 Predicted values and experimental values of response variables in optimal conditions of white rose petals extract
Responses Independent variables Optimal conditions Predicted values Experimental values Y1
(%)
EtOH conc (%) 42.02
42.92
Extraction temperature (oC) 75.00 40.17
Extraction time (min) 60.72
Y2
(mg GAE/g dry mass)
EtOH conc (%) 42.02
243.54
Extraction temperature (oC) 75.00 246.30
Extraction time (min) 80.89
Y3
(mg CE /g dry mass)
EtOH conc (%) 41.03
19.93
Extraction temperature (oC) 75.00 23.69
Extraction time (min) 119.00
Y4
(%)
EtOH conc (%) 41.03
85.74
Extraction temperature (oC) 75.00 82.37
Extraction time (min) 89.41
of Its Hexane Fraction. Arch Pharm Res 32(6), 823–30.
Juntachote T, Berghofer E, Bauer F, and Siebenhandl S (2006) The application of response surface methodology to the production of phenolic extracts of lemon grass, galangal, holy basil and rosemary.
International Journal of Food Science and Technology 41, 121–33.
Kähkönen MP, Hopia AI, Vuorela HJ, Rauha JP, Pihlaja K, Kujala TS et al.
(1999) Antioxidant Activity of Plant Extracts Containing Phenolic Compounds. J Agric Food Chem 47(10), 3954–62.
Kim DI and Hong JH (2012) Optimization of ethanol extraction conditions for functional components from Lespedeza cuneata using response surface methodology. Korean J Food Cookery Sci 28(3), 275–83.
Koh YJ, Cha DS, Choi HD, Park YK, and Choi IW (2008) Hot Water Extraction Optimization of Dandelion Leaves to Increase Antioxidant Activity. Korean J Food Sci Biotechnol 40(3), 283–9.
Kris-Etherton PM, Kari DH, Andrea B, Stacie MC, Amy EB, Kirsten FH et al. (2002) Bioactive Compounds in Foods: Their Role in the Prevention of Cardiovascular Disease and Cancer. Am J Med 113(9, Supplement 2), 71–88.
Kwon EK, Kim YE, Lee CH, and Kim HY (2006) Screening of Nine Herbs with Biological Activities on ACE Inhibition, HMG-CoA Reductase Inhibition, and Fibrinolysis. Korean J Food Sci Biotechnol 38, 691–8.
López-Amorós ML, Hernández T, and Estrella I (2006) Effect of Germination on Legume Phenolic Compounds and Their Antioxidant Activity. After Processing: The Fate of Food Components 19(4), 277–83.
Min DL, Lim SW, Ahn JB, and Choi YJ (2010) Optimization of Ethanol Extraction Conditions for Antioxidants from Zizyphus Jujuba Mill.
Leaves Using Response Surface Methodology. Korean J Food Sci Biotechnol 42(6), 733–8.
Padayatty SJ, Katz A, Wang Y, Eck P, Kwon O, Lee JH et al. (2003) Vitamin C as an Antioxidant: Evaluation of Its Role in Disease Prevention. J Am Coll Nutr 22(1), 18–35.
Rao CV, Rivenson A, Simi B, and Reddy BS (1995) Chemoprevention of Colon Carcinogenesis by Dietary Curcumin, a Naturally Occurring Plant Phenolic Compound. Cancer Res 55(2), 259–66.
Rauha JP, Remes S, Heinonen M, Hoipa A, Kähkönen M, Kujala T et al.
(2000) Antimicrobial Effects of Finnish Plant Extracts Containing
Flavonoids and Other Phenolic Compounds. Int J Food Microbiol 56(1), 3–12.
Rezaie-Tavirani M, Fayazfar S, Heydari-Keshel S, Rezaee MB, Zamanian- Azodi M, Rezaei-Tavirani M et al. (2013) Effect of Essential Oil of Rosa Damascena on Human Colon Cancer Cell Line SW742. Gastroenterol Hepatol Bed Bench 6(1), 25–31.
Rice-Evans CA, Miller NJ, and Paganga G (1996) Structure-Antioxidant Activity Relationships of Flavonoids and Phenolic Acids. Free Radic Biol Med 20(7), 933–56.
Shafei MN, Rakhshandah H, and Boskabady MH (2010) Antitussive Effect of Rosa Damascena in Guinea Pigs. Iran J Pharm Res, 231–4.
Stephens NG, Parsons A, Brown MJ, Schofield PM, Kelly F, Cheeseman K et al. (1996) Randomised Controlled Trial of Vitamin E in Patients with Coronary Disease: Cambridge Heart Antioxidant Study (CHAOS).
Lancet 347(9004), 781–6.
Suganya Devi P, Saravanakumar M, and Mohandas S (2012) The effects of temperature and pH on stability of anthocyanins from red sorghum (Sorghum bicolor) bran. African Journal of Food Science 6(24), 567–73.
Talib WH and Mahasneh AM (2010) Antimicrobial, Cytotoxicity and Phytochemical Screening of Jordanian Plants Used in Traditional Medicine. Molecules 15(3), 1811–24.
Ulusoy S, Boţgelmez-Týnaz G, and Seçilmiş-Canbay H (2009) Tocopherol, Carotene, Phenolic Contents and Antibacterial Properties of Rose Essential Oil, Hydrosol and Absolute. Curr Microbio 59(5), 554–8.
VanderJagt TJ, Ghattas R, VanderJagt DJ, Crossey M, and Glew RH (2002) Comparison of the Total Antioxidant Content of 30 Widely Used Medicinal Plants of New Mexico. Life Sci 70(9), 1035–40.
Vinokur Y, Rodov V, Reznick N, Goldman G, Horev B, Umiel N et al. (2006) Rose Petal Tea as an Antioxidantrich Beverage: Cultivar Effects. J Food Sci Educ 71(1), 42–7.
Zheng W and Wang SY (2001) Antioxidant Activity and Phenolic Compounds in Selected Herbs. J Agric Food Chem 49(11), 5165–70.
Zhishen J, Mengcheng T, and Jianming W (1999) The Determination of Flavonoid Contents in Mulberry and Their Scavenging Effects on Superoxide Radicals. Food Chem 64(4), 555–9.