INTRODUCTION
In the modern management of cancer, apart from treating the disease, psychological and social aspects of the patients
should be taken into account in order to achieve the highest quality of life (QoL). Being subjective and multidimensional, QoL is defined as “the extent to which one’s usual or expected physical, emotional and social well-being as affected by a medical condition or its treatment” [1]. There are several dimensions ranging from physical concerns to cognitive functioning [2]. Questionnaires have been widely used and accepted as the standard tool because the results can be compared among studies.
Functional Assessment of Cancer Therapy-General (FACT-G)
Quality of life in gynecologic cancer survivors compared to healthy check-up women
Sarikapan Wilailak1, Arb-aroon Lertkhachonsuk1, Nawaporn Lohacharoenvanich2, Suteera Chukkul Luengsukcharoen2, Manmana Jirajaras2, Puchong Likitanasombat1, Suwannee Sirilerttrakul2
Departments of 1Obstetrics and Gynecology, 2Nursing, Ramathibodi Hospital, Mahidol University Faculty of Medicine, Bangkok, Thailand
Received Aug. 19, 2010, Revised Jan. 24, 2011, Accepted Feb. 28, 2011 Correspondence to Sarikapan Wilailak
Department of Obstetrics and Gynaecology, Faculty of Medicine, Ramathi
bodi Hospital, Rama VI Road, Bangkok 10400, Thailand. Tel: 6622011451, Fax: 6622011416, Email: [email protected]
Objective: The primary objective of this study was to compare quality of life of disease-free patients after therapy for gynecologic malignancies at follow-up in comparison with healthy check-up patients. Our second objective was to assess correlation between demographic data, disease and treatment factors and quality of life scores.
Methods: Patients completed the Functional Assessment of Cancer Therapy-General (FACT-G) quality of life questionnaire at least 6 months after treatment for a gynecologic malignancy. Responses were compared to unmatched healthy women who were seen for standard gynecologic screening examinations. Statistical calculation was done using chi-squared tests, Wilcoxon rank-sum, and Kruskal-Wallis one-way analysis and Spearman rank correlations. Factors associated with FACT-G scores were evaluated using univariate and multivariate analyses.
Results: Eight hundred and seventy patients were recruited. The median time since therapy was 61 months (range, 6 to 173 months). The overall FACT-G scores were higher in the patient group than in the healthy group (p<0.05). The scores of each subscale measuring physical, functional, social/family and emotional well-being were also higher in the patient group (p<0.05).
Multivariate analysis revealed correlation between Eastern Cooperative Oncology Group performance status, educational level, care giver, presence of economic problems and FACT-G scores.
Conclusion: The quality of life scores were higher in gynecologic cancer patients after treatment. And the factors that associated with the higher score in the patient group are having husband as a caregiver, no financial problem, Eastern Cooperative Oncology Group score 0 or 1 and having high school or higher education.
Keywords: Quality of life, Functional Assessment of Cancer Therapy-General, Gynecologic cancer
is a QoL questionnaire developed by Cella et al. [3] from Northwestern University. The fourth version of FACT-G includes a 27-item core questionnaire that evaluates 4 aspects of the patients’ well-being i.e., physical, social/family, emotional, and functional status. This questionnaire has been accepted worldwide. It was translated into the Thai version by Ratanatharathorn et al. [4] and was tested and proven to be reliable and valid.
While there have been many studies on QoL among cancer patients during treatment [5], few have addressed QoL after treatment, especially in the out-patient settings.
The importance of QoL is one of the patient measurement outcomes of patients under the diversity of treatment options. In the recovery period after intense treatment, the impact on QoL may be prolonged. The information from these recovering gynecologic cancer patients is interesting especially in comparison to healthy women.
Thus the first objective of this study was to compare quality of life of disease-free patients after therapy for gynecologic malignancies at follow-up in comparison with healthy check- up women. Our second objective was to assess correlation between demographic data, disease and treatment factors and QoL scores.
MATERIALS AND METHODS
1. Participant selection and eligibility
Using a cross-sectional design, this study investigated two groups of participants: the study and the control groups. The study group consisted of gynecologic malignancy patients who came for follow-up at the Gynecologic Oncology Clinic, Department of Obstetrics and Gynecology, Faculty of Medicine Ramathibodi Hospital, Mahidol University, Bangkok, Thailand. Eligibility criteria included more than 6 months from completion of treatment for a gynecologic malignancy, no recurrence of disease, full consciousness, ability to understand and communicate in Thai, and consent to participate in the study. Patients with psychiatric disorders, communication disorders, severe medical condition or coexisting malignancies were excluded.
The control group consisted of healthy women who were seen for standard gynecologic screening exams at General Gynecology Clinic and who had ability to understand and communicate in Thai, and consent to participate in the study.
The study protocol was approved by the institutional Ethics Committee (July, 2004) and written informed consents were obtained from all patients.
2. Quality of life measures
After having been recruited according to the inclusion and exclusion criteria, the patients were given information sheets explaining backgrounds, objectives, benefits and confidentiality of the study and, thereafter, the patients gave their consents. Each participant were asked to complete two sets of questionnaires, one was a general personal questionnaire inquiring about their marital status, educational level, occupations, care givers, methods of payment for therapy, financial status and other coexisting medical conditions, the other was the fourth version of Functional Assessment of Cancer Therapy-General (FACT-G) QoL questionnaire. The FACT-G includes four subscales measuring physical (PWB), social/family (SFWB), emotional (EWB), and functional well-being (FWB). Each subscale had its own score and all contributed to the overall FACT-G score. The higher scores mean better QoL. Participants were asked to rate how they felt on that day and the past 7 days.
The answered questionnaires were then reviewed and verified with the participants. Unanswered questions were repeated verbally, and in case the participants were unwilling to answer those questions, the investigators would probe for their reasons.
Data regarding type of malignancy, stage of disease, mode of treatment, treatment duration and interval, performance status, hormonal therapy and recurrence status were extracted from the medical records by the investigators.
3. Statistical analysis
Statistical analyses were performed using SPSS ver. 11.5 (SPSS Inc., Chicago, IL, USA). In univariate analysis, chi-squared tests, Wilcoxon rank-sum, and Kruskal-Wallis one-way analysis were used to compare between categorical and continuous data. Spearman rank correlations were used for multivariate analysis, p<0.05 were taken as significant.
RESULTS
Between January, 2005-December, 2008, eight hundred and seventy gynecological cancer patients completed the questionnaire. Ten patients were unwilling to answer the questionnaire. From 440 unmatched healthy women, 399 completed the questionnaire. According to the participants, the reasons for not having answered were a lack of time and inconvenience.
With regard to the patient characteristics (Table 1), gyne co- lo gic cancer patients were divided into those with cervical can cer (n=571, 65.6%), ovarian cancer (n=149, 17.1%), endo-
metrial cancer (n=108, 12.4%), uterine sarcoma (n=15, 1.7%), gestational trophoblastic neoplasia (n=22, 2.5%), vulvar cancer (n=3, 0.3%) and vaginal cancer (n=2, 0.2%). Prior modalities of treatment included surgery alone (28.7%), radiation alone (34.4%), chemotherapy alone (1.4%) and combination therapy
(35.5%). Most patients had treatment time of less than 2 mon- ths (66.9%). Time since completion of treatment was more than 60 months in 50.2% of patients, with median time of 61 months (range, 6 to 173 months). The characteristics of Table 1. Characteristics of patients and control group
Cancer patients (n=870)
Healthy women
(n=399) p-value*
Cancer site
Cervical cancer 571 (65.6) -
Ovarian cancer 149 (17.1) -
Endometrial cancer 108 (12.4) -
Uterine sarcoma 15 (1.7) -
Gestational trophoblastic
neoplasia 22 (2.5) -
Vulva cancer 3 (0.3) -
Vaginal cancer 2 (0.2) -
Median age (yr) 53.4 42.7 <0.001
Marital status <0.001
Single 103 (11.8) 46 (11.6)
Married 523 (60.1) 308 (77.3)
Divorced/separated 254 (28.1) 45 (11.1)
Education <0.001
<High school 524 (60.2) 154 (38.6)
High school 219 (25.2) 127 (31.8)
College 127 (14.6) 118 (29.6)
Employment <0.001
Employed 567 (65.2) 342 (85.7)
Housewife (unemployed) 303 (34.8) 57 (14.3)
Living 0.042
Live with family/friend 804 (92.4) 354 (88.7)
Live alone 66 (7.6) 45 (11.3)
Principal caregivers <0.001
Husband 296 (34.0) 253 (63.3)
Relatives 475 (54.6) 87 (21.8)
None 99 (11.4) 59 (14.6)
Financial 0.844
Financial difficulties 311 (35.7) 140 (35.1) No financial difficulties 559 (64.3) 259 (64.9)
ECOG performance status <0.001
0 219 (25.2) 221 (55.4)
1 655 (52.3) 153 (38.3)
2 196 (22.5) 25 (6.3)
Values are presented as number (%).
ECOG, Eastern Cooperative Oncology Group.
*Chi-square test.
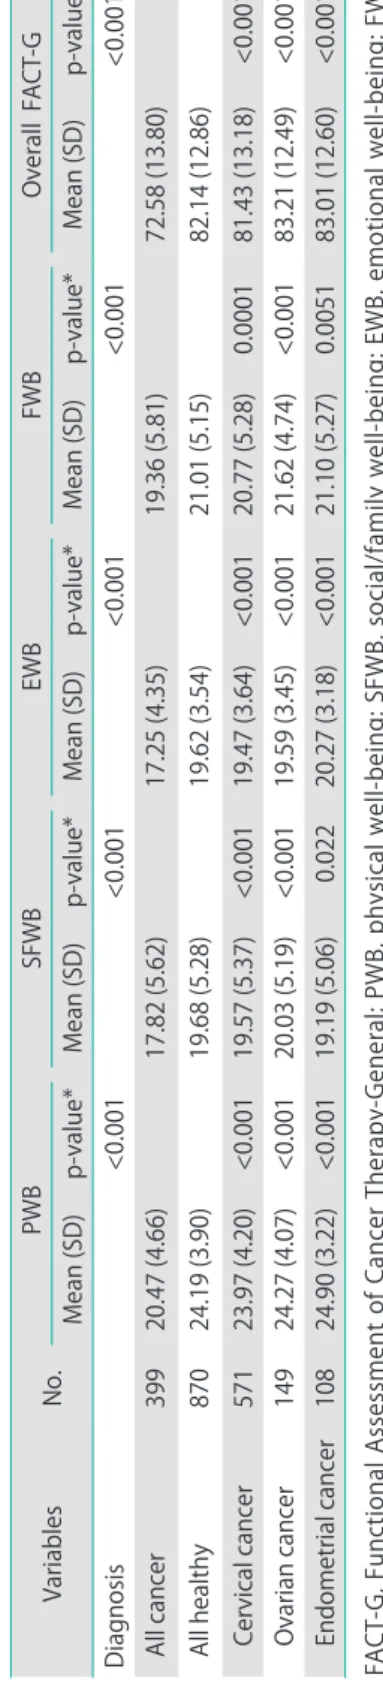
Table 2. FACT-G scores between cancer patients, it’s subtypes and controls (healthy women) VariablesNo.PWBSFWBEWBFWBOverall FACT-G Mean (SD)p-value*Mean (SD)p-value*Mean (SD)p-value*Mean (SD)p-value*Mean (SD)p-value* Diagnosis<0.001<0.001<0.001<0.001<0.001 All cancer39920.47 (4.66)17.82 (5.62)17.25 (4.35)19.36 (5.81)72.58 (13.80) All healthy87024.19 (3.90)19.68 (5.28)19.62 (3.54)21.01 (5.15)82.14 (12.86) Cervical cancer57123.97 (4.20)<0.00119.57 (5.37)<0.00119.47 (3.64)<0.00120.77 (5.28)0.000181.43 (13.18) <0.001 Ovarian cancer14924.27 (4.07)<0.00120.03 (5.19)<0.00119.59 (3.45)<0.00121.62 (4.74)<0.00183.21 (12.49) <0.001 Endometrial cancer10824.90 (3.22)<0.00119.19 (5.06) 0.02220.27 (3.18)<0.00121.10 (5.27)0.005183.01 (12.60) <0.001 FACT-G, Functional Assessment of Cancer Therapy-General; PWB, physical well-being; SFWB, social/family well-being; EWB, emotional well-being; FWB, functional well-being. *Wilcoxon rank-sum test.
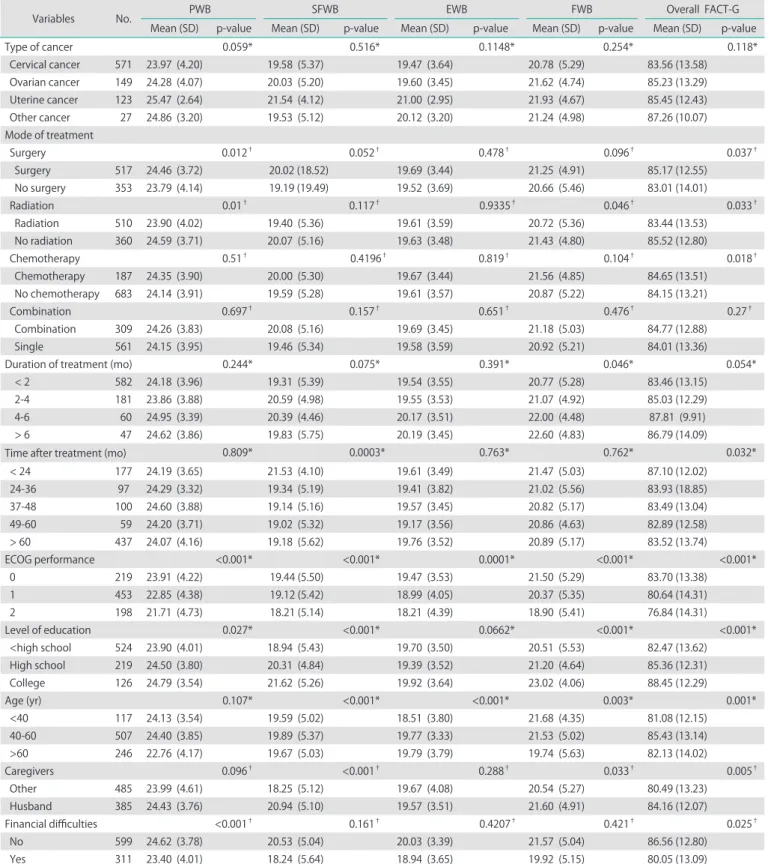
Table 3. Functional Assessment of Cancer Therapy-General (FACT-G) scores in gynecologic cancer patients
Variables No. PWB SFWB EWB FWB Overall FACT-G
Mean (SD) p-value Mean (SD) p-value Mean (SD) p-value Mean (SD) p-value Mean (SD) p-value
Type of cancer 0.059* 0.516* 0.1148* 0.254* 0.118*
Cervical cancer 571 23.97 (4.20) 19.58 (5.37) 19.47 (3.64) 20.78 (5.29) 83.56 (13.58)
Ovarian cancer 149 24.28 (4.07) 20.03 (5.20) 19.60 (3.45) 21.62 (4.74) 85.23 (13.29)
Uterine cancer 123 25.47 (2.64) 21.54 (4.12) 21.00 (2.95) 21.93 (4.67) 85.45 (12.43)
Other cancer 27 24.86 (3.20) 19.53 (5.12) 20.12 (3.20) 21.24 (4.98) 87.26 (10.07)
Mode of treatment
Surgery 0.012† 0.052† 0.478† 0.096† 0.037†
Surgery 517 24.46 (3.72) 20.02 (18.52) 19.69 (3.44) 21.25 (4.91) 85.17 (12.55)
No surgery 353 23.79 (4.14) 19.19 (19.49) 19.52 (3.69) 20.66 (5.46) 83.01 (14.01)
Radiation 0.01† 0.117† 0.9335† 0.046† 0.033†
Radiation 510 23.90 (4.02) 19.40 (5.36) 19.61 (3.59) 20.72 (5.36) 83.44 (13.53)
No radiation 360 24.59 (3.71) 20.07 (5.16) 19.63 (3.48) 21.43 (4.80) 85.52 (12.80)
Chemotherapy 0.51† 0.4196† 0.819† 0.104† 0.018†
Chemotherapy 187 24.35 (3.90) 20.00 (5.30) 19.67 (3.44) 21.56 (4.85) 84.65 (13.51)
No chemotherapy 683 24.14 (3.91) 19.59 (5.28) 19.61 (3.57) 20.87 (5.22) 84.15 (13.21)
Combination 0.697† 0.157† 0.651† 0.476† 0.27†
Combination 309 24.26 (3.83) 20.08 (5.16) 19.69 (3.45) 21.18 (5.03) 84.77 (12.88)
Single 561 24.15 (3.95) 19.46 (5.34) 19.58 (3.59) 20.92 (5.21) 84.01 (13.36)
Duration of treatment (mo) 0.244* 0.075* 0.391* 0.046* 0.054*
< 2 582 24.18 (3.96) 19.31 (5.39) 19.54 (3.55) 20.77 (5.28) 83.46 (13.15)
2-4 181 23.86 (3.88) 20.59 (4.98) 19.55 (3.53) 21.07 (4.92) 85.03 (12.29)
4-6 60 24.95 (3.39) 20.39 (4.46) 20.17 (3.51) 22.00 (4.48) 87.81 (9.91)
> 6 47 24.62 (3.86) 19.83 (5.75) 20.19 (3.45) 22.60 (4.83) 86.79 (14.09)
Time after treatment (mo) 0.809* 0.0003* 0.763* 0.762* 0.032*
< 24 177 24.19 (3.65) 21.53 (4.10) 19.61 (3.49) 21.47 (5.03) 87.10 (12.02)
24-36 97 24.29 (3.32) 19.34 (5.19) 19.41 (3.82) 21.02 (5.56) 83.93 (18.85)
37-48 100 24.60 (3.88) 19.14 (5.16) 19.57 (3.45) 20.82 (5.17) 83.49 (13.04)
49-60 59 24.20 (3.71) 19.02 (5.32) 19.17 (3.56) 20.86 (4.63) 82.89 (12.58)
> 60 437 24.07 (4.16) 19.18 (5.62) 19.76 (3.52) 20.89 (5.17) 83.52 (13.74)
ECOG performance <0.001* <0.001* 0.0001* <0.001* <0.001*
0 219 23.91 (4.22) 19.44 (5.50) 19.47 (3.53) 21.50 (5.29) 83.70 (13.38)
1 453 22.85 (4.38) 19.12 (5.42) 18.99 (4.05) 20.37 (5.35) 80.64 (14.31)
2 198 21.71 (4.73) 18.21 (5.14) 18.21 (4.39) 18.90 (5.41) 76.84 (14.31)
Level of education 0.027* <0.001* 0.0662* <0.001* <0.001*
<high school 524 23.90 (4.01) 18.94 (5.43) 19.70 (3.50) 20.51 (5.53) 82.47 (13.62)
High school 219 24.50 (3.80) 20.31 (4.84) 19.39 (3.52) 21.20 (4.64) 85.36 (12.31)
College 126 24.79 (3.54) 21.62 (5.26) 19.92 (3.64) 23.02 (4.06) 88.45 (12.29)
Age (yr) 0.107* <0.001* <0.001* 0.003* 0.001*
<40 117 24.13 (3.54) 19.59 (5.02) 18.51 (3.80) 21.68 (4.35) 81.08 (12.15)
40-60 507 24.40 (3.85) 19.89 (5.37) 19.77 (3.33) 21.53 (5.02) 85.43 (13.14)
>60 246 22.76 (4.17) 19.67 (5.03) 19.79 (3.79) 19.74 (5.63) 82.13 (14.02)
Caregivers 0.096† <0.001† 0.288† 0.033† 0.005†
Other 485 23.99 (4.61) 18.25 (5.12) 19.67 (4.08) 20.54 (5.27) 80.49 (13.23)
Husband 385 24.43 (3.76) 20.94 (5.10) 19.57 (3.51) 21.60 (4.91) 84.16 (12.07)
Financial difficulties <0.001† 0.161† 0.4207† 0.421† 0.025†
No 599 24.62 (3.78) 20.53 (5.04) 20.03 (3.39) 21.57 (5.04) 86.56 (12.80)
Yes 311 23.40 (4.01) 18.24 (5.64) 18.94 (3.65) 19.92 (5.15) 80.05 (13.09)
PWB, physical well-being; SFWB, social/family well-being; EWB, emotional well-being; FWB, functional well-being; SD, stand deviation; Other cancers, gestational/
fophoblastic neoplasia, ualua cancer, uaginal cancer.
*Kruskal-Wallis one-way analysis. †Wilcoxon rank-sum test.
both cases and controls are also summarized in Table 1. The median age of the cancer patients was 53.42 years (range, 17 to 82 years), while the median age was 42.71 years (range, 20 to 69 years) in the healthy group. The majority of both groups were married, with higher proportion of divorce or se paration in the cancer group (28.1% vs. 11.1%). Regarding the level of education, 52.3% patients in the cancer group fi ni shed primary school and 14.6% finished college, while 35.8% and 29.6% of the healthy group finished primary school and college, respectively. Of patients in cancer group, 34.8% were unemployed (housewives) compared to 14.3% in healthy group. Most of the participants stayed with their fa- milies, and husbands and relatives were principal caregivers.
However, the proportion of husbands as principal caregivers was different in the two groups (34.0% for cancer patient vs.
63.3%). There were no significant differences between self- per ceptions of financial difficulties between the two groups (in Thailand, the government provides support for basic health pro blems, including cancer). The majority of cancer patients had Eastern Cooperative Oncology Group (ECOG) score performance status of 1 (52.3%) while the ma jority of healthy women had ECOG score of 0 (55.4%).
In Table 2, the mean overall FACT-G score in the gynecologic cancer patient group was 82.15 (standard deviation [SD]=12.86), which was significantly higher than the healthy group (72.58, SD=13.80, p<0.05). The scores of each subscale measuring physical, functional, social/family and emotional well-being were also higher in the gynecologic cancer patient group than in the healthy group (p<0.05). The data of FACT-G scores in gynecologic cancer patients are demonstrated in Table 3. In the group of gynecologic cancer patients, factors that correlated with QoL scores in univariate analysis were mode of treatment, time after completion of treatment, ECOG performance status score, level of education, age, caregivers at home, and financial problem as presented in Table 2. The type of cancer, combination or single modality of the treatment and duration of treatment did not appear to be correlated with long-term QoL.
All factors that had p<0.2 in univariate analysis were included in multivariate analysis. Factors found to have correlation with QoL scores in multivariate analysis were ECOG performance status, level of education, caregiver and presence/absence of economic problem as shown in Table 4.
DISCUSSION
Although the cancer patients reported higher age, divorced/
separated status and unemployment with lower educational
level and performance status compared to the healthy group (Table 1), the mean overall FACT-G score in the gynecologic cancer patient group was significantly higher than that of the healthy group (82.15, SD=12.86 vs. 72.58, SD=13.80, p<0.001) Table 4. Results of multivariate logistic regression analysis for overall FACT-G scores
Variable No.
Standardized correlation coefficient
p-value*
Correlation coefficient
95% CI of correlation coefficient Caregiver
Husband 485 2.8 1.15–4.46 0.001
Others 385
Financial problem
No 559 4.86 3.14–6.58 <0.001
Yes 311
ECOG score
0 219 9.52 7.15–11.88 <0.001
1 453 4.59 2.54 –6.63 <0.001
2 198
Education
College 126 2.92 1.59–6.32 0.34
High school 219 0.96 -1.02–2.95 0.02
<High school 524 Chemotherapy
Yes 187 -2.5 -5.25–0.24 0.074
No 683
Radiation
Yes 510 -0.84 -3.23–1.54 0.488
No 360
Surgery
Yes 517 -0.14 -2.46–2.18 0.907
No 535
Time after treatment (mo)
<24 177 1.55 -0.58–3.69 0.154
24–36 97 1.45 -1.22–4.13 0.287
37–48 100 1.09 -0.15–3.71 0.411
49–60 59 -0.39 -3.67–2.87 0.811
>60 437
Age (yr)
<40 507 1.26 -1.22–3.74 0.317
40–60 117 -0.83 -3.73–2.05 0.569
>60 246
FACT-G, Functional Assessment of Cancer Therapy-General; CI, confidence interval; ECOG, Eastern Cooperative Oncology Group.
*Spearman rank correlations.
(Table 2). The scores of each subscale measuring emotional, functional, social/family and physical well-being were also higher in the patient group than in the healthy group as shown in Table 2. This finding indicated that recovery from treatment for gynecological cancer has a positive effect upon QoL. Previous QoL studies compared cancer patients’
score and healthy participants were reviewed and shown in Table 5. Our study result corresponded well with them. The researcher agreed with Miller and Lutgendorf that patients with QoL impairment might have been able to adapt to their life circumstances by modifying their internal standards, values and their own conceptualization of QoL over time, a phenomenon called “response shift” [6,8,11]. Treatment modalities appeared to have some effect on quality of life.
Patients who underwent radiation therapy had lower FACT-G scores after treatment, while patients who underwent surgery had higher FACT-G scores, especially in the physical subscores. Recovery after surgery was more rapid while the effect of radiation persisted; thus, this might explain their effect on the patients’ QoL. However, the results from other studies also varied [6-8,12-14]. And in our study, the mode of treatment did not correlate with QoL on multivariate analysis.
The effect of treatment might explain why cervical cancer patients, who were treated mostly by radiation therapy alone, reported slightly lower QoL than patients with other types of gynecologic cancer in this study. However, the results were insignificant on univariate and multivariate analysis. The result was similar to other studies which reported that the site of disease had marginal impact on QoL during active treatment and no impact after completion of treatment [7,12].
Performance status significantly correlated with total FACT-G scores in both univariate and multivariate analyses. Poorer performance status correlated with lower scores in all aspects of well-being. The result was similar to the findings from Greimel et al. in which performance statuses were identified as significant predictors for QoL one year after treatment [13]. Patients in the 40-60 year old age group scored higher FACT-G scores than younger or older age groups. However,
age did not correlate with QoL on multivariate analysis. Miller et al. [6] and Lai et al. [15] reported similar findings in the US and Hong Kong [6], while Chan et al. [7] found that age was one of the factors identified as having significant effect on long term QoL after treatment in Hong Kong. They found that younger patients had poorer QoL which might have resulted from unexpectedness of impaired fertility and femininity, treatment-related menopause and relationship issues.
Higher levels of education were also significantly related to higher QoL. The differences were evident in the functional and social well-being subscores. This was confirmed by multivariate analysis. Miller et al. [6] found that the most significant difference in QoL was seen among US patients who had not completed high school. Lower levels of education were associated with less supportive social environment, limited knowledge regarding health issues and poor health [16].
Economic problems and financial difficulties also significantly affected QoL from both univariate and multivariate analysis.
Cella et al. [17] reported that patients with the poorest income and lowest educational level generally had lower performance status and significant survival disadvantage.
Univariate and multivariate analysis stressed the importance of having husbands as principal caregivers. Lai et al also found that older patients with cervical cancer who had a partner and possessed religious belief were positively correlated with QoL [15]. In Sudan, marital status, occupation, education of the patient and also education of caregivers were associated with higher QoL scores [10]. In Finland, high levels of partner support were associated with female cancer patients’
optimistic appraisals and both were predictors of better health-related QoL at 8 months follow-up [18].
In conclusion, the QoL scores were higher in gynecologic cancer patients after treatment. And the factors that associated with the higher score in the patient group are having the husband as a caregiver, no financial problem, ECOG score 0 or 1 and having high school or higher education. The researcher, therefore, might propose that Table 5. Previous QoL studies compared cancer patients’ score and healthy participants
Authors Questionnaire Interval after treatment Difference in QoL score between patients, and healthy participants
Miller et al. [6] FACT-G 6 mo No
Chan et al. [7] EORTC-QLQ Longitudinal Yes (patients > healthy)
Lutgendorf et al. [8] FACT-G 1 yr Yes (patients > healthy)
Tahmasebi et al. [9] EORTC-QLQ 3 mo Yes (patients > healthy) except physical well-being Awadalla et al. [10] WHO QoL-bref 1 yr Yes (patients > healthy)
QoL, quality of life; FACT-G, Functional Assessment of Cancer Therapy-General; EORTC-QLQ, European Organisation for Research and Treatment of Cancer; QLQ, quality of life questionnaire; WHO, World Health Organization.
patients who experienced bad situations from cancer and treatment before recovery might be more optimistic about their present situation. ECOG performance status, level of education, caregivers and economic problems were found to correlate with QoL score. Hence, enhancing the above factors could be beneficial in improving QoL in gynecologic cancer patients. The weakness of this study is that this is a cross- sectional study of which the range of the time after treatment is quite wide. Longitudinal study of QoL would add more complete information.
CONFLICT OF INTEREST
No potential conflict of interest relevant to this article was reported.
REFERENCES
1. Cella DF. Measuring quality of life in palliative care. Semin Oncol 1995;22(2 Suppl 3):73-81.
2. Kornblith A, Holland JC, editors. Handbook of measures for psychological, social and physical function in cancer.
Vol. 1. Quality of life. New York: Memorial Sloan-Kettering Cancer Center; 1994.
3. Cella DF, Tulsky DS, Gray G, Sarafian B, Linn E, Bonomi A, et al. The Functional Assessment of Cancer Therapy scale:
development and validation of the general measure. J Clin Oncol 1993;11:570-9.
4. Ratanatharathorn V, Sirilerttrakul S, Jirajarus M, Silpakit C, Maneechavakajorn J, Sailamai P, et al. Quality of life, functional assessment of cancer therapy-general. J Med Assoc Thai 2001;84:1430-42.
5. Cheson BD, McCabe MS, Phillips PH. Clinical trials. Referral resource. Clinical trials assessing quality of life. Oncology (Williston Park) 1995;9:1171-4, 1176, 1178.
6. Miller BE, Pittman B, Case D, McQuellon RP. Quality of life after treatment for gynecologic malignancies: a pilot study in an outpatient clinic. Gynecol Oncol 2002;87:178- 84.
7. Chan YM, Ngan HY, Li BY, Yip AM, Ng TY, Lee PW, et al.
A longitudinal study on quality of life after gynecologic cancer treatment. Gynecol Oncol 2001;83:10-9.
8. Lutgendorf SK, Anderson B, Ullrich P, Johnsen EL, Buller RE, Sood AK, et al. Quality of life and mood in women with gynecologic cancer: a one year prospective study.
Cancer 2002;94:131-40.
9. Tahmasebi M, Yarandi F, Eftekhar Z, Montazeri A, Namazi H.
Quality of life in gynecologic cancer patients. Asian Pac J Cancer Prev 2007;8:591-2.
10. Awadalla AW, Ohaeri JU, Gholoum A, Khalid AO, Hamad HM, Jacob A. Factors associated with quality of life of outpatients with breast cancer and gynecologic cancers and their family caregivers: a controlled study. BMC Cancer 2007;7:102.
11. Carver CS, Scheier MF. Scaling back goals and recalibration of the affect system are processes in normal adaptive self- regulation: understanding ‘response shift’ phenomena.
Soc Sci Med 2000;50:1715-22.
12. Greimel E, Thiel I, Peintinger F, Cegnar I, Pongratz E.
Prospective assessment of quality of life of female cancer patients. Gynecol Oncol 2002;85:140-7.
13. von Gruenigen VE, Frasure HE, Jenison EL, Hopkins MP, Gil KM. Longitudinal assessment of quality of life and lifestyle in newly diagnosed ovarian cancer patients: the roles of surgery and chemotherapy. Gynecol Oncol 2006;103:120- 6.
14. Erekson EA, Sung VW, DiSilvestro PA, Myers DL. Urinary symptoms and impact on quality of life in women after treatment for endometrial cancer. Int Urogynecol J Pelvic Floor Dysfunct 2009;20:159-63.
15. Lai BP, Tang CS, Chung TK. Age-specific correlates of quality of life in Chinese women with cervical cancer.
Support Care Cancer 2009;17:271-8.
16. Wu AW. Quality-of-life assessment in clinical research:
application in diverse populations. Med Care 2000;38(9 Suppl):II130-5.
17. Cella DF, Orav EJ, Kornblith AB, Holland JC, Silberfarb PM, Lee KW, et al. Socioeconomic status and cancer survival. J Clin Oncol 1991;9:1500-9.
18. Gustavsson-Lilius M, Julkunen J, Hietanen P. Quality of life in cancer patients: the role of optimism, hopelessness, and partner support. Qual Life Res 2007;16:75-87.