Properties of experimental copper-aluminium-
nickel alloys for dental post-and-core applications
Apiwat Rittapai1, Somchai Urapepon2*, Julathep Kajornchaiyakul3, Choltacha Harniratisai4
1Dental Biomaterials Program, 2Department of Prosthodontics, 4Department of Operative Dentistry and Endodontics, Faculty of Dentistry, Mahidol University, Yothi Road, Rajthevee, Bangkok, Thailand
3National Metal and Materials Technology Center (MTEC), Phahonyothin Road, Khlong Luang, Pathum Thani, Thailand
PURPOSE. This study aimed to develop a copper-aluminium-nickel alloy which has properties comparable to that of dental alloys used for dental post and core applications with the reasonable cost. MATERIALS AND METHODS. Sixteen groups of experimental copper alloys with variants of 3, 6, 9, 12 wt% Al and 0, 2, 4, 6 wt%
Ni were prepared and casted. Their properties were tested and evaluated. The data of thermal, physical, and mechanical properties were analyzed using the two-way ANOVA and Tukey’s test (α=0.05). The alloy toxicity was evaluated according to the ISO standard. RESULTS. The solidus and liquidus points of experimental alloys ranged from 1023°C to 1113°C and increased as the nickel content increased. The highest ultimate tensile strength (595.9 ± 14.2 MPa) was shown in the Cu-12Al-4Ni alloy. The tensile strength was increased as the both elements increased. Alloys with 3-6 wt% Al exhibited a small amount of 0.2% proof strength. Accordingly, the Cu-9Al-2Ni and Cu-9Al-4Ni alloys not only demonstrated an appropriate modulus of elasticity (113.9 ± 8.0 and 122.8 ± 11.3 GPa, respectively), but also had a value of 0.2% proof strength (190.8 ± 4.8 and 198.2 ± 3.4 MPa, respectively), which complied with the ISO standard requirement (>180 MPa). Alloys with the highest contents of nickel (6 wt%
Ni) revealed a widespread decolourisation zone (5.0-5.9 mm), which correspondingly produced the largest cell response, equating positive control. CONCLUSION. The copper alloys fused with 9 wt% Al and 2-4 wt% Ni can be considered for a potential use as dental post and core applications. [J Adv Prosthodont 2014;6:215-23]
KEY WORDS: Cu-Al-Ni alloy; Copper alloy; Dental alloy; Post and core
INTRODUCTION
Dental post and core are usually fabricated from a cast alloy as a single unit from a lost-wax technique. The posts, origi- nally designed to retain an artificial crown, have been shown as a system which provides fracture resistance to the roots.1 They reproduce the contours of the prepared root
canal and adapt well to the canal morphology, especially when the root canal is irregularly shaped. An ideal post and core material should allow any failure to occur in the bulk material before damage occurs to the tooth structure when it is subjected to chewing forces.2 It has been reported in some studies that when a system with components having different rigidity is loaded, then the more rigid component is capable of resisting greater forces without distortion.3,4 Insufficient stiffness of a post permits micro-movement of the core and thus, during function, distortion of the resto- ration at the margins occurs. However, the post must not be too stiff, in that it cannot deform compatibly with the root structure under functional loads. It has been suggested that a post should have a modulus of elasticity close to that of human dentin, in order to distribute applied forces even- ly along the length of the post.5-7 Anusavice8 has established that the elastic modulus of gold alloys (circa 90 GPa) is the closest to that of dentin. However, these alloys are too expensive to be employed as a post and core, and cannot be
Corresponding author:
Somchai Urapepon
Department of Prosthodontics, Faculty of Dentistry, Mahidol University,
#6 Yothi Road, Rajthevee, Bangkok, 10400, Thailand Tel. 66814933887: e-mail, [email protected]
Received December 12, 2013 / Last Revision March 31, 2014 / Accepted April 7, 2014
© 2014 The Korean Academy of Prosthodontics
This is an Open Access article distributed under the terms of the Creative Commons Attribution Non-Commercial License (http://creativecommons.
org/licenses/by-nc/3.0) which permits unrestricted non-commercial use, distribution, and reproduction in any medium, provided the original work is properly cited.
supported by many patients.
Dental posts and cores, in a clinical situation, are in a closed environment. They are encapsulated within luting cement, the root structure and the crown restorations.
Some luting cement may form an insoluble film, which cov- ers the posts and cores and completely prevents them from making contact with the dentinal fluid, which in turn leads to potential corrosion of the posts.9 Furthermore, nickel has a much higher electromotive force than copper, and so it is anticipated that the addition of nickel to a copper-alu- minium alloy will be able to greatly improve the corrosion resistance and electrochemical abilities of posts and cores, and therefore resist attacks from the biological environ- ment. In addition, Cu-Al-Ni alloy is perceived to be a sig- nificant corrosion-resistant material. It is used in marine hardware, for handling seawater, and in the industrial pro- cessing fluids.10 Because it is very reasonable in price, this Cu-Al-Ni alloy could be developed for potential use in the dental post-and-core application.
MATERIALS AND METHODS
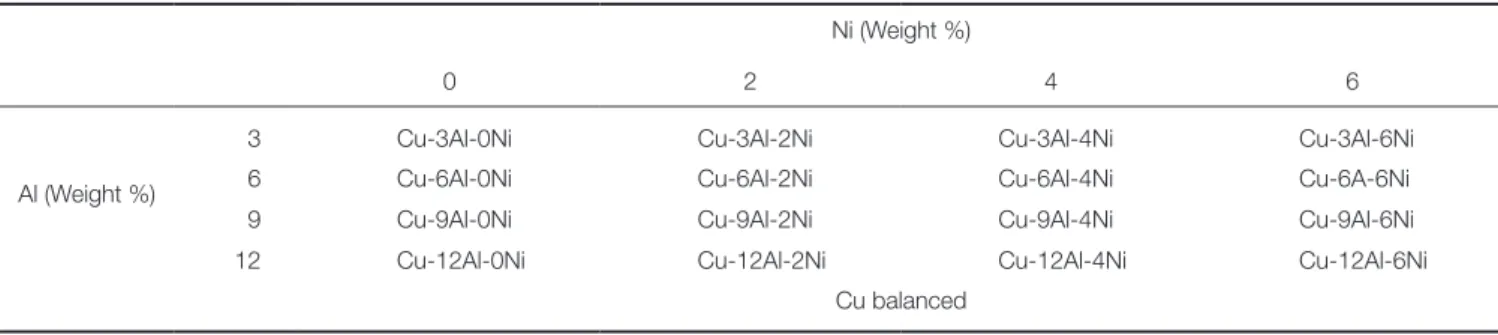
Sixteen groups of experimental alloys with varying propor- tions of Cu, Al and Ni were prepared, and the details of all groups are summarized in Table 1.
Highly purified (>99.99%) copper droplets, and alumin- ium and nickel beads (Wako Pure Chemical Industries Ltd., Chuo, Osaka, Japan) were used in this study. Each group weighed 35 g, with the calculated amounts of all elements established by using an analytical balance (Precisa 262 SMA-FR, Precisa Instruments AG, Dietikon, Switzerland).
The elements were melted together inside a 25 mm diame- ter cylindrical graphite crucible, contained within a fused silica crucible sleeve, using a vacuum induction casting unit (Linn HFS 3 Vacutherm, Linn High Therm GmbH, Eschenfelden, Germany). The vacuum was measured at approximately 50 mbar, and ultra-high purity argon was then fed in during the procedure. The ingot was bench- cooled within the crucible, and covered with a graphite cap.
The alloy compositions were determined after melting using a scanning electron microscope (JSM 4510 LV, JEOL Ltd., Akishima, Tokyo, Japan) and energy dispersion scan- ning (INCA x-act, Oxford Instruments PLC., Abingdon,
Oxfordshire, UK). The solidus, liquidus and melting range of each alloy was evaluated using a differential scanning cal- orimeter (DSC8270, Rigaku Corporation, Shibuya, Tokyo, Japan). Approximately 1 g of each sample was heated at a rate of 10ºC/min, extended to 1300ºC. The measurements were made using “d*TREK” software (Rigagu Corporation, Shibuya, Tokyo, Japan) on six samples for each group.
A ‘PMMA sheet’ (Sumipex TL, SumiplexTechsheet Co., Ltd., Kaosiung, Taiwan) was cut into smaller specimen pat- terns, 10 mm × 10 mm × 2 mm, to be used for corrosion, hardness and static immersion testing. The tensile dumbbell preformed patterns, with a screw threaded end, diameter of 3 mm and 18 mm in gauge length, in accordance with ISO standard (ISO 22674:2006),11 were constructed in a split-sil- icone mould (Xiameter RTV-3481, Dow Corning Corp., Midland, MI, US) using an acetal copolymer rod (Ertacetal C, Dotmar EPP Pty. Ltd., Acacia Ridge, QLD, Australia), and combined the screw thread via the injection of a mol- ten blue inlay wax (Type II, Class I, Kerr Corporation, Romulus, MI, USA).
The whole patterns were constructed and invested in cristobalite investment (Cristobalite PF, Shofu Incorporated, Higashiyama, Kyoto, Japan) using a vacuum mixing device (Vacuret-S, ReitelFeinwerktechnik GmbH, Bad Essen, Germany). The casting of all specimens was performed in a vacuum induction casting unit (Linn HFS 3 Vacutherm, Linn High Therm GmbH, Eschenfelden, Germany). Five impeccable specimens were prepared from each alloy for each test.
Five specimens (10 mm × 10 mm × 2 mm) of each group were mounted in epoxy resin (EpoKwick, Buehler, An ITW Company, Lake Bluff, IL, USA). The surface of each specimen was flattened and finished using a metallo- graphic grinder/polisher (Rotopol-21, Struers A/S, Copenhagen, Denmark) through a standard metallographic procedure, starting from FEPA P 200 to FEPA P 2000 sili- con carbide paper (CarbiMet 2, Buehler, An ITW Company, Lake Bluff, IL, USA), and finished with 1 µm diamond paste (Meta DI, Buehler, An ITW Company, Lake Bluff, IL, USA).
The surface hardness was determined using a micro- hardness tester (FM-700, Future-tech Corporation, Kawasaki, Kanakawa, Japan) via a Vickers’ indenter con-
Table 1. Sixteen experimental alloy group identifiers and element compositions used in this study Ni (Weight %)
0 2 4 6
Al (Weight %)
3 Cu-3Al-0Ni Cu-3Al-2Ni Cu-3Al-4Ni Cu-3Al-6Ni
6 Cu-6Al-0Ni Cu-6Al-2Ni Cu-6Al-4Ni Cu-6A-6Ni
9 Cu-9Al-0Ni Cu-9Al-2Ni Cu-9Al-4Ni Cu-9Al-6Ni
12 Cu-12Al-0Ni Cu-12Al-2Ni Cu-12Al-4Ni Cu-12Al-6Ni
Cu balanced
trollable load of 1 Kgf for 15 sec. Five readings were car- ried out in the center and the corner regions of each speci- men. All records were collected and analyzed statistically.
Five dumbbell specimens were loaded in tension using a universal testing machine (Model 5566, Instron Corporation, High Wycombe, Buckinghamshire, UK) at a crosshead speed of 1.5 ± 0.5 mm/min at room tempera- ture (23 ± 1ºC) until a fracture occurred.
The ultimate tensile strength, proof strength at a 0.2%
offset, modulus of elasticity and the percentage elongation were determined and recorded.
Two square specimens (10 mm × 10 mm × 2 mm) from each group were attached with stainless steel nuts using conductive silver epoxy resin (Fast Setting #05062-AB, SPI Supplies/Structure Probe Incorporated, West Chester, PA, USA). Next, the whole assembly was covered with an elec- trically insulating epoxy binder (UHU 2, Adhesives, UHU GmbH & Co. KG, Bühl/Baden, Germany) also embedded in epoxy resin (EpoKwick, Buehler, An ITW Company, Lake Bluff, IL, USA). The exposed surfaces of the embed- ded specimens were prepared with a grinder/polisher (Rotopol-21, Struers A/S, Copenhagen, Denmark) using a standard metallographic procedure, ending with FEPA P 4000 wetted silicon carbide paper. The exposed area of the test specimens was approximately 100 mm2. The specimens were then ultrasonically cleaned in 95% ethanol for 1 minute.
The experiment was carried out in a 0.9% sodium chlo- ride electrolyte (pH 7.4 ± 1), within double-walled corro- sion cell at 37ºC, using a saturated calomel electrode (SCE) and platinum wire as a reference and counter electrode. The temperature was controlled via circulated water passing through the cell wall, using a thermostatically controlled water bath (A10, Thermo Scientific Incorporated, Waltham, MA, USA). The electrodes were connected to a Potentiostat/
Galvanostat (Solartron 1285A, Farnborough, Hampshire, UK). The measurement was monitored using electrochemi- cal software (CorrWare and CorrView Version 3.20b, Scribner Associates Inc., Southern Pines, NC, USA).
Bubbled nitrogen gas was then produced through the electrolyte, at a rate of 100 cm3/min for at least 30 minutes, and then streamed into the cell. The open circuit potential (Eocp) was registered for 2 hours. Subsequently, the potentio- dynamic was scanned for 5 minutes after finishing the Eocp measurement, at a rate of 1 mV/sec from -150 mV of Eocp up to a potential of +1000 mV. The curvature of the Eocp, in mV (SCE), versus time, and the curve of potential versus the logarithm of current density, were both recorded.
Two quadrilateral specimens from each group, with a total surface area of approximately 200 mm2, were blasted using standard metallographic procedures, in order to remove the surfaces at least 0.1 mm of material. Finally, FEPA P 4000 wet silicon carbide paper was employed. The surface area of each specimen was recorded, ultrasonically cleaned in 95% ethanol for 1 minute, rinsed in distilled water, and then dried with oil-free compressed air. An aqueous solution comprising 0.1 mol/L lactic acid and 0.1 mol/L sodium chloride, with a pH value in the range of 2.2
to 2.4, was prepared immediately before use.
A 100 mL bottle (SCHOTT Duran, Duran Productions GmbH & Co. KG, Hattenbergstraße, Mainz, Germany) was used to contain the aqueous solution. Each test specimen was suspended by being hung on nylon strings in separate bottles, at 37 ± 1ºC, for 7 days. The bottles were tightly sealed to prevent evaporation. After 7 days all specimens were removed, and the test solutions were collected and analyzed separately using Atomic Absorption Spectrometry (Varian SpectrAA-200, Varian Semiconductor Equipment, Gloucester, CA, USA). The values of each observed ele- ment were recorded in µg/cm2/7d.
Six specimens from each group were cut from the sprues of the dumbbell casting. All sides of the specimens were removed using FEPA P 1000 silicon carbide paper, in order to create sample discs measuring 5 mm diameter and 1mm thickness. The specimens were ultrasonically cleaned in 95% ethanol for 1 minute, rinsed with distilled water and then dried with oil-free compressed air.
The cytotoxicity was tested following the general guide- lines presented in ISO 10993-5:1999.12 The L929 (NCTC Clone, ATCC Lot. 2869501, Passage No. 556, American Type Culture Collection, Manassas, VA, USA) was used for the cell line. The monolayer of cell line was suspended in 3% agar (Calbiochem 12177 Agar, Merck KGaA, Darmstadt, Germany) in order to obtain a final concentra- tion of approximately 3 × 10⁵ cells/mL, and was prepared in a 90 mm diameter culture dish (Corning Dish, Corning Incorporated, Corning, NY, USA). Ten milliliters of L929 cells, with an intensity of 2.5 × 10⁵ cells per cm3 in a com- pleting cultured DMEM medium (Gibco DMEM, Invitrogen Corporation, Carlsbad, CA, USA), were then applied into the dish. The dish was incubated in a CO2 incubator (Thermo Scientific Forma Series II, Thermo Fisher Scientific Incorporated, Marietta, OH, USA) with 5.0% CO2 and 95% relative humidity, at 37ºC, for 24 hours.
The cell style developed as a monolayer, and then removed the cultured medium. The culture dish was then refilled with new more of the agar cultured medium with contains completed 2×DMEM medium and 3% agar. The cultured dish was left until the agar cultured medium became stiff, and it was then dyed with 1% neutral red indicator (C15H17CIN4, C.I. 50040, Merck KGaA, Darmstadt, Germany).
The area within the cultured dish was then divided into 4 sectors (testing zones), and controlled specimens of posi- tive disc (Polyurethane film-ZDEC: RM-A, Hatano Research Institute, Kanakawa, Japan) and negative disc (Thermanox, Thermo Fisher Scientific Incorporated, New York, NY, USA) were located on the upper right and upper left testing zones, accordingly. The bottom two testing zones provided the sample discs. The culture dish was again incubated, in an incubator with 5.0% CO2 and 95% relative humidity, at 37ºC, for 24 hours. The decolorized zones and cell lysis were recorded under an inverted phase contrast microscope (Eclipse TS100, Nikon Corporation, Chiyoda, Tokyo, Japan). Consequently, the ratio of the decolorized zones and the cell lysis were both calculated as a cell
response.
The data of the hardness, tensile strength, 0.2% proof stress, modulus of elasticity, percentage elongation and thermal property of the experimental alloys were analyzed using the two-way analysis of variance and Tukey’s test, at a significance level of 0.05 (PASW Statistics 18.0.0, SPSS Inc., Chicago, IL, USA).
RESULTS
The solidus and liquidus points increased as the nickel con- tent increased. The influence of aluminium content was significantly higher when the aluminium content was at its lowest (3 wt% Al) as depicted in Fig. 1. The Cu-3Al-6Ni alloy showed the highest solidus and liquidus points (1069.2
± 0.3ºC and 1113.4 ± 1.5ºC, respectively). Additionally, the lowest solidus and liquidus points, with the same nickel content, were exhibited by the 9 wt% Al alloy.
The widest melting ranges (46.3 ± 1.4, 35.1 ± 0.5, 32.7
± 2.0 and 44.2 ± 1.7ºC), with the same nickel content, were measured in the alloys with the lowest aluminium content (3 wt% Al). Likewise, the narrowest melting ranges (27.7 ± 0.1, 28.9 ± 0.2, 26.9 ± 1.1 and 29.1 ± 0.1ºC) were found in the alloys with the highest aluminium content (12 wt% Al).
Accordingly, the melting ranges of the alloys decreased when the aluminium contents were increased. Furthermore, the melting ranges of the alloys with the same nickel con- tent significantly decreased, once the content of aluminium reached more than 6% (Table 2).
According to the worst castability of the Cu-12Al-6Ni alloy, those castings could not be completely produced in this group. The physical and mechanical properties of this alloy were therefore discarded.
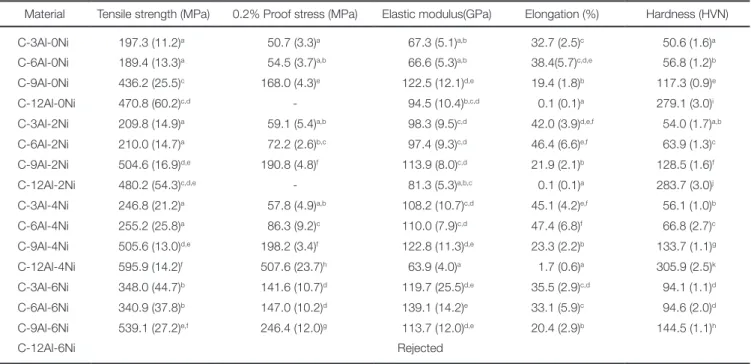
The surface hardness was influenced by both factors and their interaction which, correspondingly, increased as both elements increased. Aluminium demonstrated a higher degree of increase rather than nickel. The highest surface hardness (305.9 ± 2.5 HVN) was revealed in the Cu-12Al- 4Ni alloy (Table 3).
The tensile strength was influenced by both factors without any effect upon interaction. It increased as the both elements increased. Again, Aluminium showed a high- er degree of increase rather than nickel. The highest ulti- mate tensile strength (595.9 ± 14.2 MPa) was shown in the Cu-12Al-4Ni alloy.
Similarly, 0.2% proof stress was influenced by both fac- tors and their interaction. The alloy with the highest alu- minium content (12 wt% Al) showed a significant increase in the 0.2% proof stress, but the elongation was extremely limited.
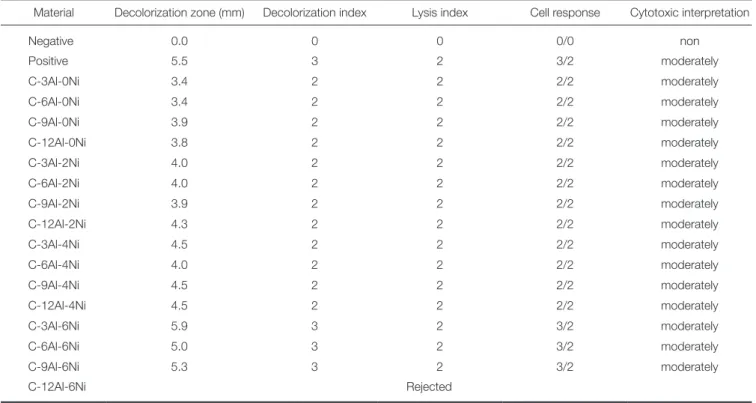
Table 4 shows the results of cytotoxicity of the cells in the experimental alloys. All alloys exhibited moderately cytotoxicity, similar to the conventional alloys used in den- tistry.13,14 However, the higher content of nickel showed more decolorization zones. The highest content of nickel (6 wt% Ni) showed the widest decolorization zone (5.0-5.9 mm) that caused the decolorization index up to level three.
This confirmed the negative effects of nickel in its biocom- patibility.
As shown in Table 5, the elution of copper (0.18, 0.45, 0.91 and 0.37 μg/cm2/7d) seems to be faded out, when the aluminium content is increased to 9%. This result con- firmed that aluminium was acting as a tarnished protector of the copper alloys. The amount of nickel leasing out increased when the nickel contents were increased. The lowest value (1.14, 5.45 and 6.13 μg/cm2/7d) was demon-
Fig. 1. Solidus, liquidus and melting ranges of experimental alloys.
Table 2. Thermal properties of experimental alloys
Material Solidus (°C) Liquidus (°C) Melting range (°C)
C-3Al-0Ni 1032.3 (1.2)f 1078.6 (0.1)e 46.3 (1.4)g
C-6Al-0Ni 1026.5 (0.4)b 1060.1 (1.2)b 33.6 (1.4)c,d
C-9Al-0Ni 1022.7 (0.9)a 1054.5 (0.1)a 30.7 (0.4)a
C-12Al-0Ni 1031.5 (0.5)d,e 1059.1 (0.4)b,c 27.6 (0.1)a
C-3Al-2Ni 1057.4 (0.6)j 1092.5 (1.0)g 35.1 (0.5)d
C-6Al-2Ni 1032.8 (1.1)f 1067.8 (1.1)d 35.0 (0.1)d
C-9Al-2Ni 1024.8 (0.1)b 1053.3 (2.6)a 28.5 (2.9)a
C-12Al-2Ni 1032.1 (0.1)e,f 1061.0 (0.4)c 28.9 (0.2)a
C-3Al-4Ni 1066.4 (0.4)k 1099.0 (1.7)h 32.7 (2.0)b,c
C-6Al-4Ni 1045.2 (0.6)h 1077.2 (0.5)e 32.0 (0.8)b
C-9Al-4Ni 1030.8 (0.1)e 1057.7 (0.1)b 26.9 (0.1)a
C-12Al-4Ni 1040.9 (0.3)g 1067.8 (1.2)d 26.8 (1.1)a
C-3Al-6Ni 1069.2 (0.3)l 1113.4 (1.5)i 44.1 (1.7)f,g
C-6Al-6Ni 1044.7 (0.1)h 1086.2 (1.5)f 41.5 (1.7)e
C-9Al-6Ni 1029.5 (0.3)b 1058.3 (0.2)b 28.5 (0.9)a
C-12Al-6Ni 1048.6 (0.2)i 1077.6 (0.1)e 29.1 (0.1)a
Values are means (SD). Identical letters indicate no statistical difference (P<.05).
Table 3. Summarizes the mechanical properties of the experimental alloy
Material Tensile strength (MPa) 0.2% Proof stress (MPa) Elastic modulus(GPa) Elongation (%) Hardness (HVN)
C-3Al-0Ni 197.3 (11.2)a 50.7 (3.3)a 67.3 (5.1)a,b 32.7 (2.5)c 50.6 (1.6)a
C-6Al-0Ni 189.4 (13.3)a 54.5 (3.7)a,b 66.6 (5.3)a,b 38.4(5.7)c,d,e 56.8 (1.2)b C-9Al-0Ni 436.2 (25.5)c 168.0 (4.3)e 122.5 (12.1)d,e 19.4 (1.8)b 117.3 (0.9)e
C-12Al-0Ni 470.8 (60.2)c,d - 94.5 (10.4)b,c,d 0.1 (0.1)a 279.1 (3.0)i
C-3Al-2Ni 209.8 (14.9)a 59.1 (5.4)a,b 98.3 (9.5)c,d 42.0 (3.9)d,e,f 54.0 (1.7)a,b C-6Al-2Ni 210.0 (14.7)a 72.2 (2.6)b,c 97.4 (9.3)c,d 46.4 (6.6)e,f 63.9 (1.3)c C-9Al-2Ni 504.6 (16.9)d,e 190.8 (4.8)f 113.9 (8.0)c,d 21.9 (2.1)b 128.5 (1.6)f
C-12Al-2Ni 480.2 (54.3)c,d,e - 81.3 (5.3)a,b,c 0.1 (0.1)a 283.7 (3.0)j
C-3Al-4Ni 246.8 (21.2)a 57.8 (4.9)a,b 108.2 (10.7)c,d 45.1 (4.2)e,f 56.1 (1.0)b
C-6Al-4Ni 255.2 (25.8)a 86.3 (9.2)c 110.0 (7.9)c,d 47.4 (6.8)f 66.8 (2.7)c
C-9Al-4Ni 505.6 (13.0)d,e 198.2 (3.4)f 122.8 (11.3)d,e 23.3 (2.2)b 133.7 (1.1)g
C-12Al-4Ni 595.9 (14.2)f 507.6 (23.7)h 63.9 (4.0)a 1.7 (0.6)a 305.9 (2.5)k
C-3Al-6Ni 348.0 (44.7)b 141.6 (10.7)d 119.7 (25.5)d,e 35.5 (2.9)c,d 94.1 (1.1)d
C-6Al-6Ni 340.9 (37.8)b 147.0 (10.2)d 139.1 (14.2)e 33.1 (5.9)c 94.6 (2.0)d
C-9Al-6Ni 539.1 (27.2)e,f 246.4 (12.0)g 113.7 (12.0)d,e 20.4 (2.9)b 144.5 (1.1)h
C-12Al-6Ni Rejected
Values are means (SD). Identical letters indicate no statistical difference (P<.05).
strated in the 6 wt% Al alloys. Nevertheless, within the same nickel content alloys, the overall number of elements leasing out in 9 wt% Al groups (62.28, 20.31, 34.34 and 36.42 μg/cm2/7d) were lower than the others, and the Cu-9Al-2Ni alloy also demonstrated the lowest value (20.31 μg/cm2/7d).
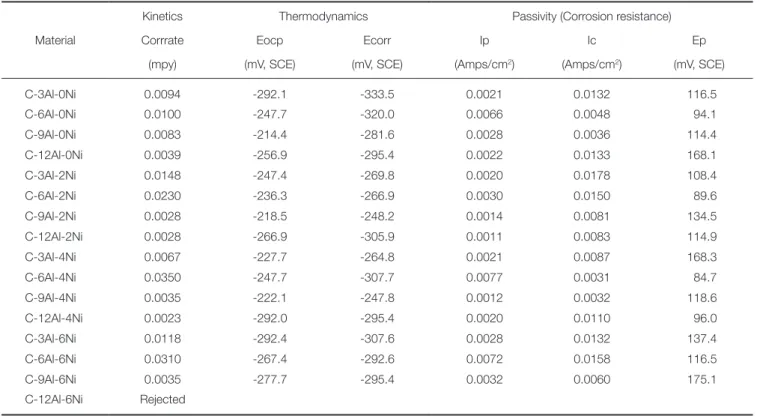
The kinetics, thermodynamics and passivity of the experimental alloys are shown in Table 6. The open circuit potentials (Eocp) of the 9 wt% Al alloys (-214.4, -218.5 and -222.1 mV, SCE) existing have higher a potential than the others within the same groups, once the nickel content drops to less than 6%. Similarly, the corrosion potential (Ecorr) of these alloys (-281.6, -248.2 and -247.8 mV, SCE) exhibits the same manner as the open circuit potential (Eocp).
The potential of the passive region (Ep) specifies the stability of the passive film, the higher value the better. The 6 wt% Al alloys presented the least value (94.1, 89.6, 84.7 and 116.5 mV, SCE) within the same nickel groups, and this meant that the passive film of these alloys was the easiest to breakdown and lose the oxide film, corresponding to their corrosion rates (0.01, 0.023, 0.035 and 0.031 mpy).
The Cu-6Al-4Ni alloy revealed the highest corrosion rate.
There was not enough difference in cathodic current density (Ic) and passive current density (Ip) to determine the alloy passivity. On the one hand, the smaller cathodic cur- rent density (Ic) in the passive region indicated a higher Table 4. Cytotoxicity of the experimental alloy evaluated by the Agar Overlay Test
Material Decolorization zone (mm) Decolorization index Lysis index Cell response Cytotoxic interpretation
Negative 0.0 0 0 0/0 non
Positive 5.5 3 2 3/2 moderately
C-3Al-0Ni 3.4 2 2 2/2 moderately
C-6Al-0Ni 3.4 2 2 2/2 moderately
C-9Al-0Ni 3.9 2 2 2/2 moderately
C-12Al-0Ni 3.8 2 2 2/2 moderately
C-3Al-2Ni 4.0 2 2 2/2 moderately
C-6Al-2Ni 4.0 2 2 2/2 moderately
C-9Al-2Ni 3.9 2 2 2/2 moderately
C-12Al-2Ni 4.3 2 2 2/2 moderately
C-3Al-4Ni 4.5 2 2 2/2 moderately
C-6Al-4Ni 4.0 2 2 2/2 moderately
C-9Al-4Ni 4.5 2 2 2/2 moderately
C-12Al-4Ni 4.5 2 2 2/2 moderately
C-3Al-6Ni 5.9 3 2 3/2 moderately
C-6Al-6Ni 5.0 3 2 3/2 moderately
C-9Al-6Ni 5.3 3 2 3/2 moderately
C-12Al-6Ni Rejected
Table 5. Elution of elements presented in the test solution after seven days
Material Cu Al Ni Over all
(mg/cm2/7d)
C-3Al-0Ni 110.10 6.38 0.18 116.66
C-6Al-0Ni 127.70 15.97 0.22 143.89
C-9Al-0Ni 0.18 61.87 0.23 62.28
C-12Al-0Ni 0.11 81.70 0.22 82.03
C-3Al-2Ni 97.25 2.77 8.97 108.99
C-6Al-2Ni 31.15 11.21 1.44 43.80
C-9Al-2Ni 0.45 14.72 5.14 20.31
C-12Al-2Ni 0.05 42.66 7.37 50.07
C-3Al-4Ni 109.50 6.74 7.89 124.13
C-6Al-4Ni 93.24 6.82 5.45 105.51
C-9Al-4Ni 0.91 24.61 8.83 34.34
C-12Al-4Ni 0.34 38.35 11.54 50.23
C-3Al-6Ni 90.72 5.36 9.83 105.91
C-6Al-6Ni 35.02 3.37 6.13 44.52
C-9Al-6Ni 0.37 22.79 13.26 36.42
C-12Al-6Ni Rejected
degree of passivation and, on the other, the lower passive current density (Ip) indicated better corrosion resistance.
The 9 wt% Al alloys exhibited higher corrosion resistance than the others and demonstrated the easiest passivation.
DISCUSSION
The available base-metal alloy in dentistry has a much high- er modulus of elasticity than the root dentin.8 The copper alloys have been developed in this study for use as a post and core material. The aimed properties of experimental materials focused upon the mechanical and physical proper- ties of these materials, to be comparable to those of stan- dard, dental gold alloys. Therefore, a desirable value of the elastic modulus of the experimental alloys would be com- parable to gold alloys (70-100 GPa), 180 MPa of 0.2%
proof strength, and present 10% elongation.
According to the desired properties, Cu-9Al with 2Ni and 4Ni would be most suitable for further investigation.
The amount of aluminium added can increase the ultimate tensile strength, 0.2% proof stress, and modulus of elastici- ty to the optimal level. Adding more aluminium could increase the strength, elastic modulus, and hardness to be much higher than those of tooth structures, which is not beneficial for the intended application. The elongation also decreased when the concentration of aluminium was more than 9%, and the alloy became brittle. The strengthening
effect might be due to the form phase of aluminium with copper, whereby the alloy would form a single-phase (face- centered cubic) alpha alloy, if the alloy containing alumini- um contained less than 8%. This alloy has high ductility, and is suitable for cold forming, such as wiring, tubing and sheeting. If the aluminium content was increased to between 8% and 10%, then the alloys were highly strength- ened by the appearance of a harder (body-centered cubic) beta phase. This phase made the alloy stronger and more suitable for casting. However, if the aluminium content increased to more than 10%, then it would be difficult to cast, because of the low castability of copper alloy.15
The amount of nickel incorporated into the alloy com- positions also affected the mechanical and physical proper- ties of the experimental copper alloys, but the effects were not as prominent as those occurring from aluminium. An increase in nickel content of 0 to 4% could not significantly affect the ultimate tensile strength of 3-6 wt% Al alloy (189.4 ± 13.3 to 255.2 ± 25.8 MPa). However, from the static immersion tests, the level of nickel added should not exceed 4%, or the elution of nickel increased. Additionally, the results of the biocompatibility tests showed that the experimental alloys with 6 wt% Ni were more toxic than the other groups.
The 12 wt% Al fusion with 6 wt% Ni could not issue complete castings, and it caused many defects and incom- plete castings.
Table 6. Results of the Electrochemical Corrosion Tests
Kinetics Thermodynamics Passivity (Corrosion resistance)
Material Corrrate Eocp Ecorr Ip Ic Ep
(mpy) (mV, SCE) (mV, SCE) (Amps/cm2) (Amps/cm2) (mV, SCE)
C-3Al-0Ni 0.0094 -292.1 -333.5 0.0021 0.0132 116.5
C-6Al-0Ni 0.0100 -247.7 -320.0 0.0066 0.0048 94.1
C-9Al-0Ni 0.0083 -214.4 -281.6 0.0028 0.0036 114.4
C-12Al-0Ni 0.0039 -256.9 -295.4 0.0022 0.0133 168.1
C-3Al-2Ni 0.0148 -247.4 -269.8 0.0020 0.0178 108.4
C-6Al-2Ni 0.0230 -236.3 -266.9 0.0030 0.0150 89.6
C-9Al-2Ni 0.0028 -218.5 -248.2 0.0014 0.0081 134.5
C-12Al-2Ni 0.0028 -266.9 -305.9 0.0011 0.0083 114.9
C-3Al-4Ni 0.0067 -227.7 -264.8 0.0021 0.0087 168.3
C-6Al-4Ni 0.0350 -247.7 -307.7 0.0077 0.0031 84.7
C-9Al-4Ni 0.0035 -222.1 -247.8 0.0012 0.0032 118.6
C-12Al-4Ni 0.0023 -292.0 -295.4 0.0020 0.0110 96.0
C-3Al-6Ni 0.0118 -292.4 -307.6 0.0028 0.0132 137.4
C-6Al-6Ni 0.0310 -267.4 -292.6 0.0072 0.0158 116.5
C-9Al-6Ni 0.0035 -277.7 -295.4 0.0032 0.0060 175.1
C-12Al-6Ni Rejected
The solidus and liquidus temperatures of all the experi- mental alloys slightly decreased as the aluminium content increased from 3-12%. The effect of nickel content was not noticeable in this aspect. Thus, the melting ranges were only influenced by the aluminium content. They decreased as the aluminium content increased. The solidus and liqui- dus temperatures were recorded at circa 1000-1100ºC, and therefore within the ranges of commercially available gold alloys.
The ultimate tensile strength and 0.2% proof strength of the experimental alloys exceeded the minimum require- ments. The optimum strength required for post and core restoration is crucial, because it has to withstand the com- plex loading forces which occur during chewing.16,17 It would be remarkably destructive for the whole restoration, even if a minute amount of deformation occurred along the post and core structure.
The electrochemical behaviors of the experimental alloys showed little difference in the potentiodynamic pat- terns. Alloys with more aluminium content displayed more stability in the passive film. The aluminium content plays an active role in the corrosion protection of this alloy. Additionally, the formation of a very thin protective film may be due to the characters of these alloys in the 0.9% NaCl electrolyte.18 The corrosion reaction of copper, especially in a solution containing chloride ions, was quite complicated, but the reactions might briefly be described as the formation of copper (I) cuprous, and copper (II) cupric oxides, together with insoluble hydrated chlorides. Meyer and Nally19 indi- cated that 0.9% saline solution was considered to be six times more aggressive than saliva and its artificial substi- tutes. However, Marek and Topfl20 suggested that 1% NaCl was unsuitable for measurement, other than the screening test for generalized corrosion.
As a result a slight reduction of corrosion current, tracking on the active peak potential was found. One char- acteristic of the potentiodynamic polarization curves of the alloys was that they reached their own stable passive current density, and were discovered to be more stable when rising to breakdown potential (Ep), which demonstrated the style of their passive behavior.
The electrochemical behaviors of all the experimental alloys can withstand the oxidation potential ranges of the oral cavity21 (-58 to + 212 mV), due to their passivity poten- tial (Ep) remaining stable and within the oral oxidation potential ranges.
The goal of all biocompatibility testing is the screening test for dental materials. ISO standard 7405:200822 has sug- gested a series of tests to ascertain that medical or dental materials, and devices, are biocompatible. This aspect would also include the corrosive behavior of the materials, especially elements released into the simulated environment.
The results of the biocompatibility tests presented moderate cytotoxicity, which was comparable to the posi- tive controls, but lessened in terms of cell response (2/2 and 3/2). Nevertheless, the higher content of nickel exhib- ited more decolorization zones. The highest content of
nickel, 6 wt % in this study, revealed widespread decoloriza- tion zones and, in turn, indicated that nickel had a negative toxicity effect upon the cells. The nickel ion was found to induce the cell to release an intracellular enzyme lactic dehydrogenase, which stimulated lactic acid production.
Lactic acid in the cell would cause DNA damage, leading to the response of the cell to repair the DNA.23 Several stud- ies have shown evidence of the negative effects of nickel in human cells, and numerous nickel compounds are consid- ered to be carcinogens.24,25 However, more evidence has been found in that nickel contained appliances cause con- tact allergies. More interestingly, their reactions to dental and orthodontic appliances appear to be infrequent in cer- tain circumstances.26,27 The results of the biocompatibility presented for the highest content of nickel in this study, 6 wt% Ni, revealed the largest cell response being equal to positive control. For that reason, these alloys were not suit- able for application in this situation. However, the element release results showed the lowest levels in the 2 wt% Ni alloys. This would be explained by the reaction of the nick- el to aluminum. A small amount of nickel is able to form a completely solidified solution for aluminum, and the rest of the nickel is free in the alloy. However, the total metal ion release (20.3 to 143.9 µg/cm2/7d) from the experimental alloys into the test solution distributed no greater than the maximum value of the ISO standard specification; not exceeding 200 µg/cm2/7d.11
CONCLUSION
Within the limitations of this study, the following conclu- sions were drawn:
1. A content of aluminium measured at more than 9%
of the experimental alloys exhibited brittleness and low elongation. Once this content reached less than 9% the passive film of these alloys exhibited poor stability, together with the 0.2% proof strength not complying with the ISO standard.
2. Nickel affected the mechanical properties of the experimental alloy less than aluminum did, but clearly influenced the corrosion resistance and stability of the passive film. However, a content of nickel mea- suring more than 4% in the experimental alloys intro- duced toxicity equal to positive control.
3. The mechanical properties of the copper alloys fus- ing of 9 wt% Al and 2-4 wt% Ni complied with the ISO standard. Nevertheless, Cu-9Al-2Ni was consid- ered as a potential material because its properties were in acceptable ranges in both the physical and mechanical properties. Additionally, this alloy present- ed the least elution of elements when compared with the other groups.
ACKNOWLEDGEMENTS
The authors would like to thank; all the staff in the Research Office and the School of Dental Technology, Faculty of
Dentistry at Mahidol University, who all engaged in this study.
We thank to the Department of Dental Materials Science, the School of Dentistry at Niigata, Nippon Dental University, Japan, who helped in the accomplishment of this work.
We are grateful to the Office of The Higher Education Commission, The Ministry of Education, Thailand, for providing the grant for this study.
REFERENCES
1. Stockton LW. Factors affecting retention of post systems: a literature review. J Prosthet Dent 1999;81:380-5.
2. Kantor ME, Pines MS. A comparative study of restorative techniques for pulpless teeth. J Prosthet Dent 1977;38:405- 12.
3. Leary JM, Aquilino SA, Svare CW. An evaluation of post length within the elastic limits of dentin. J Prosthet Dent 1987;57:277-81.
4. Eissman HF, Radke RA Jr. Postendodontic restoration. In:
Cohen S, Burns RC, eds. Pathway of the pulp. 4th ed. St.
Louis; Mosby; 1987. p. 640-83.
5. Potashnick SR, Weine FS, Strauss S. Restoration of the end- odontically treated tooth. In: Weine FS, ed. Endodontic ther- apy. 4th ed. St. Louis; Mosby; 1989. p. 653-98.
6. Harold H, Charles JG. Preparation for restoration. In:
Torabinejad M, Walton RE eds. Endodontics: Principles and practice. 4th ed, Saunders; Elsiver Health Sciences; St. Louis;
MO; 2009. p. 287-9.
7. Gutmann JL. The dentin-root complex: anatomic and biologic considerations in restoring endodontically treated teeth. J Prosthet Dent 1992;67:458-67.
8. Anusavice KJ. Mechanical properties of dental materials. In:
Anusavice KJ, eds. Phillips’ Science of Dental Materials. 11th ed. St. Louis; Saunders Co; 2003. p. 73-101.
9. Sorensen JA, Engelman MJ, Daher T, Caputo AA. Altered corrosion resistance from casting to stainless steel posts. J Prosthet Dent 1990;63:630-7.
10. Arthur Cohen. ASTM International, MNL20-2ND-EB, Jan 2005. p. 565
11. ISO 22674. Dentistry-Metallic materials for fixed and removable restorations and appliances. Geneva; Switzerland; International Organization for Standar-dization; 2006.
12. ISO 10993-5. Biological evaluation of medical devices-Part 5:
Tests for in vitro cytotoxicity. Geneva; Switzerland; International Organization for Standar-dization; 1999.
13. Geurtsen W. Biocompatibility of dental casting alloys. Crit Rev Oral Biol Med 2002;13:71-84.
14. Wataha JC. Biocompatibility of dental casting alloys: a review.
J Prosthet Dent 2000;83:223-34.
15. Davis JR. Metal handbook. Desk ed.; 2nd ed. The materials information society. ASM international 1998. p. 442, 510.
16. Sorensen JA, Martinoff JT. Clinically significant factors in dowel design. J Prosthet Dent 1984;52:28-35.
17. Trabert KC, Cooney JP. The endodontically treated tooth.
Restorative concepts and techniques. Dent Clin North Am
1984;28:923-51.
18. Treathewey KR, Chamberlain J. The theory of aqueous cor- rosion. In: Corrosion for science and engineering. 2nd ed.
Addison-Wesley; Longman; 1995. p. 116.
19. Meyer JM, Nally JN. Influence of artificial salivas on the cor- rosion of dental alloys. J Dent Res 1975;54:678.
20. Marek M, Topfl E. Electrolytes for corrosion testing of den- tal alloys. J Dent Res 1986;65:301.
21. Ewers GJ, Greener EH. The electrochemical activity of the oral cavity-a new approach. J Oral Rehabil 1985;12:469-76.
22. ISO 7405. Dentistry-Evaluation of biocompatibility of medical devices used in dentistry. Geneva; Switzerland; International Organization for Standar-dization; 2008.
23. Hartwig A, Asmuss M, Ehleben I, Herzer U, Kostelac D, Pelzer A, Schwerdtle T, Bürkle A. Interference by toxic metal ions with DNA repair processes and cell cycle control: mo- lecular mechanisms. Environ Health Perspect 2002;110:797- 9.
24. Thyssen JP, Linneberg A, Menné T, Johansen JD. The epide- miology of contact allergy in the general population-preva- lence and main findings. Contact Dermatitis 2007;57:287-99.
25. Kornik R, Zug KA. Nickel. Dermatitis 2008;19:3-8.
26. Norseth T. Cancer hazards caused by nickel and chromium exposure. J Toxicol Environ Health 1980;6:1219-27.
27. Setcos JC, Babaei-Mahani A, Silvio LD, Mjör IA, Wilson NH.
The safety of nickel containing dental alloys. Dent Mater 2006;22:1163-8.