Global Scenario of Open Access Publishing: A Decadal
Analysis of Directory of Open Access Journals (DOAJ)
2003-2012
J. of infosci. theory and practice 1(3): 47-59, 2013 http://dx.doi.org/10.1633/JISTaP.2013.1.3.4
Research Paper http://www.jistap.org
Journal of Information Science Theory and Practice
JISTaP
ABSTRACT
The present study aims to assess the growth of open access journals at a global level. The concept of Open Access (OA) publishing is being well received among academic circles and as a result we can see more and more scholar-ly content is being made these days available in open access format. The present study is simpscholar-ly an attempt to assess the trend and growth of open access journals during the last decade, viz. for the period 2003-2012, for which data has been retrieved from the Directory of Open Access Journals (DOAJ), which as of date hosts more than 9700 journals from 120 countries across the world covering major languages of the world. But keeping in view the period of our study the data has been retrieved as per our applicability, which as a result confines our study to 8453 journals only. The directory covers 18 main subject areas having 76 sub-disciplines, each having on average 118.53 journals. During the entire decade the number of countries which entered into OA publishing rose from 49 to 120 with a growth of 144%, and if this growth rate continues to be the same for the next five years, viz. by 2018, the world will turn into 100% open access. At the continental level Europe leads the tally by publishing a maximum of 3140 OA journals contributed by 43 countries across Europe, which again is the highest number from any continent.
Keywords:DOAJ, Open Access (OA), Open Access Movement, Open Access Publishing
Accepted date: September 16, 2013 Received date: July 30, 2013
✻Corresponding Author: Ramesh Pandita Librarian
BGSB University, India
E-mail: [email protected]
All JISTaP content is Open Access, meaning it is accessible online to everyone, without fee and authors’ permission. All JISTaP con-tent is published and distributed under the terms of the Creative Commons Attribution License (http://creativecommons.org /licenses/by/3.0/). Under this license, authors reserve the copy-right for their content; however, they permit anyone to unre-strictedly use, distribute, and reproduce the content in any medi-um as far as the original authors and source are cited. For any reuse, redistribution, or reproduction of a work, users must clari-fy the license terms under which the work was produced.
Open Access
Ramesh Pandita
✻BGSB University, India
E-mail: [email protected]
B. Ramesha
Dept. of Library and Information Science University of Bangalore, India
1. INTRODUCTION
The concept of open access has received greater atten-tion in the twenty-first century, though the concept of open access has been very much prevalent since the 1980’s when the concept of self-archiving started receiving acceptance among computer scientists as they started achieving their research output (Poynder, 2004). The concept of open access (OA) was not much in vo-gue during the 80’s and it was only in the 1990’s when the concept started gaining ground. It was Steven Har-nad who in 1994 proposed the concept of open access publishing (Harnad, 2007). In 1992 only five journals were published in open access format, which over the period of time has grown leaps and bounds so that to-day we can see the Directory of Open Access Journals (DOAJ) alone hosts more than 9700 journals, cutting the barriers of region, language, cost, and above all accessibility.
The Directory of Open Access Journals came into being in the year 2002, simply as an outcome of the first Nordic conference on scholarly communication in Lund/Copenhagen in October 2002 (Bibliotecnica), and became functional on May 12, 2003 with the laun-ch of 300+ journals. Lund University has been truly instrumental in the launch of DOAJ and has since then continuously played a very vital role in hosting, main-taining, and partly funding the directory covering free full text scientific and scholarly journals in almost all subjects and languages.
Data for analysis has been mined from the home web-site of the Directory of Open Access Journals which at the date of access hosted more than 9700 open access journals from more than 120 countries covering vari-ous languages of the world. Apart from DOAJ, publish-ers do support open access publishing at an individual level. Most of the publishers host separately the open access journals they publish on their respective web-sites. Still more, there is a growing trend towards hav-ing a few open access articles even in closed access journals and the same are indicated with a green color; this practice is also termed as hybrid OA.
The concept of open access publishing received its footing from the fact that most research undertaken all across the globe is primarily supported by public money as the money provided to various government
agencies by government is raised from public mostly in the form of taxes; as such the public has every right to know about the research results without paying for it (Gul, Wani, & Majeed, 2008). It is believed that in Japan not more than 10% of taxpayer money is used in research projects, whereas contrary to this fact, in Aust-ralia more than 80% of money involved in research projects is collected from the public in the shape of tax revenue (Worlock, 2004).
Among other studies undertaken earlier in the field of open access, and confined to DOAJ in particular, is one by Loan et al. (2008) entitled “Indian contribution to open access publishing: a case study of DOAJ and OpenDOAR.” This study highlighted the trend of open access publishing in India by evaluating the sta-tistical data of DOAJ. Paul Vierkant (2012) in his recent study entitled “Visualizing Open Access; Global distribution of open access items” discusses the top twenty five (25) countries of the world contributing to DOAJ. David Solomon and Bo‐Christer Björk (2011), while analyzing the data of DOAJ, discuss the publish-ing fees in open access journals via sources of fundpublish-ing and factors influencing choice of journal.
All these facts and many other similar factors sup-port the cause of going open access globally and the present study is just simply a tribute in this direction. Making available research results to the public in gen-eral and seekers of information in particular free of cost is already being seen as a step forward towards growth and development. With regard to authenticity, credibility, and reliability of information, the research results published in open access journals get better cor-roboration from the fact that open access journals are being cited more these days when compared to closed access journals because of greater visibility and wider reach. Suber (2003) is also of the view that scholarly lit-erature should be freely available online. The concept of delayed open access is additionally gaining ground these days; content published in this format is made available to the public for access free of cost after a cer-tain period of time (Harnad & Brody, 2004). More and more institutional publications are being made avail-able to the public free of cost. A good number of closed access journals have already switched over to open access format and there is no looking back for OA publishing.
1.1 Need, Purpose, and Importance of Study
The need, purpose, and importance of the present study can be measured from various aspects, firstly by the widespread open access movement across the globe whereby people have grown more conscious towards the use of public money in research activities, which as a result confers as a matter of right to the public to have free access to research results undertaken by the support of public money. Secondly, the growing trend towards open access publishing is also seen from the point of view that making research results public free of cost has helped researchers to achieve their objectives to a greater degree, for which they mostly undertake research. Thirdly OA has helped a great deal in making research results more visible, and so there is a growing trend towards citing open access journals in one’s research activity. Thereby the work of other rese-archers gets better acknowledged and cited.
Journals which previously used to be published in closed access format have now started switching over to open access format. These and many other similar reasons are there which support the cause of under-taking the present study and developing a conscious-ness among the general populace about the need and importance of publishing their research results in open access format.
1.2 Objectives
The main objectives of the study are, to understand the publication distribution of OA journals at a global and continental level, to assess the growth of open access journals during the last decade, and to assess the growth of the number of countries during the last de-cade which entered into OA publishing and those countries contributing maximally to OA journals.
1.3 Scope and Limitations of Study
Since the present study is confined to the Directory of Open Access Journals, as such its scope is confined to the journals listed in this directory during the period 2003-2012 spread across 120 countries. But the study is very important to development of a better understand-ing about the future prospectus of open access publish-ing.
While retrieving or mining data from the home web-site of the directory, and during its subsequent analysis,
no major limitation came to fore, which as a result or otherwise could have been put to argument for having made any substantial difference to the research find-ings or results. One minor limitation which was en-countered while retrieving data was inability to access journals under their respective subject headings, as the data retrieved under the said headings could have helped to generate some additional information and analysis.
2. REVIEW OF LITERATURE
Researchers believing in open access and pressing for the open access movement have already undertak-en a good number of studies in the field of opundertak-en access publishing. Wells (1999) in his study conducted on 387 journals in 1998, observed that on average 18 arti-cles are published by each open access journal annual-ly. Morris (2006) studied 1213 open access journals list-ed in the Directory of Open Access Journals (DOAJ) and found that on average 42 articles are annually pub-lished by each OA journal. Mukherjee and Mal (2011) in their study observed that nearly 155 publishers across India are publishing more than 307 journals in OA format. Björk et al. (2010) in their study observed that nearly 20% of peer reviewed articles published during the year 2008 were available in OA format.
In 1997 the U.S. National Library of Medicine (NLM) made its medical index to medical literature freely available to the public with the name PubMed (NIH, 1999) and observed tenfold growth in access and usage of medical literature, thereby refuting the argument in support of closed access format. The American Scien-tists Open Access Forum 1998 is just simply an out-come of the success of Medline (AMSCI, n.d.). Re-sear-chers have observed how the closed access publi-cation format actually acts as an impediment to the path of the free flow of information and its judicious exploitation. Laakso et al. (2011) studied open access journals published between 1993-2009 and observed that there is a growing trend towards open access pub-lishing both in terms of journals and the number of articles published in them. Without doubt one can argue that closed access publishing acts as an impedi-ment to making best use of research results, while on
the contrary open access has turned out a huge bless-ing in exploitation of information to its optimum.
The scientific community in 2001 put forth the argu-ment that freely available scientific proceedings are cited thrice over the printed articles (Metcalfe, 2005). Bluh (2006), and Mark and Shearer (2006) recom-mended that all scientific and scholarly literature be made available free of cost to the public through the Internet. Gunther Eysenbach (2006) in his work enti-tled “Citation advantages of open access journals” stud-ied 1492 articles of the Proceedings of the National Academy of Sciences, out of which 14.2% articles were OA and 85.8% non-OA at three different intervals of time, each having a gap of after their publication, ob-serving that compared to non-OA articles, OA articles are cited more. The author also observed that in April 2005 the citation rate for OA articles was 1.5 while for non-OA articles it was 1.2, which rose to 6.4 in Octo-ber 2005 for OA articles and 4.5 for non-OA articles.
In 2005, 16 Dutch universities came together to form the DAREnet Project. The project began with the launch of 47,000 research articles and the number grew beyond 185,000 by 2009 (Libbenga, 2005). Row-lands and Nicolas (2005) observed that there is a grow-ing trend towards OA publishgrow-ing as more and more authors are switching to OA publishing, and the num-ber has increased from 11% in 2004 to 29% in 2005. McCulloh (2006) also remarked that there is an im-mense transformation in scholarly communication with open access.
Arunachalam (2008), and Sahu and Parmar (2006) have advocated that there is a greater need for more and more research institutions and other organizations to get involved in OA publishing. In India, institutes like the Indian Academy of Science, Indian National Science Academy, MedIndia, and Medknow are ac-tively engaged in OA publishing. Crawford (2002) evaluated the data of the Association of Research Libraries and observed that nearly 85 scholarly refer-eed journals were published freely. Edgar and Willin-sky (2010) studied the Open Journal System (OJS) and observed that the majority of journals on the OJS plat-form are born open access and equally an overwhelm-ing number of closed access journals have switched over to open access, and 7% of them have even upload-ed back issues of the journals as well (Pearce, 2012).
The concepts of Green OA and Gold OA are very much prevalent; Green OA is about self-archiving work by authors mostly in the form of preprints of either accepted or published work. Works can be uploaded by authors on institutional repositories or their home pages, and the same can even be hosted on repositories like ArXiv, which covers diverse subject areas, and for subjects like Life Sciences or Biomedicine, the same can be hosted on PubMedCentral. In 2008, 11.9% of all scholarly articles published were made available under Green OA and 8.5% under Gold OA (Kaiser, 2010). 62% of the Gold OA is direct OA and 14% is delayed, and the authors paying for making their content freely available from the beginning are considered as hybrid OA, which constitutes nearly 24% content.
There are also some concerns which are being raised against open access publishing and the main argument which most of the time is put forth is the damage done to the peer-review process, which has totally decreased the quality of research articles. Critics of OA publish-ing are also of the view that closed access publications published through the conventional system play the gatekeeper role, which helps to maintain the scholarly reputation of the piece of work including tried and tested methods of reviewing, editing, and indexing which can be ensured only by applying economic aspects; and in its absence the same remains missing, which is argued to be mostly the case with OA articles. In 2009, a computer-generated hoax paper was accept-ed for publication by a reputaccept-ed publisher under the ‘author pays for publication’ mode (Gilbert, 2009). There are other instances which somewhat question the credibility of open access.
Other studies carried out in the field of OA publish-ing include Falk (2003), Lawrence (2001), Chan and Kirsop (2001), Deschamps (2003), and Ramachandran and Scaria (2004).
3. OPEN ACCESS: INDIAN SCENARIO
The OA publishing scenario in India has changed drastically over a period of time. This can be corrobo-rated from the fact that in 2002 not even a single OA journal was registered with DOAJ. But as per the July 31, 2013 statistics of DOAJ, India has grown to become
the largest OA journal publishing country in Asia and the fourth largest globally with as many 633 journals registered and hosted on the DOAJ website. This man-ifold growth of OA publishing in India is owed to the fact of the lead taken by some of the premier intuitions of India towards the promotion of OA publishing. As per Sahu and Parmaer (2006), the Indian Institute of Sciences in Bangalore was the first institution to set up an institutional repository. Some other premier insti-tutions which followed suit include IIM Kozhikode, ISI Bangalore, NIT Rourkela, NAL Bangalore, IIT Delhi, and INFLIBNET (Ghosh and Das, 2006).
In India the creation of ETD databases like Vid-hyanidi, Shodhganga, Dyuthi, Digital Repository of Cochin University of Science and Technology, Etheses-A Saurashtra University Library Service, Indian Ins-titute of Science, Library of the Indian InsIns-titute of Sci-ence (JRD Tata Memorial Library), and Mahatma Gand-hi University, whereby people can enjoy full access to research theses and dissertations without paying any-thing for the service, proved a blessing in this direc-tion. The trend can be seen as having grown to a larger extent as most of the universities across India have started hosting their individual ETDs on their respec-tive websites with access given to all. As per Ghosh and Das (2006), during the past decade India has launched many OA journals and the process was primarily initi-ated by publishers like the Indian Academy of Scien-ces, India Medlars Centre, Medknow Publications, In-dian National Science Academy, Kamla-Raj Enter-prises, and Indianjournals.com. With each passing day more and more institutions across the country have grown conscious of the advantages of OA publishing with the result that institutions which previously used to publish journals in closed format have switched over to OA format.
4. DATA ANALYSIS, DISCUSSION, & RESULTS
Since the dataset mined from its home website as per the objectives of our study was put to simple operations like addition, subtraction, drawings, and percentage by putting it into Microsoft Excel format, no advanced software was acquired for the purpose. The point per-centage of all the places has been drawn maximum upto two decimal places without rounding off figures. Distribution of countries at the continental level stands compared with figures retrieved from World Atlas at its website (http://www.worldatlas. com/).
4.1 Methodology
Keeping in view the objectives of the study, a good amount of literature review was undertaken on the open access publishing trend and the general scenario of OA publishing at the global level. A few studies per-taining to DOAJ were also reviewed in order to assess what has already been studied about the directory, and accordingly the dataset required for the analysis as per the objectives was retrieved from the home website of the directory accessible at (http://www.doaj.org/doaj). The dataset for the present study was retrieved on June 10, 2013 and was put to evaluation and analysis as per the defined objectives of research work. Data mined from the website was put into Excel format for execut-ing simple operations and analysis for better under-standing.
Table 1 is the depiction of the distribution of coun-tries involved with open access publishing at the global level. The above tabulation has been crafted to even give a wider picture about the number of countries actively engaged with OA publishing. Here 01 (one) represents the year wise growth of the number of countries of a particular continent and cumulative growth percentage, and 02 (two) represents the per-centage growth of countries from the subsequent year. Except for the continent Oceania, the rest of the conti-nents have shown steady growth both in the introduc-tion of new countries which embraced open access publishing, and in the subsequent growth from the previous year. Oceania remained confined to Australia and New Zealand only from the beginning, perhaps for the fact that they are the only two major countries of the continental area.
As per the data mined and analyzed, 120 countries are contributing to open access publishing across the globe. From Europe alone 43 countries are actively contributing to OA publishing, alone constituting 35.83% of geographical share, followed by Asia with 34 countries, Africa 17 countries, North America 14 countries, South America 10 counties and Oceania 02 countries.
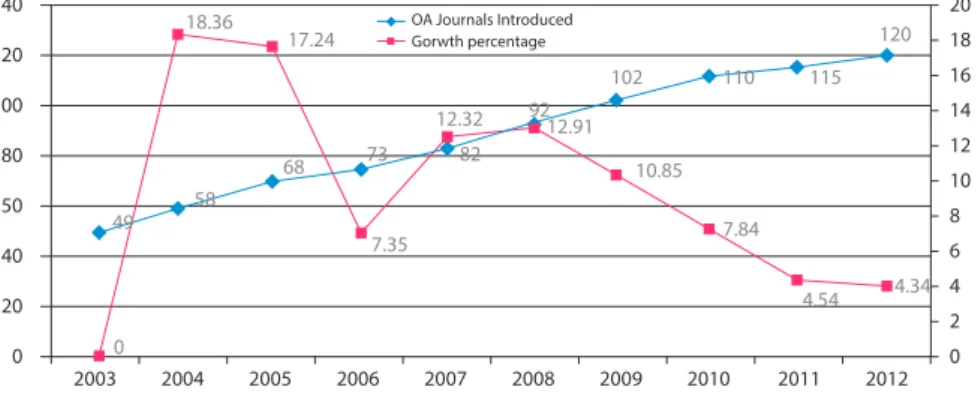
Fig. 1 Year Wise Growth of OA Publishing Countries
Table 1. Year Wise Growth of Countries Entering Open Access Publishing Both at Continental and Global Level 2003-12
Year 2003 Global Scenario GS2 -2004 18.36 17.24 07.35 12.32 12.91 10.86 07.84 04.54 04.34 GS1 49 (40.83) 58 (48.33) 68 (56.66) 73 (60.83) 82 (68.33) 92 (76.66) 102 (85.00) 110 (91.66) 115 (95.83) 120 (100) SA2 - 25.00 20.00 - 16.66 14.28 12.50 11.11 - -SA1 04 (40.00) 05 (50.00) 06 (60.00) 06 (60.00) 07 (70.00) 08 (80.00) 09 (90.00) 10 (100) 10 (100) 10 (100) 2005 2006 2007 2008 2009 2010 2011 2012
(Figures in the parenthesis indicate percentage)
・ AF represents Africa, AS → Asia, EU → Europe, NA → North America, OC → Oceania, SA → South America and GS → Global Scenario ・1 represents year wise growth of countries of a particular continent and cumulative growth percentage
・2 represents percentage growth of countries from subsequent year South America OC2 - - - -OC1 02 (100) 02 (100) 02 (100) 02 (100) 02 (100) 02 (100) 02 (100) 02 (100) 02 (100) 02 (100) Oceania NA2 - 66.66 40.00 28.57 - 25.00 16.66 - - -NA1 03 (21.42) 05 (35.71) 07 (50.00) 09 (50.00) 09 (50.00) 12 (85.71) 14 (100) 14 (100) 14 (100) 14 (100) North America EU2 - 16.00 03.44 06.66 06.25 08.82 08.10 - 02.50 04.87 EU1 25 (58.13) 29 (67.44) 30 (69.76) 32 (74.41) 34 (79.06) 37 (86.04) 40 (93.02) 40 (93.02) 41 (95.34) 43 (100) Europe AS2 - 18.18 46.15 46.15 05.26 10.00 13.63 24.00 06.45 03.03 AS1 11 (32.35) 13 (38.23) 19 (55.88) 19 (55.88) 20 (58.82) 22 (64.70) 25 (73.52) 31 (91.17) 33 (97.05) 34 (100) Asia AF2 - - - 25.00 100.00 10.00 09.09 08.33 15.38 13.33 AF1 04 (23.52) 04 (23.52) 04 (23.52) 05 (29.41) 10 (58.82) 11 (64.70) 12 (70.58) 13 (76.47) 15 (88.23) 17 (100) Africa C o n ti n en ta l D is tr ib u ti o n
On the whole the number of countries which enter-ed into OA publishing rose from 49 to 120 countries, a growth of 144% during the entire decade. Similarly at the continental level North America registered the maximum growth of 366% during the entire decade, followed by Africa with 325%, Asia 209%, South America 150%, Europe 72%, and Oceania 0%. To date more than 60% countries across the world have shown faith in OA publishing and are actively involved in OA publishing, and with the same growth rate the world will turn 100% OA, and for that it will take another five
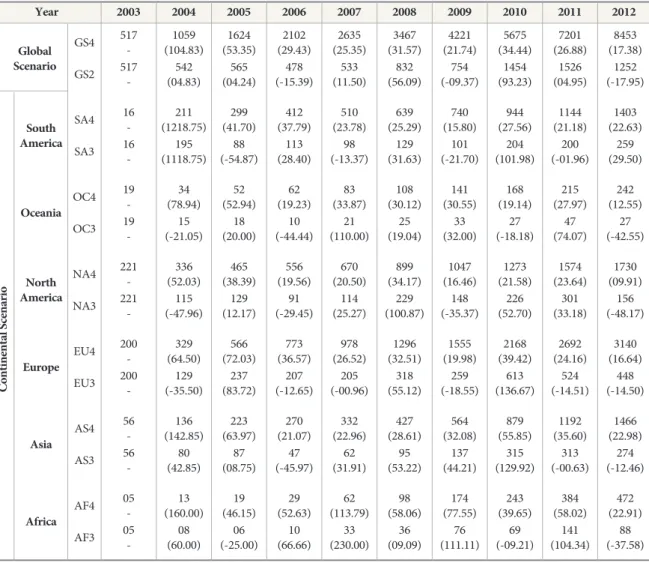
years for the remaining 40% countries to switch to OA. Table 2 has been drawn to give a wider, deeper, and broader picture of the data, revealing facts about the overall scenario of open access journals at the global level. In the above tabulation an attempt has been made to have a bit by bit analysis of the number of journals introduced during each year in each continent and the subsequent growth there of journals at both the continental and global level. Here 03 (three) repre-sents the number of journals introduced during a par-ticular year in a parpar-ticular continent and the
percent-Table 2 . Distribution of Open Access Journals at Continental Level (2003-12)
Year 2003 Global Scenario GS4 517 -2004 1059 (104.83) 1624 (53.35) 2102 (29.43) 2635 (25.35) 3467 (31.57) 4221 (21.74) 5675 (34.44) 7201 (26.88) 8453 (17.38) GS2 517 -542 (04.83) 565 (04.24) 478 (-15.39) 533 (11.50) 832 (56.09) 754 (-09.37) 1454 (93.23) 1526 (04.95) 1252 (-17.95) SA4 16 -211 (1218.75) 299 (41.70) 412 (37.79) 510 (23.78) 639 (25.29) 740 (15.80) 944 (27.56) 1144 (21.18) 1403 (22.63) SA3 16 -195 (1118.75) 88 (-54.87) 113 (28.40) 98 (-13.37) 129 (31.63) 101 (-21.70) 204 (101.98) 200 (-01.96) 259 (29.50) 2005 2006 2007 2008 2009 2010 2011 2012
(Figures in the parenthesis indicate percentage)
・ AF represents Africa, AS → Asia, EU → Europe, NA → North America, OC → Oceania, SA → South America and GS → Global Scenario ・ 3 represents number of journals introduced during a particular year in a particular continent and the percentage growth
・ 4 represents cumulative growth of countries and the percentage increase from the subsequent year South America OC4 19 -34 (78.94) 52 (52.94) 62 (19.23) 83 (33.87) 108 (30.12) 141 (30.55) 168 (19.14) 215 (27.97) 242 (12.55) OC3 19 -15 (-21.05) 18 (20.00) 10 (-44.44) 21 (110.00) 25 (19.04) 33 (32.00) 27 (-18.18) 47 (74.07) 27 (-42.55) Oceania NA4 221 -336 (52.03) 465 (38.39) 556 (19.56) 670 (20.50) 899 (34.17) 1047 (16.46) 1273 (21.58) 1574 (23.64) 1730 (09.91) NA3 221 -115 (-47.96) 129 (12.17) 91 (-29.45) 114 (25.27) 229 (100.87) 148 (-35.37) 226 (52.70) 301 (33.18) 156 (-48.17) North America EU4 200 -329 (64.50) 566 (72.03) 773 (36.57) 978 (26.52) 1296 (32.51) 1555 (19.98) 2168 (39.42) 2692 (24.16) 3140 (16.64) EU3 200 -129 (-35.50) 237 (83.72) 207 (-12.65) 205 (-00.96) 318 (55.12) 259 (-18.55) 613 (136.67) 524 (-14.51) 448 (-14.50) Europe AS4 56 -136 (142.85) 223 (63.97) 270 (21.07) 332 (22.96) 427 (28.61) 564 (32.08) 879 (55.85) 1192 (35.60) 1466 (22.98) AS3 56 -80 (42.85) 87 (08.75) 47 (-45.97) 62 (31.91) 95 (53.22) 137 (44.21) 315 (129.92) 313 (-00.63) 274 (-12.46) Asia AF4 05 -13 (160.00) 19 (46.15) 29 (52.63) 62 (113.79) 98 (58.06) 174 (77.55) 243 (39.65) 384 (58.02) 472 (22.91) AF3 05 -08 (60.00) 06 (-25.00) 10 (66.66) 33 (230.00) 36 (09.09) 76 (111.11) 69 (-09.21) 141 (104.34) 88 (-37.58) Africa C o n ti n en ta l S ce n a ri o
age growth, and 04 (four) represents the cumulative growth of the number of countries and the percentage increase from the subsequent year. All the continents have observed negative growth during a couple of years in the introduction of new OA journals when compared with the subsequent year during the entire decade.
Clubbing together the data of all the continents depicts the scenario of OA journals at a global level. At the global level we can see, except for during the years 2006, 2009, and 2012, that the introduction of new OA journals during the rest of the years has shown positive and steady growth which holds equally true about the overall cumulative growth of journals. On the whole during the entire decade 8453 OA journals stand recorded as hosted on the DOAJ website, an increase
of 1535% since 2003 when only 517 journals were hosted on the directory. At the continental level Africa has shown a maximum growth of 9340% in OA Jour-nals since 2003, followed by South America with a growth of 8668%, Asia 2517%, Europe 1470%, Oceania 1173%, and North America 682%.
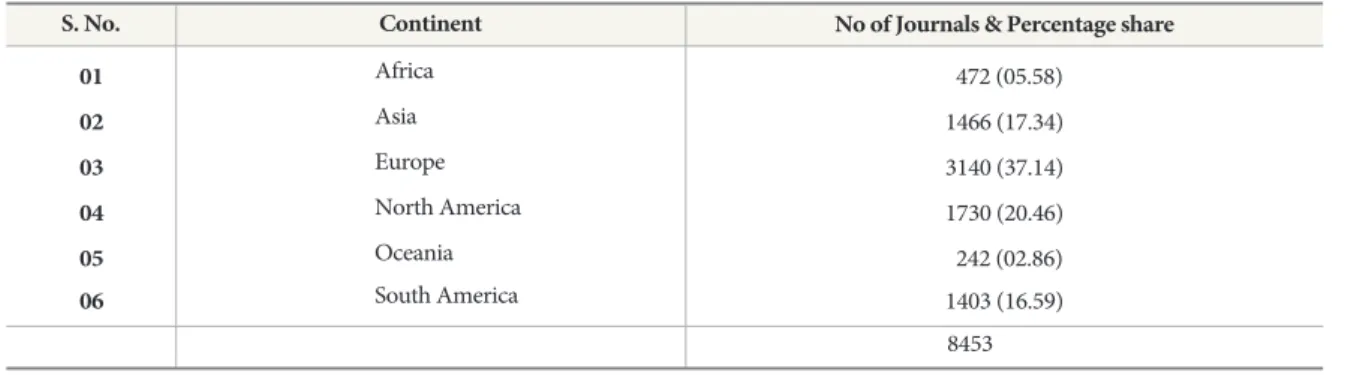
Table 3 represents the distribution of open access journals across six continents of the world and accord-ingly the pie has been drawn to give a graphical pre-sentation of the facts about the distribution of open access journals at the continental level. Europe emerges as the highest contributors of open access journals by publishing as many as 3140 journals, having a share percentage of 37.14%. Europe is followed by North America with a share percentage of 20.46%, Asia 17.34%, South America 16.59%, Africa 5.58%, and
Fig. 2 Percentage Share Distribution of Journals at Continental Level Table 3. Continental Distribution of Open Access Journals
(Figures in the parenthesis indicate percentage)
S. No. Continent No of Journals & Percentage share
01 472 (05.58) 02 1466 (17.34) 03 3140 (37.14) 04 1730 (20.46) 05 242 (02.86) Africa Asia Europe North America Oceania 06 1403 (16.59) 8453 South America
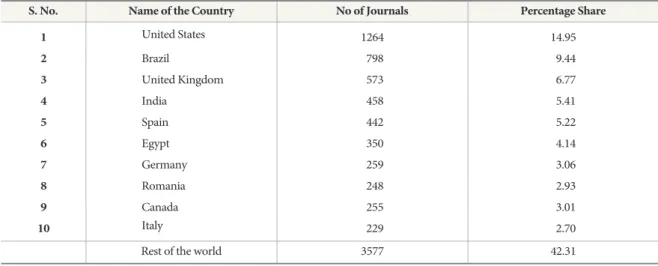
Oceania with 2.86 share percentages. At the continen-tal level countries publishing the maximum number of journals are Egypt from Africa with 350 journals, India from Asia with 450 journals, the U.K. from Europe with 573 journals, the U.S. from North America with 1264 journals, Australia from Oceania with 122 jour-nals, and Brazil from South America with 798 journals. The above tabulation is simply a depiction of the world’s top ten open access publishing countries. The United States emerged as the leading country having a maximum of 1264 OA journals to its credit with a share percentage of 14.95%. The U.S. is followed by Brazil with a contribution of 9.44% and the U.K with
6.77%. The interesting aspect which emerges from the above tabulation is that the world’s top ten countries contribute as much as nearly 58% of total open access journals and the remaining 110 countries contribute a mere 42% of OA Journals.
Table 5 is the depiction of the Indian scenario of open access publishing at the global level. In all during the last decade India emerged as the fourth largest open access publishing country at the global level and the largest at the continental level by publishing as many as 458 OA journals during the decade. During the entire decade, India almost observed a steady growth of introduction of new OA journals except for Fig. 3 Distribution of Top Ten Leading OA Publishing Countries
Table 4. World’s Top Ten Open Access Publishing Countries During the Period 2003-2012
S. No. Name of the Country
1 United States No of Journals 1264 Percentage Share 14.95 2 Brazil 798 9.44 3 United Kingdom 573 6.77 4 India 458 5.41 5 Spain 442 5.22 6 Egypt 350 4.14 7 Germany 259 3.06 8 Romania 248 2.93 9 Canada 255 3.01 10 Italy 229 2.70
during the years 2005 and 2011 when negative growth was observed. A maximum of 126 OA journals were introduced in the year 2010 with a percentage growth of 168.08% and a minimum 14 OA journals were introduced during the year 2005 and 2013 each.
In Table 6, 18 major subject areas featured on the DOAJ with various sub-disciplines have been ana-lyzed. To date 18 major subjects stand divided into 76 sub-disciplines having as many as 9007 journals in var-ious languages of the world with an average 118.51 journals to each single sub-discipline. Social sciences emerged as the major subject, having 10 sub-disci-plines with as many as 1898 journals. Social Sciences is followed by Technology and Engineering with 1103 journals, which in turn is followed by Health Sciences with 996 journals. General Works and Navel Science host a minimum of 01 journals each.
5. CONCLUSION
Open access publishing has more or less become the order of the day, as more and more countries have started believing in the concept of OA publishing and this gets corroborated by the fact that to date more than 120 countries are listed on DOAJ and are actively involved with OA publishing. The role of technology cannot be underestimated in the widespread open access movement, where information is freely available
to people. Technology in fact is the backbone of open access publishing and the recourse of OA publishing is bound to suffer in the absence of technology. Open Journal System software is being used widely all across the globe these days and has proved instrumental in the open access movement. More and more subjects are being introduced and exposed to OA publishing and highly technical and scientific literature is no exception to it.
The average annual growth in number of the newly introduced OA publishing countries is 14.40% and if the trend continues to be the same, then in the next five years the world will turn 100% open access. Open access has broken the myth of closed access, as people have started showing more faith in OA as the same has greater visibility, impact, and ultimately better usage of research results by the end user. OA publishing has helped budding scholars to publish their research results in better and q uicker form with a wider viewer-ship. OA publishing has helped researchers to value their research results by permitting better use by the end user, thereby fulfilling the ultimate aim and pur-pose of conducting research and making it public, which otherwise used to remain missing in closed for-mats, as the same information used to be available only on a payment basis.
OA has opened up new portals of knowledge where creation, collection, dissemination, and exploitation of knowledge has increased and been bettered in many Table 5. Distribution of Open Access Journals in India (2003-2012)
Year Cumulative growth
Number Percentage share Growth percentage Total Percentage share Growth percentage
2003 14 03.05 - 14 03.05 -03.49 16 14.28 30 06.55 114.28 03.05 14 -12.50 44 09.60 46.66 03.27 15 07.14 59 12.88 34.09 03.71 17 13.33 76 16.59 28.81 04.80 22 29.41 98 21.39 28.94 08.91 47 113.63 145 31.65 47.95 27.51 126 168.08 271 59.17 86.89 20.08 92 -26.98 363 79.25 33.94 20.74 95 03.26 458 100 26.17 2004 2005 2006 2007 2008 2009 2010 2011 2012 Journals introduced
ways. Citation and impact factors of OA journals have increased manifold. The concept of Hybrid OA access is prevalent these days as professional publishers have started publishing articles in hybrid format and host separate archives on their websites of OA articles. In all, OA is proving a blessing of its own kind, having no barriers at all, where the seeker of information gets directly connected to information.
REFERENCES
Archives of American-Scientist-Open-Access-Forum@ Listserver.Sigmaxi.Org. Amsci-forum.amsci.org. Retrieved from article=1048&context=fac_pubs Arunachalam, S. (2008). Open access in India: Hopes
and frustrations. Proceedings of the ELPUB 2008 Conference on Electronic Publishing, Toronto,
Canada, June 2008 (pp. 271-279).
Björk, B. C., Welling, P., Laakso, M., Majlender, P., Hedlund, T., & Guðnason, G. N. (2010). In E. Scalas (Ed.), Open access to the scientific journal literature: Situation 2009. PLoS ONE 5(6), e11273. doi:10.1371/journal.pone.0011273.
Bluh, P. (2006). Open access, legal publishing, and online repositories. Journal of Law, Medicine & Ethics, 34(1), 126-130. Retrieved from http://digi-talcommons.law.umaryland.edu/cgi/viewcontent. cgi?
Chan,L., & Kirsop, B. (2001). Open archiving opportu-nities for developing countries: Towards equitable distribution of global knowledge. Ariadne, 20. Retrieved from http:// www.ariadne.ac.un/issue30/ oai-chan
Crawford, W. (2002). Free electronic refereed journals: Getting past the arc of enthusiasm. Learned Publish-Table 6. Subject Wise Distribution of Journals
(Figures in the parenthesis indicate percentage)
S. No. Name of the Subject
01 Agriculture and Food Sciences
No of sub-Disciplines 06 500 (05.55) 02 03 04 05 06 07 08 09 10 11 12 13 14 15 16 17 18 No of Journals 500 (05.55) Cumulative Journals & Percentage 83.33
Arts and Architecture 06 254 (02.82) 754 (08.37) 42.33
Biology and Life Sciences 02 312 (03.49) 1066 (11.83) 156.00
Business and Economics 02 565 (06.27) 1631 (18.10) 282.50
Chemistry 05 187 (02.07) 1818 (20.18) 37.40
Earth and Environmental Sciences 08 653 (07.24) 2471 (27.65) 81.62
General Works 01 355 (03.94) 2826 (31.37) 355.00
Health Sciences 04 996 (11.05) 3822 (42.43) 249.00
History and Archeology 03 307 (03.40) 4129 (45.84) 102.33
Languages and Literatures 02 586 (06.50) 4715 (52.34) 293.00
Law and Political Sciences 02 395 (04.38) 5110 (56.73) 197.50
Mathematics and Statistics 02 312 (03.46) 5422 (60.19) 156.00
Navel Science 01 01 (00.01) 5423 (60.20) 01.00
Philosophy and Religion 02 309 (03.43) 5732 (63.63) 154.50
Physics and Astronomy 02 112 (01.24) 5844 (64.88) 56.00
Science General 02 162 (01.79) 6006 (66.68) 81.00
Social Sciences 10 1898 (21.07) 7904 (87.75) 189.80
Technology and Engineering 16 1103 (12.24) 9007 (100) 68.93
76 9007 118.51
Average Journals each discipline
ing, 15. doi:10.1087/09531510252848881
Deschamps, C. (2003). Round table: open access issues for developing countries. Information Services & Use, 23 (2/3), 149-59.
Directory of Open Access Journals. Retrieved from http://bibliotecnica.upc.es/rebiun/workshop5/pre-sentacions/17_doaj_jorgensen.pdf
Eysenbach, G. (2006). Citation advantages of open access articles. PLoS Biology, 4(5): e157. doi: 10.1371/journal.pbio.0040157. Retrieved from http://www.ncbi.nlm.nih.gov/pmc/articles/PMC 1459247
Ghosh, S. B., & Das, A. K. (2006). Open access and institutional repositories - A developing country perspective: A case study of India. Papers of 72nd IFLA General Conference and Council. Retrieved from http://www.ifla.org/IV/ifla72/papers/157-Ghosh_Das-en.pdf.
Gilbert, N. (2009). Editor will quit over hoax paper. Nature. doi:10.1038/news.2009.571. Retrieved from http://www.nature.com/news/2009/090615/ full/news.2009.571.html
Gul, S., Wani, Z. A., & Majeed, I. (2008). Open access journals: A global perspective. Trends in Information Management, 4(1), 1-2.
Harnad, S. (2007). Re: when did the Open Access movement ‘officially’ begin. American Scientist Open Access Forum. Retrieved from http://en. wikipedia.org/wiki/Open_access
Harnad, S., & Brody, T. (2004). Comparing the impact of open access (OA) vs. Non-OA articles in the same journals. D-Lib Magazine, 10(6). Retrieved from http://www.dlib.org/dlib/june
Howard, F. (2003). Journal publishing is ripe for change. Electronic Library, The, 21(2), 165-168. Kaiser, J. (2010). Free journals grow amid ongoing
debate. Science, 329. doi:10.1126/science.329.5994. 896
Laakso, M., Welling, P., Bukvova, H., Nyman, L., Björk, B. C., & Hedlund, T. (2011). In M. Hermes-Lima (Ed.), The development of open access jour-nal publishing from 1993 to 2009. PLoS ONE, 6(6): e20961. doi:10.1371/journal.pone.0020961. Lawrence, S. (2001). Online or invisible? Nature,
411(6837), 521. Retrieved from http://citeseer.ist. psu.edu/online-nature01/
Libbenga, J. (2005). Dutch academics declare research
free-for-all. The Register. Retrieved from http://www.theregister.co.uk/2005/05/11/open_ access_research/
Loan, F., Rather, R., & Shah, J. (2008). Indian contribu-tion to open access literature: A case study of DOAJ & OpenDOAR. Chinese Librarianship: an International Electronic Journal. Retrieved from http://www.white-clouds.com/iclc/cliej/cl26fayaz. pdf
Mark, T., & Shearer, K. (2006). Institutional reposito-ries: a review of content recruitment strategies. Paper presented at the World Library and Infor-mation Congress: 72ndIFLA General Conference
and Council, Seoul, Korea. Retrieved from http:// www.ifla.org/IV/ifla72/papers/155-Mark_Shearer-en.pdf
McCulloch, E. (2006). Taking stock of open access: Progress and Issues. Library Review, 55(6). Retriev-ed from http://dx.doi.org/10.1108/002425306106 74749
Metcalfe, T. S. (2005). The rise and citation impact of astro-ph in major journals. Bulletin of the American Astronomical Society, 37, 555-7. Retriev-ed from http://arxiv.org/pdf/astro-ph/0503519.pdf Morris, S. (2006). Personal view: When is a journal not
a journal – A closer look at the DOAJ. Learned Publishing, 19. doi:10.1087/095315106775122565 Mukherjee, B., & Mal, B.K. (2011). India’s efforts in
open access publishing. Library Philosophy and Practice.
Pearce, J. M. (2012). The case for open source appro-priate technology. Environment, Development and Sustainability, 14(3), 425–431. doi:10.1007/s10668-012-9337-9
Poynder, R. (2004). Poynder on point: Ten years after. Information Today, 21(9). Retrieved from http://www.infotoday.com/it/oct04/poynder.shtml PubMed Central: An NIH-Operated site for electronic
distribution of Life Sciences research reports. NIH (1999). Retrieved from http://www.nih.gov/about/ director/pubmedcentral/pubmedcentral.htm Ramachandran, P.V., & Scaria, V. (2004). Open access
publishing in the developing world: making a dif-ference. Journal of Orthopaedics, 1(1). Retrieved from http:// www.jortho.org/2004/1/1/e1/index. htm
commu-nication in the digital environment: The 2005 sur-vey of journal author behavior and attitudes. Aslib Proceedings, 57 (6). Retrieved from http://www. emeraldinsight.com/10.1108/00012530510634226 Sahu, D. K., & Parmar, R. C. (2006). Open access in
India. Open Access: Key strategic, technical and eco-nomic aspects. Retrieved from http://openmed. nic.in/1599/01/Open_Access_in_India.pdf. Sahu, D.K., & Parmar, R. (2006). The position around
the world: Open access in India. In N. Jacobs (Ed.), Open access: Key strategic, technical, and economic aspects (pp. 26-32). Oxford: Chandos Publishing. Solomon, D.J., & Bo‐Christer, B. Publishing fee in
open access journals: Source of Funding and Factors Influencing Choice of Journal. Retrieved from http://www.openaccesspublishing.org/ apc/preprint.pdf
Suber, P. (2003). How should we define open access? SPARC Open Access Newsletter, 64. Retrieved from http://www.earlham.edu/peters/fos/newslet-ter/08-04-03.htm
Vierkant, P. (2012). Visualizing open access; Global distribution of open access items. Retrieved from http://edoc.hu-berlin.de/libreas/21/vierkant-paul-54/PDF/vierkant.pdf
Wells, A. (1999). Exploring the development of the independent, electronic, scholarly journal. M.Sc. Thesis, University of Sheffield. Retrieved from http://panizzi.shef.ac.uk/elecdiss/edl0001/index. html.
Worlock, K. (2004). The Pros and Cons of Open Acce-ss. Nature Focus. Retrieved from http://www. nature.com/nature/focus/accessdebate/34.html