Copyright © The Institute of Positioning, Navigation, and Timing http://www.ipnt.or.kr Print ISSN: 2288-8187 Online ISSN: 2289-0866
1. INTRODUCTION
Precise vehicle localization is essential for safe driving for autonomous vehicles. In general, position of autonomous driving vehicles is obtained through the global positioning system (GPS). However, GPS signals cannot be received in tunnels. Localization at a road section of short distance can be estimated through dead reckoning (DR) method.
However, as the driving distance becomes longer, the position error becomes larger due to the accumulation of
3D LIDAR Based Vehicle Localization Using Synthetic Reflectivity Map for Road and Wall in Tunnel
Jun-Hyuck Im
1, Sung-Hyuck Im
2, Jong-Hwa Song
3, Gyu-In Jee
1†1
Department of Electronics Engineering, Konkuk University, Seoul 05029, Korea
2
Satellite Navigation Team, Korea Aerospace Research Institute, Daejeon 34133, Korea
3
AESA Radar R&D Center, Hanwha Systems, Yongin 17121, Korea
ABSTRACT
The position of autonomous driving vehicle is basically acquired through the global positioning system (GPS). However, GPS signals cannot be received in tunnels. Due to this limitation, localization of autonomous driving vehicles can be made through sensors mounted on them. In particular, a 3D Light Detection and Ranging (LIDAR) system is used for longitudinal position error correction. Few feature points and structures that can be used for localization of vehicles are available in tunnels. Since lanes in the road are normally marked by solid line, it cannot be used to recognize a longitudinal position. In addition, only a small number of structures that are separated from the tunnel walls such as sign boards or jet fans are available. Thus, it is necessary to extract usable information from tunnels to recognize a longitudinal position. In this paper, fire hydrants and evacuation guide lights attached at both sides of tunnel walls were used to recognize a longitudinal position. These structures have highly distinctive reflectivity from the surrounding walls, which can be distinguished using LIDAR reflectivity data.
Furthermore, reflectivity information of tunnel walls was fused with the road surface reflectivity map to generate a synthetic reflectivity map. When the synthetic reflectivity map was used, localization of vehicles was able through correlation matching with the local maps generated from the current LIDAR data. The experiments were conducted at an expressway including Maseong Tunnel (approximately 1.5 km long). The experiment results showed that the root mean square (RMS) position errors in lateral and longitudinal directions were 0.19 m and 0.35 m, respectively, exhibiting precise localization accuracy.
Keywords: tunnel, vehicle localization, 3D LIDAR, synthetic reflectivity map
error. In this regard, the accumulated position error of DR needs to be corrected using a variety of sensors used in autonomous driving vehicles. When cameras are used, a lateral position error in tunnels can be corrected using lane detection. However, a longitudinal position error is difficult to be corrected as only few feature points can be extracted from tunnels. On the contrary, Light Detection and Ranging (LIDAR) system can measure a distance to a structure separated from the tunnel walls such as signboards or jet fans accurately, and it is much more effective at longitudinal position error correction than using cameras. Moreover, feature points of lanes and walls can be extracted using the LIDAR reflectivity information. Thus, this study conducted vehicle localization inside a tunnel using three-dimensional (3D) LIDAR.
Received Aug 17, 2017 Revised Aug 28, 2017 Accepted Oct 18, 2017
†
Corresponding Author E-mail: [email protected]
Tel: +82-2-450-3070 Fax: +82-2-3437-5235
Localization inside a tunnel requires detection of structures that are separated from the tunnel wall basically.
However, few structures are found in a tunnel and detection of structures using LIDAR distance information is difficult.
Thus, this study used LIDAR reflectivity information for vehicle localization. Normally, fire hydrants and evacuation guide lights are installed in both sides of the tunnel wall in every certain distance. The reflectivity characteristic of these structures is very different from that of surrounding walls. Using this characteristic, a reflectivity map of walls at the same height with that of this structure can be created to perform correlation matching. This is similar to the localization technique using a road surface reflectivity map in the study of Levinson et al. (2007, 2010). When a road surface reflectivity map is used, accurate positioning can be achieved in a general road where road line is marked with a dashed line. The reflectivity information of tunnel walls can be fused in the same manner used in the existing road surface reflectivity map. When such fused synthetic reflectivity map is used, localization can be done consecutively in general road and tunnel via single correlation matching for road surface and tunnel wall. In this study, accumulative position error of DR was corrected through correlation matching using 3D LIDAR. The experiments were conducted at an expressway including Maseong Tunnel (approximately 1.5 km long) and the driving speed was approximately 90 km/h. For the reference vehicle location, post-processing results of RTK/INS (NovAtel SPAN System, using the RINEX data in the continuously operating reference station in Suwon, baseline length: approximately 12 km) were used. From this, localization performance was analyzed.
The present paper is organized as follows: In Section 2, studies related to localization inside tunnels are described;
in Section 3, a method to create a synthetic reflectivity map is presented; in Section 4, the configuration of the localization system is explained; in Section 5, localization results are analyzed; and lastly, in Section 6, conclusions are presented.
2. STUDIES RELATED TO LOCALIZATION INSIDE TUNNELS
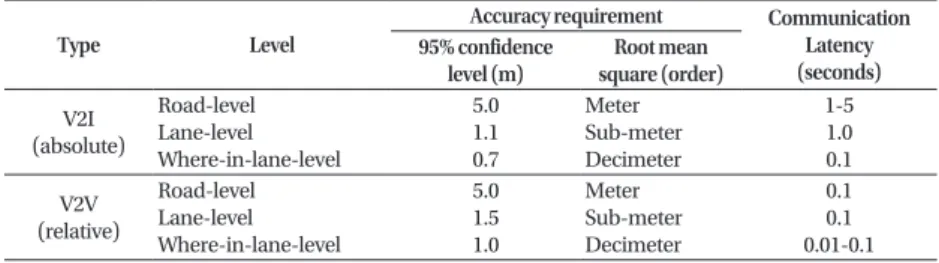
Table 1 presents the requirements of localization accuracy for autonomous driving (Ballingall 2013). The lateral localization accuracy within 70 cm is required at the confidence level of 95% when the map is used (V2I) as specified in Table 1. The accuracy refers to a root mean square (RMS) position error within approximately 35 cm.
The requirements of the lateral localization accuracy are not yet officially documented. However, the accuracy requires a RMS position error within approximately 50 cm. Generally, autonomous driving vehicles are operated in environments where GPS signals can be received. In an open space, the position accuracy within a few tens of centimeters can be achieved using a precision positioning technique through the GPS such as Real Time Kinematic (RTK). However, GPS signals cannot be received in tunnels and the requirements of localization accuracy should be satisfied using only sensors mounted on vehicles.
The LIDAR system has been widely used for localization in tunnels. A study by Duff et al. (2003) used 2D LIDAR for localization in mines. However, 2D LIDAR at that time was mainly used for the purpose of prevention of collision by recognizing a distance between vehicle and both sides of the tunnel wall rather than using the concept of localization.
Since then, 3D LIDAR systems mountable to vehicles have been developed and LIDAR has been widely utilized as a core sensor for the localization of mobile vehicles. Tardioli
& Villarroel (2014) published a paper about localization at a tunnel-like environment. In their study, a robot's position was estimated by extracting walls using 2D LIDAR mounted horizontally to a robot in the corridor inside the building.
If a robot moved in the corridor in parallel with the wall, a longitudinal position cannot be estimated using the extracted wall information. To overcome this, their study used the distance from the wall through zig-zag moving of a robot to enable a longitudinal position estimation. If the odometer information of the robot was additionally used, both of lateral and longitudinal position errors were able to Table 1. Localization accuracy requirement for autonomous driving.
Type Level
Accuracy requirement Communication Latency (seconds) 95% confidence
level (m) Root mean square (order) V2I
(absolute)
Road-level Lane-level Where-in-lane-level
5.0 1.1 0.7
Meter Sub-meter Decimeter
1-5 1.0 0.1 V2V
(relative)
Road-level Lane-level Where-in-lane-level
5.0 1.5 1.0
Meter Sub-meter Decimeter
0.1 0.1 0.01-0.1
*Austroads Research Report (2013), Vehicle Positioning for C-ITS in Australia (Background document)
http://www.ipnt.or.kr be reduced. However, since vehicles cannot move in zig-
zags in a tunnel, this method cannot be applied to real road tunnels.
Larson et al. (2014) studied robot localization at the cylindrical drain pipe. Their study rotated 2D LIDAR for the use of 3D LIDAR thereby performing Iterative Closest Point (ICP) scan matching. They also used visual odometry using stereo cameras. In their study, no quantitative values about localization results were presented, but only the position error up to 90 cm during 900 m movement occurred in unofficial tests was mentioned. More recently, a study on autonomous flight using a drone at a hydraulic pipe was published (Ozaslan et al. 2017). In the study, localization of drone mounted with 3D LIDAR was conducted in a hydraulic pipe, which was similar to a tunnel environment.
The normal distribution transform (NDT) scan matching technique based on a point cloud was used for localization.
The localization result showed that a position error in lateral and height directions was less than approximately 5% of 5.5 m diameter hydraulic pipe, and the longitudinal position error was not considered. As presented in the previous two papers, ICP or NDT scan matching techniques using LIDAR distance information show poor performance in longitudinal matching in tunnels. Thus, they are not applicable to actual road tunnels.
Daoust et al. (2016) published a paper about localization at tunnels where subway trains were operated. In their study, a global map was created by accumulating point clouds over the entire test section after collecting data through 2D LIDAR mounted in front of the subway train.
Later, local maps were created in every update cycle of LIDAR data thereby performing point cloud matching with the created global map. Furthermore, since subway trains run over the railway, only longitudinal positions were considered. In the tunnel where the test was conducted, signal light posts were installed in every certain distance for safe operation of subway trains. These posts were distinguishable from surrounding structures and by using these, it was possible to correct the longitudinal position error. The localization result showed that a position error of up to 1.8 m occurred in the tunnel section. However, these posts are not present in road tunnels where vehicles pass through.
As described above, studies on localization using LIDAR in tunnels have been conducted and published previously, but all of them used LIDAR distance information. On the contrary, few studies have been conducted on localization at road tunnels where vehicles run. When only the LIDAR distance information is used in road tunnels, localization accuracy and reliability are poor because only few
structures other than tunnel walls are available. However, as mentioned in Section 1, since structures of which reflectivity is different from each other are installed on road tunnel walls at every certain distance, vehicle localization can be done using these structures. Currently, no other studies have been found on vehicle localization inside tunnels using LIDAR reflectivity information.
3. CREATION OF SYNTHETIC REFLECTIVITY MAP
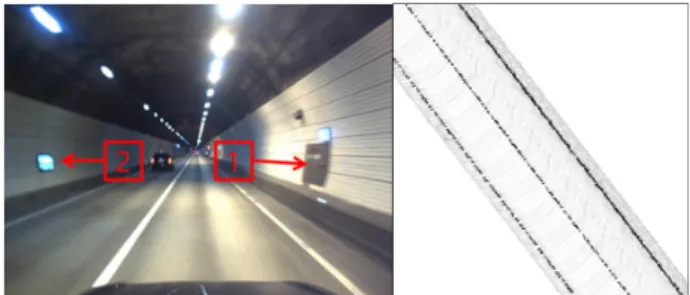
Fig. 1 shows the camera image inside the tunnel and the road reflectivity map of the section seen through the image.
As shown in the camera image in Fig. 1, no significant structures separated from the wall are present inside the tunnel. Also, no special features are displayed in the road reflectivity map in the same section for longitudinal position estimation. However, a fire hydrant as marked with No. 1 in Fig. 1 and evacuation guide light as marked with No. 2 are installed at every certain distance. These safety facilities have a highly different reflectivity characteristic than that of surrounding walls. In the present study, Velodyne HDL- 32E 3D LIDAR sensor was used. Fig. 2 shows the mounting location of 3D LIDAR. Figs. 3 and 4 depict the LIDAR Fig. 1. Camera image (left) and road reflectivity map (right) in tunnel.
Fig. 2. Camera image (left) and road reflectivity map (right) in tunnel.
https://doi.org/10.11003/JPNT.2017.6.4.159
reflectivity data of fire hydrant and evacuation guide light, respectively.
As shown in Figs. 3 and 4, the LIDAR reflectivities of hydrant and evacuation guide light show clear difference from that of the surrounding wall. Using this difference in reflectivity, longitudinal position errors of vehicles can be corrected. Here, a map with the same form of the road reflectivity map in Fig. 1 can be created using the reflectivity information as shown in Figs. 3 and 4. Furthermore, a synthetic reflectivity map that is present at a single 2D plane can be created by projecting the reflectivity map of the vertical wall to the road plane. Fig. 5 explains the creation principle of the synthetic reflectivity map.
As shown in Fig. 5, a certain height over the hydrant and evacuation guide light is removed from the vertical cross- section of the tunnel. After this, as shown in the planar figure of three-dimensional figure, reflectivity data of the wall are projected to both sides of the road reflectivity map plane. A synthetic reflectivity map is created as shown in the lower left end of the Fig. 5 through this process. Fig. 6 shows the synthetic reflectivity map created through this process.
As shown in Fig. 6, the areas where (1) fire hydrant and (2)
evacuation guide light are located are clearly distinguished from surrounding walls in the map. Using the synthetic reflectivity map, vehicle localization can be done through a single correlation matching even in a tunnel.
4. DESIGN OF LOCALIZATION SYSTEM
In this study, the correlation matching result with the synthetic reflectivity map is used as a measurement in the extended Kalman Filter (EKF). The EKF is designed as follows:
4.1 Time Update
Time update uses the output value of GPS/DR. For the GPS/DR sensor, CruizCore DS6200 from Microinfinity was used, and the azimuth accuracy was within 5° in open space. The state variable of the filter can be expressed as presented in Eq. (1).
,
Tq x y (1) where x and y refer to 2D horizontal position error of vehicle in the ENU coordinate system.
The state equation is presented in Eq. (2).
ˆ
11 0 0 1
k K k
k
q F q
F
(2)
As presented in Eq. (2), no change in the error of GPS/DR for a short period of time was assumed.
4.2 Measurement Update
The measurement equation is presented in Eq. (3).
1 0 0 1
k k k
k
z x H q
y H
(3)
where x and y refer to the result values of correlation matching. The measurement update is conducted as presented in Eq. (4).
ˆ
k k(
k k)
q q K z H q (4) where K refers to the Kalman gain.
5. LOCALIZATION RESULT AND ANALYSIS
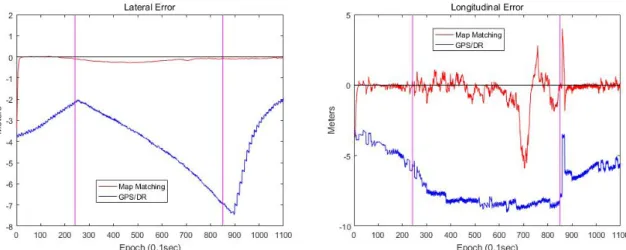
Fig. 7 shows the experimental section. As shown in Fig. 7, the experiment was conducted at approximately 3 km-long section (red line) including Maseong Tunnel on Yeongdong Expressway, and data obtained from 4pm to 6pm during weekdays when traffic volumes were large were used. The RTK/INS post-processing results provided by the NovAtel SPAN system were used as the reference trajectory of the driving vehicle. The vehicle ran the same section twice. Then, a synthetic reflectivity map was created using the first driving data, and vehicle localization was performed using the second driving data. However, the RTK/INS post-processing results had a slight position error in a tunnel. Fig. 8 shows the overlap of the maps created using data at two different times around the RTK/INS location.
Fig. 8a shows the outside section of the tunnel while Fig. 8b and 8c show the inside section of the tunnel. In Fig. 8a, two maps at two different times are exactly overlapped as the road lines were matched.
This match indicates that the RTK/INS post-processing results are very accurate. However, as shown in Fig. 8b, some road lines are not exactly matched. Approximately 20 cm of error in the lateral direction of
(1) where δx and δy refer to 2D horizontal position error of vehicle in the ENU coordinate system. The state equation is presented in Eq. (2).
,
Tq x y (1) where x and y refer to 2D horizontal position error of vehicle in the ENU coordinate system.
The state equation is presented in Eq. (2).
ˆ
11 0 0 1
k K k
k
q F q
F
(2)
As presented in Eq. (2), no change in the error of GPS/DR for a short period of time was assumed.
4.2 Measurement Update
The measurement equation is presented in Eq. (3).
1 0 0 1
k k k
k
z x H q
y H
(3)
where x and y refer to the result values of correlation matching. The measurement update is conducted as presented in Eq. (4).
ˆ
k k(
k k)
q q K z H q (4) where K refers to the Kalman gain.
5. LOCALIZATION RESULT AND ANALYSIS
Fig. 7 shows the experimental section. As shown in Fig. 7, the experiment was conducted at approximately 3 km-long section (red line) including Maseong Tunnel on Yeongdong Expressway, and data obtained from 4pm to 6pm during weekdays when traffic volumes were large were used. The RTK/INS post-processing results provided by the NovAtel SPAN system were used as the reference trajectory of the driving vehicle. The vehicle ran the same section twice. Then, a synthetic reflectivity map was created using the first driving data, and vehicle localization was performed using the second driving data. However, the RTK/INS post-processing results had a slight position error in a tunnel. Fig. 8 shows the overlap of the maps created using data at two different times around the RTK/INS location.
Fig. 8a shows the outside section of the tunnel while Fig. 8b and 8c show the inside section of the tunnel. In Fig. 8a, two maps at two different times are exactly overlapped as the road lines were matched.
This match indicates that the RTK/INS post-processing results are very accurate. However, as shown in (2)
As presented in Eq. (2), no change in the error of GPS/DR Fig. 3. Reflectivity image for fire hydrant in tunnel.
Fig. 6. Generated synthetic reflectivity map.
Fig. 4. Reflectivity image for evacuation guidance light in tunnel.
Fig. 5. The principle of generating synthetic reflectivity map.
http://www.ipnt.or.kr for a short period of time was assumed.
4.2 Measurement Update
The measurement equation is presented in Eq. (3).
,
Tq x y (1) where x and y refer to 2D horizontal position error of vehicle in the ENU coordinate system.
The state equation is presented in Eq. (2).
ˆ
11 0 0 1
k K k
k
q F q
F
(2)
As presented in Eq. (2), no change in the error of GPS/DR for a short period of time was assumed.
4.2 Measurement Update
The measurement equation is presented in Eq. (3).
1 0 0 1
k k k
k
z x H q
y H
(3)
where x and y refer to the result values of correlation matching. The measurement update is conducted as presented in Eq. (4).
ˆ
k k(
k k)
q q K z H q (4) where K refers to the Kalman gain.
5. LOCALIZATION RESULT AND ANALYSIS
Fig. 7 shows the experimental section. As shown in Fig. 7, the experiment was conducted at approximately 3 km-long section (red line) including Maseong Tunnel on Yeongdong Expressway, and data obtained from 4pm to 6pm during weekdays when traffic volumes were large were used. The RTK/INS post-processing results provided by the NovAtel SPAN system were used as the reference trajectory of the driving vehicle. The vehicle ran the same section twice. Then, a synthetic reflectivity map was created using the first driving data, and vehicle localization was performed using the second driving data. However, the RTK/INS post-processing results had a slight position error in a tunnel. Fig. 8 shows the overlap of the maps created using data at two different times around the RTK/INS location.
Fig. 8a shows the outside section of the tunnel while Fig. 8b and 8c show the inside section of the tunnel. In Fig. 8a, two maps at two different times are exactly overlapped as the road lines were matched.
This match indicates that the RTK/INS post-processing results are very accurate. However, as shown in Fig. 8b, some road lines are not exactly matched. Approximately 20 cm of error in the lateral direction of vehicle driving trajectory occurred considering that the grid size of the map used in this study was 10 cm.
(3) where Δx and Δy refer to the result values of correlation matching. The measurement update is conducted as presented in Eq. (4).
,
Tq x y (1) where x and y refer to 2D horizontal position error of vehicle in the ENU coordinate system.
The state equation is presented in Eq. (2).
ˆ
11 0 0 1
k K k
k
q F q
F
(2)
As presented in Eq. (2), no change in the error of GPS/DR for a short period of time was assumed.
4.2 Measurement Update
The measurement equation is presented in Eq. (3).
1 0 0 1
k k k
k