http://dx.doi.org/10.14316/pmp.2015.26.3.119
This work was supported by the Radiation Technology R&D program (No. 2013M2A2A7043498) and the Mid-career Researcher Program (2014R1A2A1A10050270) through the National Research Foundation of Korea funded by the Ministry of Science, ICT&Future Planning and Development of the core technology for integrated therapy devices based on real-time MRI guided tumor tracking, Information and Com- munication Technologies (ICT) & Future Planning (MSIP) (Grant No.
2009-00420).
Received 30 July 2015, Revised 28 August 2015, Accepted 7 September 2015
Correspondence: Tae Suk Suh ([email protected]) Tel: 82-2-2258-7232, Fax: 82-2-2258-7506 cc This is an Open-Access article distributed under the terms of the Creative Commons Attribution Non-Commercial License (http://creativecommons.org/licenses/by-nc/4.0) which permits unrestricted non-commercial use, distribution, and reproduction in any medium, provided the original work is properly cited.
Study of Motion-induced Dose Error Caused by Irregular Tumor Motion in Helical Tomotherapy
Min-Seok Cho*
†, Tae-Ho Kim*
†, Seong-Hee Kang*
†, Dong-Su Kim*
†, Kyeong-Hyeon Kim*
†, Geum Seong Cheon*
†, Tae Suk Suh*
†*Department of Biomedical Engineering, and
†Research Institute of Biomedical Engineering, College of Medicine, The Catholic University of Korea, Seoul, Korea
The purpose of this study is to analyze motion-induced dose error generated by each tumor motion parameters of irregular tumor motion in helical tomotherapy. To understand the effect of the irregular tumor motion, a simple analytical model was simulated. Moving cases that has tumor motion were divided into a slightly irregular tumor motion case, a large irregular tumor motion case and a patient case. The slightly irregular tumor motion case was simulated with a variability of 10% in the tumor motion parameters of amplitude (amplitude case), period (period case), and baseline (baseline case), while the large irregular tumor motion case was simulated with a variability of 40%. In the phase case, the initial phase of the tumor motion was divided into end inhale, mid exhale, end exhale, and mid inhale; the simulated dose profiles for each case were compared. The patient case was also investigated to verify the motion-induced dose error in ‘clinical-like’ conditions. According to the simulation process, the dose profile was calculated. The moving case was compared with the static case that has no tumor motion. In the amplitude, period, baseline cases, the results show that the motion-induced dose error in the large irregular tumor motion case was larger than that in the slightly irregular tumor motion case or regular tumor motion case. Because the offset effect was inversely proportion to irregularity of tumor motion, offset effect was smaller in the large irregular tumor motion case than the slightly irregular tumor motion case or regular tumor motion case. In the phase case, the larger dose discrepancy was observed in the irregular tumor motion case than regular tumor motion case. A larger motion-induced dose error was also observed in the patient case than in the regular tumor motion case. This study analyzed motion-induced dose error as a function of each tumor motion parameters of irregular tumor motion during helical tomotherapy. The analysis showed that variability control of irregular tumor motion is important. We believe that the variability of irregular tumor motion can be reduced by using abdominal compression and respiratory training.
Key Words: Motion-induced dose error, Tumor motion, Helical tomotherapy
Introduction
Tumor motion caused by respiration produces motion-induced
dose errors in radiation therapy.
1-3)The motion-induced dose er-
ror presents additional complications in helical tomotherapy, as
the tumor motion interacts with the couch motion.
4,5)Owing to
the tumor motion, the treatment field does not reach the tumor
region constantly, and repeatedly shifts in and out of the tumor
area.
6,7)This effect prevents the delivery of the planned dose to
the tumor region.
8,9)Typically, gating or tracking techniques are
used to solve this problem in LINAC or cyberknife.
10-12)However,
the use of such techniques is limited in helical tomotherapy, as
the gantry and couch continuously move during the treatment.
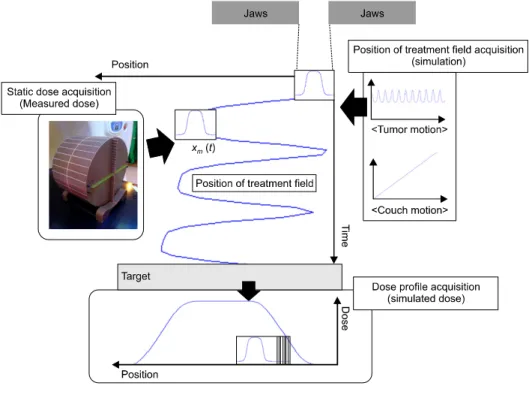
Fig. 1. Schematic of acquiring the dose profile.
Many previous studies have focused on this issue.
Dose profiles according to the changes of the field widths and gantry rotation periods have been reported.
5)As a result of this study, 5 cm of field width exhibited better gamma passing rates than 1 cm and 2.5 cm widths in the gamma comparisons with 2% dose discrepancy and 2 mm distance-to-agreement. In a different study focused on couch motion,
7)the couch motion was varied within a range of values, and the effects on the dose profiles were assessed. Furthermore, different dose pro- files in relation to the initial phase of the tumor motion have been shown.
6)Many studies related to this issue have used
‘regular’ and ‘sinusoidal’ waveforms to represent the tumor motion, and these limitations have been shown to be signi- ficant. However, in reality, the tumor motion has an ‘irregular’
waveform. Therefore, the aim of this study is to analyze mo- tion-induced dose error generated by tumor motion parameters of irregular tumor motion in helical tomotherapy.
Materials and Methods
1. Theory to acquire the dose profile
To understand the effects of the irregular tumor motion of a target, a simple one-dimensional model was simulated (Fig. 1).
The target was modeled as a rigid line. The treatment field (W), which is blocked by two jaws, represented the treatment field exposed in helical tomotherapy. We denoted the positions of the treatment field caused by the couch motion and tumor motion as ‘
’ and ‘
’, respectively. A more detailed ex- planation is presented in the following section.
1) Tumor coordinate system: In this study, a tumor co- ordinate system was used to explain the acquisition process of the dose profile and analyze the motion-induced dose errors.
4)The tumor coordinate system is different from the room coor- dinate system normally used. The treatment room is the stand- ard in the room coordinate system; therefore, the target is moved by the tumor motion, and the couch is moved in the superior-inferior (SI) direction with constant velocity (Fig. 2a).
Conversely, as the tumor is the standard in the tumor coor- dinate system (Fig. 2b), the target dose does not move while the treatment field undergoes a complex motion.
2) Static dose acquisition: To produce the dose profiles (Fig. 1), a static dose was acquired by using a Hi-Art tomo- therapy unit (TomoTherapy, Inc., Madison, WI, USA). The to- motherapy had a ‘static mode’ that prevented the movement of gantry and couch during the beam exposure. A cylindrical
‘cheese’ phantom (TomoTherapy, Inc., Madison, WI, USA;
Fig. 2. Position versus time curve of the treatment field in the (a) room coordinate system and (b) tumor coordinate system.
Table 1. Experimental conditions used to acquire the static dose.
Part Parameters Experimental
condition Gantry Source to axis distance (SAD) 85 cm
Beam delivery mode Static mode
Beam energy 6 MV
Treatment field width 2.5 cm Angle of exposed beam 90
oPhantom Type of phantom Cheese phantom
Centered point Isocenter
Film Type of film Gafchromic EBT2
Expiration date June 2015
Lot number 06241301
length: 18 cm, diameter: 30 cm) was used to acquire the static dose in the ‘patient-like’ condition. The cheese phantom was placed in the isocenter of the tomotherapy. A Gafchromic EBT2
TMfilm (Ashland Inc., Covington KY) was inserted in the cheese phantom and was exposed by static mode of tomo- therapy. More details on the conditions used in the measuring process are given in Table 1. The film was kept for 24 h at controlled pressure and humidity prior to scan. A VXR Dosi- metry PRO Advantage (RED) Film Digitizer (Vidar Systems Corporation, Hendon, Virginia) device and VIDAR TWAIN version 5.2 software (Vidar Systems Corporation, Hendon, Virginia) were used to scan the film image. The resolution of the scanner was 71 dots per inch (DPI), and the scanned range was 14×17 inches. All the scanned images were calibrated by a film calibration curve determined by using films exposed to the known doses of 74.64, 148.14, 222.21, 295.71, 369.2, 442.7, 516.2, 589.12, and 662.62 cGy. The American Associa- tion of Physicists in Medicine (AAPM) Task Group report No.
69 report and many related papers were considered during the film measurement.
13-15)SI direction curves of the calibrated im- age were collected, and a curve at the isocenter was selected
to determine the ‘static dose’ (
). ImageJ v1.48 (US National Institutes of Health) and Matlab (version R2012b, Mathworks, Natick, MA, USA) softwares were used in the process of cali- bration and acquiring static dose.
3) Position of treatment field acquisition: The position of the treatment field, which is caused by the couch motion
, can be written as a function of time t:
(1)
where
is the initial position at which the static dose starts to accumulate and
is the velocity of the couch. As a tumor coordinate system was used, the position of the radiation field moved in opposite direction to that of the couch motion (Fig. 2).
To improve the accuracy, all the tumor motions were gen- erated by an internet accessible respiratory trace generator (RTG) (http://www.ucalgary.ca/rop/Research/Respiratory).
16)In addition, the RTG could produce specific tumor motions for which a specific tumor motion parameter was irregular. For example, to produce tumor motion for which only the ampli- tude is irregular, the RTG could generate a tumor motion with an amplitude in the range of 1.35∼1.65 cm and a period of 4 s.
As for
, the opposite direction of the tumor motion (
) was used to calculate the position of the treatment field.
The position of the treatment field
caused by the couch motion and tumor motion was calculated as a function of time t:
(2)
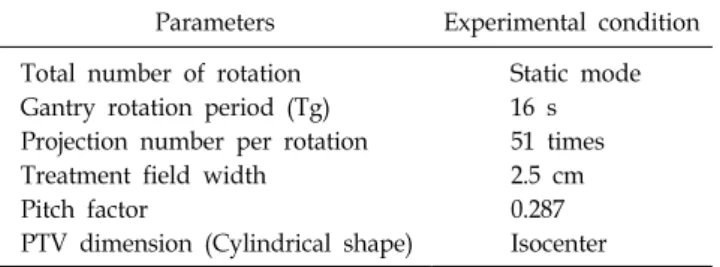
Table 2. Helical tomotherapy parameters and target volume information used in the simulation.
Parameters Experimental condition Total number of rotation Static mode Gantry rotation period (Tg) 16 s Projection number per rotation 51 times
Treatment field width 2.5 cm
Pitch factor 0.287
PTV dimension (Cylindrical shape) Isocenter where
is the same as that in Equation (1) and
is
the tumor motion produced by the RTG (Fig. 2) and
is the position of the treatment field caused by the tumor motion.
4) Dose profile acquisition: To acquire the dose profile, the position of the treatment field was changed as a function of time, and the static doses were cumulated (Fig. 1). The dose profile can be expressed as:
(3)
where
is dose profile,
is static dose at the position of the treatment field
(same as that in Equation (2)),
is the time at which the static dose started accumulating, and
is the time at which the static dose stopped accu- mulating.
2. Methods
The resulting dose profile depended on four tumor motion parameters, i.e., amplitude, period, baseline, and initial phase.
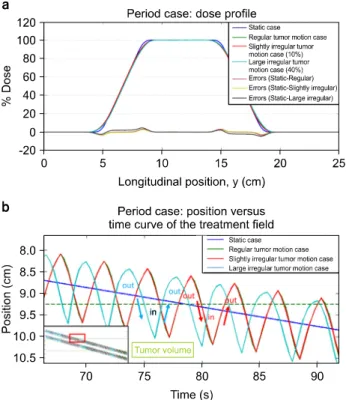
The moving case (experimental group) and static case (control group) were set to confirm the motion-induced dose error. The moving case was set to produce a dose profile that has a mo- tion-induced dose error; the static case was acquired for com- parison with the moving case. The moving cases were divided in two categories. One category was set to confirm the dose profile according to the variability of the tumor motion param- eters in the irregular tumor motion. Based on the regular tu- mor motion amplitude of 1.5 cm and a period of 4 s, each tu- mor motion parameter was set to a percent variability of 10%
(slightly irregular tumor motion case) and 40% (large irregular tumor motion case) in tumor motion amplitude (amplitude case), period (period case), and baseline (baseline case). For example, the slightly irregular tumor motion in the period case was set to a tumor motion with amplitude of 1.5 cm and peri- od between 3.6 s and 4 s. A percent variability of 10% was assumed for a tumor motion generated by normal breathing and 40% for a tumor motion generated by deep breathing.
17)The phase case concerned the initial phase of the tumor mo- tion, which was divided into end inhale, mid exhale, end ex- hale, and mid inhale. The tumor motions of a regular tumor motion case and a patient case were used to compare the dis-
crepancy effects of the tumor motion. The second category comprises the patient case, in which all the tumor motion pa- rameters are irregular.
The tumor motion for each moving case was calculated ac- cording to Equation (2). The dose profiles were acquired by adding the calculated position of the treatment field (Equation (3)). More details on the conditions adopted to calculate the dose profile are given in Table 2.
To analyze the motion-induced dose error, the dose profiles were evaluated for all the points. The amplitude, period, base- line, and patient cases were compared with the static case, and the maximum dose discrepancy between the moving case and static case was investigated. In the phase case, the end inspira- tion, mid expiration, end expiration, and mid inspiration phases of the tumor motion were compared. The position versus time curve of the treatment field was used to investigate the causes of the motion-induced dose error (Fig. 2).
Results and Discussion
1. Motion-induced dose errors generated by tumor motion parameters (amplitude case, period case, baseline case)
Fig. 3a shows the motion-induced dose error in the ampli-
tude case. The dose profiles in the regular tumor motion case
(green line), slightly irregular tumor motion case (red line),
and large irregular tumor motion case (cyan line) were com-
pared with the static case (blue line). The maximum dose dis-
crepancies observed were 3.3% in the regular tumor motion
case, 3.0% in the slightly irregular tumor motion case, and
4.6% in the large irregular tumor motion case. Fig. 3b was
used to analyze the cause of the motion-induced dose error in
the amplitude case. Owing to the tumor motion, ‘in’ and ‘out’
Fig. 3. (a) Dose profiles in the amplitude case. (b) Position versus time curve in the amplitude case.
Fig. 4. (a) Dose profiles in the period case. (b) Position versus time curve in the period case.
areas were generated by the curves of the static case and mov- ing case. This effect caused an accumulation of the static dose at different positions. In the regular tumor motion case, the
‘in’ and ‘out’ areas were identical. Therefore, an offset effect was generated, allowing the reduction of the motion-induced dose error. However, in the amplitude case, the tumor motion amplitude varied irregularly and appeared smaller or larger than that in the regular tumor motion case. Consequently, smaller, or larger, ‘in’ and ‘out’ areas were generated. This ef- fect reduced the offset effect, and the generated motion-in- duced dose error was larger than that observed in the regular tumor motion case.
Fig. 4a shows the motion-induced dose error in the period case. The maximum observed dose discrepancy for the slightly irregular motion case (red line) was 3.1%, whereas, for the large irregular motion case (cyan line), was 4.3%, confirming a tendency of the dose profile similar to that observed in the amplitude case. In the amplitude and period cases, no large discrepancy was observed between the regular tumor motion
case and the slightly irregular tumor motion case. Fig. 4b ex- amines the reason behind the motion-induced dose error gen- erated in the period case. A larger ‘in’ area was produced by a larger period and a smaller ‘out’ area was produced by a smaller period. This effect reduced the offset effect.
Fig. 5a shows the effects on the motion-induced dose error in the baseline case. In the slightly irregular motion case, the maximum dose discrepancy was 6.9%, whereas, in the large irregular motion case, the maximum error was 15.9%. In the large irregular tumor motion case, the motion-induced dose er- ror was greater than that in the slightly irregular tumor motion case. In the baseline case, the effects observed in the ampli- tude case and period case were generated at the same time.
Therefore, we believe that the baseline drift can have a sig- nificant impact.
2. Motion-induced dose errors according to the initial phase
The motion-induced dose error can also be observed in the
Fig. 5. (a) Dose profiles in the baseline case. (b) Position versus time curve in the baseline case.
Fig. 6. Dose profiles in the phase case (end inspiration, mid expiration, end expiration, and mid inspiration). The tumor motion was divided in (a) regular tumor motion case and (b) irregular tumor motion case.
initial phase of a tumor motion. Fig. 6 shows that the dose profile changed depending on the different initial phase of a tumor motion. For a regular tumor motion, the maximum dose discrepancy between the initial phases of a tumor motion was approximately 0.7%, whereas a value of 1.3% was observed for the irregular motion. A different dose discrepancy was ob- served at different positions of the curve. In the patient case, the motion-induced dose error was larger than that in the regu- lar tumor motion case. To reduce the motion-induced dose er- ror, the effect of the tumor motion initial phase should be considered.
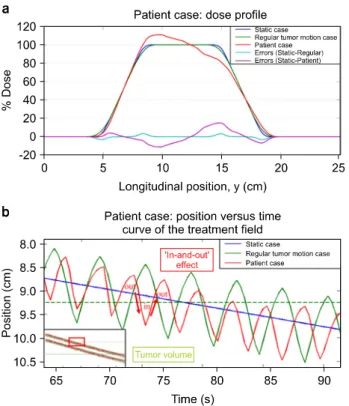
3. Motion-induced dose errors in the patient case In the patient case, the effects of the tumor motion parame- ters (amplitude, period, and baseline) generated motion-induced dose errors (Fig. 7a). A maximum 15.0% dose error was ob- served in the patient case. Fig. 7b reveals the reason of the motion-induced dose error. Owing to the effects of the tumor motion parameters, the offset effect was not generated in the regular tumor motion case, causing a significant motion-in-
duced dose error.
To reduce the motion-induced dose errors, it is necessary to reduce the variability of the tumor motion parameters. The current clinically applicable methods based on abdominal com- pression and respiratory training seem to provide appropriate solutions to minimize the tumor motion.
In this study, we analyzed the motion-induced dose error generated by irregular tumor motion. The motion-induced dose error observed in the irregular tumor motion case was larger than those seen in the slightly irregular tumor motion and reg- ular tumor motion cases. Consequently, we believe that the motion-induced dose error generated by a “large irregular” tu- mor motion can be greater than that of a regular tumor motion.
Even though this result was acquired by simplifying the treat-
ment field geometry and tumor motion, it still helps intuitively
understand the relationship between the irregular tumor motion
and motion-induced dose error.
Fig. 7. (a) Dose profiles in the patient case: no tumor motion case, regular tumor motion case, and real tumor motion case were compared. (b) Position versus time curve in the patient case.
Conclusion
In this study, motion-induced dose error as a function of each tumor motion parameters of irregular tumor motion dur- ing helical tomotherapy was investigated. The analysis showed that variability control of irregular tumor motion is important.
We believe variability of irregular tumor motion can be re- duced by using abdominal compression and respiratory training.
This study may help understand the effects of the tumor mo- tion parameters on the dose profile.
References
1. Cedric X Yu, David A Jaffray, John W Wong: The effects of intra-fraction organ motion on the delivery of dynamic in-
tensity modulation. Phys. Med. Biol. 43(1):91-104 (1998).
2. Bortfeld, Thomas, Steve B. Jiang, Eike Rietzel, Effects of motion on the total dose distribution. Semin. Radiat. Oncol.
14(1):41-51 (2004).
3. Sung Kyu Kim, Min Kyu Kang, Ji Woon Yea, Se An Oh:
Dosimetric evaluation of a moving tumor target in in- tensity-modulated radiation therapy (IMRT) for lung cancer patients. J. Korean Phys. Soc. 63(1):67-70 (2013).
4. B. Kim, J. Chen, T. Kron and J. Battista: Motion-induced dose artifacts in helical tomotherapy. Phys. Med. Biol. 54(19):
5707-5734 (2009).
5. M. Klein, S. Gaede and S. Yartsev: A study of longitudinal tumor motion in helical tomotherapy using a cylindrical phantom.
J. Appl. Clin. Med. Phys 14(2):52-61 (2013).
6. J. H. Lewis and S. B. Jiang: A theoretical model for respi- ratory motion artifacts in free-breathing CT scans. Phys. Med.
Biol. 54(3):745-755 (2009).
7. M. W. Kissick, J. Fenwick, J. A. James, et al: The helical tomotherapy thread effect. Med. Phys. 32(5):1414-1423 (2005).
8. J. N. Yang, T. R. Mackie, P. Reckwerdt, J. O. Deasy and B. R. Thomadsen: An investigation of tomotherapy beam delivery. Med. Phys. 24(3):425-436 (1997).
9. Brian Kanagaki, Paul W Read, Janelle A Molloy, James M Larner, Ke Sheng: A motion phantom study on helical to- motherapy: the dosimetric impacts of delivery technique and motion. Phys. Med. Biol. 52(1):243-255 (2007).
10. A. Schweikard, H. Shiomi and J. Adler: Respiration track- ing in radiosurgery. Med. Phys. 31(10):2738-2741 (2004).
11. P. Giraud, E. Morvan, L. Claude, et al: Respiratory Gating Techniques for Optimization of Lung Cancer Radiotherapy. J.
Thorac. Oncol. 6(12):2058-2068 (2011).
12. Martin J Murphy: Tracking moving organs in real time. Semin.
Radiat. Oncol. 14(1):91-100 (2004).
13. AAPM TG-69 Report: Radiographic film for megavoltage beam dosimetry, Sujatha Pai (2007).
14. Martina Fuss, Eva Sturtewagen, Carlos De Wagter, Dietmar Georg: Dosimetric characterization of GafChromic EBT film and its implication on film dosimetry quality assurance.
Phys. Med. Biol. 52(14):4211-4225 (2007).
15. Bart D. Lynch, Jakub Kozelka, Manisha K. Ranade, et al: Important considerations for radiochromic film dosimetry with flatbed CCD scanners and EBT GAFCHROMIC ® film.
Jonathan G. Li, William E. Simon, James F. Dempsey, Med.
Phys. 33(12):4551-4556 (2006).
16. Sarah Quirk, Nathan Becker, and Wendy Smith: External respiratory motion: Shape analysis and custom realistic respira- tory trace generation. Med. Phys. 39(8):4999-5003 (2012).
17. AAPM TG-76 Report: The management of respiratory mo-
tion in radiation oncology, P. J. Keall (2006).
나선형 토모테라피에서 불규칙적인 호흡으로 발생되는 움직임에 의한 선량 오차에 대한 연구