Ⅰ. Introduction
Ultrasound is a widely used imaging modality for evaluation of the prostate[1-2]. Recently, the westernization of the Korean diet and socioeconomic development are driving the increase in prevalence of obesity and metabolic diseases in Korean adults[3].
The growing prevalence in obesity and metabolic
diseases has brought a lot of attention to the obesity related diseases. One of those is metabolic syndrome (MS) defined as a cluster of multiple cardiovascular risk factors such as central obesity, hypertension, elevated fasting plasma glucose and dyslipidemia.
Many studies of metabolic syndrome have been conducted and reported that metabolic syndrome is risk factor for increased cardiovascular disease[4,5].
<원저>
대사증후군과 하부요로증상, PSA 및 전립샘 용적과의 연관성 : 단일기관 연구
강정훈1)・김연민2)・정정윤3)
1)더바른제통의원・2)원광보건대학 방사선과・3)삼성서울병원 건강의학센터
Association between Metabolic Syndrome and Lower Urinary Tract Symptoms, Prostate Specific Antigen, and Prostate Volume: Single C enter Study
Jung Hun Kang1)・Yon-Min Kim2)・Jeongyun Jeong3)
1)The Barenjetong Clinic
2)Department of Radiotechnology, Wonkwang Health Science University
3)Center for Health Promotion, Samsung Medical Center
Abstract The purpose of this study was to investigate the influence of metabolic syndrome (MS) on the lower urinary tract symptoms (LUTS), prostate specific antigen (PSA), and prostate volume in Korean men. We analyzed the data from 2654 men over the age of 40 who visited our health promotion center for regular health checkups. Of the total 2654 men, mean age, PSA level, International Prostate Symptom Score (IPSS), and prostate volume were 54.6 years, 1.21ng/ml, 6.2 points, and 27.8ml, respectively. All examinees were divided into MS group (46.5%, 1235 men) and non-MS group (53.5%, 1419). Age and prostate volume were significantly higher in the MS group. The patients were divided into three groups according to their ages: 40's, 50's, and over 60 years old. Prostate volume of the MS group in the younger age groups (40-49 years and 50-59 years) was significantly larger than that of the non-MS group. However, no difference was revealed in the age group of 60-69 years. No significant differences were found in the PSA level and LUTS between the MS and non-MS groups. In the multivariate regression analysis, central obesity was the strongest risk factor for the en- largement of prostate over 30ml among the metabolic components.
Key Words : Metabolic syndrome, Lower urinary tract symptoms, Prostate specific antigen, Prostate volume
중심 단어 : 대사증후군, 하부요로증상, 전립샘특이항원, 전립샘용적
Corresponding author: Jeongyun Jeong, Center for Health Promotion, Samsung Medical Center. Sungkyunkwan University School of Medicine.
Irwon-dong 50, Gangnam-gu Seoul 06351, Korea. Tel: 82-2-3410-1404. e-mail: [email protected] Received 17 July 2018; Revised 23 August 2018; Accepted 27 August 2018
Copyright ⓒ2018 by The Korean Journal of Radiological Science and Technology
To accommodate this rise in interest, further researches were being carried out to obtain more variety relation of metabolic syndrome. There have been several studies that showed the significant association between metabolic syndrome and lower urinary tract symptoms (LUTS)[6,7].
Lower urinary tract symptoms are characterized by weak urinary stream, urinary frequency, nocturia and urgency. They are generally caused by prostate enlargement in men and related with aging.
Many studies of western people, have examined the association between LUTS/Benign prostatic hyperplasia (BPH) and MS and it’s components[7-11]. They found a statistically significant association between metabolic syndrome and LUTS/BPH. Also, in some studies of Korean men, metabolic syndrome was correlated with LUTS and large prostate volume[12,13]. But in several other studies showed that metabolic syndrome was only associated with prostate volume and not significantly involved lower urinary tract symptoms[14-18]. So far, a lot of researches as stated above showed inconsistent results about MS and LUTS/BPH.
We aimed to evaluate the influence of the metabolic syndrome and the component of this syndrome on lower urinary tract symptoms, prostate specific antigen (PSA) and prostate volume (PV) in Korean males over the age of 40.
Ⅱ. Materials and methods
1. Data resource and collection
The institutional review board of Samsung medical center approved this study in August 2011 (IRB No.
2011-06-090).
A total of 2654 subjects who had participated in general health examinations at Samsung medical center from September 2011 to February 2012 completed a general health examination questionnaire including the International Prostate Symptom Score (IPSS) questionnaire, and Transrectal ultrasonography(TRUS) for prostate, blood test for Fasting plasma glucose (FPG), triglyceride(TG), total cholesterol, high-density
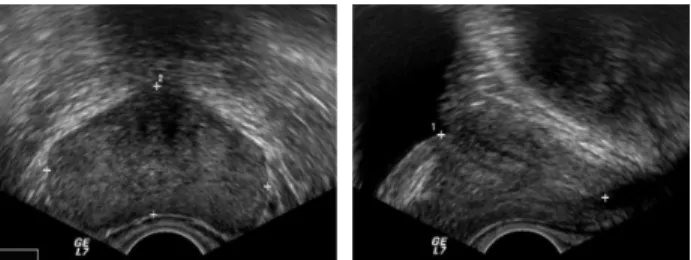
lipoprotein cholesterol (HDL-C), and low-density lipoprotein cholesterol (LDL-C) concentrations. The TRUS exam was conducted twice by same urologist. Example of TRUS is shown in Figure 1. And we got the average volume of the two results.
We excluded cases that had been diagnosed with prostatic cancer or administered a drug for a urologic disease or have had a transurethral resection of the prostate for BPH.
2. Diagnostic criteria for MS
In this study, the presence of metabolic syndrome was decided according to the National Cholesterol Education Program-Adult Treatment Panel III definition.
The diagnosis of metabolic syndrome had to satisfy three or more of the NCEP-ATP III criteria[19], which are as follows: 1) hypertension (systolic blood pressure of 130 mmHg or higher or diastolic blood pressure of 85 mmHg or higher ) or medication for hypertension, 2) hyperglycemia (Fasting plasma glucose level of 100 mg/dl or higher) or medication for elevated blood glucose, 3) central obesity (waist circumference of 90 cm or greater), 4) hypo-HDL cholesterolemia of less than 40 mg/dl, and 5) hypertriglyceridemia of 150 mg/dl or higher.
3. Statistical analysis
Initially, we divided the study participants into two groups those with or without metabolic syndrome.
Demographic characteristics, LUTS score, PSA and prostate volume were compared between the two groups by independent Student t test. And we carried out subgroup analysis according to age distribution.
Fig. 1 Prostate volume measurement using transrectal
ultrasonography by 3 distance ellipsoid volume
measurement method.
The subjects were separated by age decades such as 40
≤age<50, 50≤age<60 and 60≤age groups and the ANOVA test were used in each age group analysis.
Also, we assumed that significant prostate volume for LUTS is more than 30ml. we separated the participants with prostate volume more than 30ml and assessed the odds ratio of independent factors for prostate enlargement by multivariate logistic regression analysis.
Multivariate logistic regression analysis was carried out to determine the independent effects of metabolic syndrome components on prostate enlargement more than 30ml.
In the multivariate models, we included variables that might be associated the relationship between the benign prostate enlargement (30ml) and metabolic syndrome, which include age, central obesity, hypertension, hyperglycemia, hypertriglyceridemia, and low HDL.
P-values less than 0.05 were considered to be statistically significant and statistical analyses were performed PASW Statistics 18 (SPSS Inc.,Chicago,IL)
Ⅲ. Results
A total of 2654 men between age of 40 and 79 years were analyzed. A mean age of overall study subjects was 54.6±6.7 years and mean IPSS, PSA, Total Prostate volume were 6.16±5.77, 1.21±1.01ng/ml, 27.8±9.8ml respectively.
The descriptive data of the study population are shown in Table 1.
Among them, 1235 men (46.5%) were diagnosed metabolic syndrome. The age, mean total prostate volume and transitional zone volume were significantly higher in the metabolic syndrome group than in the non-metabolic syndrome group. However, no significant differences in lower urinary tract symptom parameters (IPSS, Voiding symptom scores, Storage symptom scores) and PSA were noted (Table 1).
We also conducted subgroup analysis by age groups due to aging is a common risk factor for prostate enlargement. We divided them into three groups by age decades. The overall age distribution was as follows: 40-49years (n= 555, 20.9% of total study population); 50-59years (n=1545, 58.2%); ≥60 years (n=554, 20.9%).
Total prostate volumes were 25.32±13.54, 27.60±7.47 and 30.77±10.25 ml in the 40’s, 50’s and over the age of 60 groups, respectively. There was a significant
Table 1 Demographic characteristics of the study participants by metabolic syndrome
Variable Total subjects Metabolic syndrome Group(n=1235 )
Nonmetabolic syndrome Group
(n= 1419) p value
Age(y) 54.6±6.7 55.6±6.51 53.6±6.71 0.001
TPV(ml) 27.8±9.8 28.74±11.73 26.96±7.62 0.001
Transitional Volume(ml) 9.05±22.01 9.98±31.97 8.23±3.91 0.041
PSA(ng/ml) 1.21±1.01 1.21±1.01 1.20±1.01 0.85
Total IPSS 6.16±5.78 6.28±5.95 6.05 ±5.61 0.319
Storage symptoms 2.51±2.38 2.55±2.43 2.47±2.34 0.41
Voiding symptoms 3.65±4.07 3.73±4.19 3.58±3.96 0.348
Moderate to severe LUTS 28.10(%)
(N=746) 28.42(%)
(N=351) 27.84(%)
(N=395) 0.738
DM history(%) 41 69 17 0.001
Hypertriglycemia(%) 45 78 17 0.001
Hypertension(%) 53 80 29 0.001
Low HDL(%) 12 24 3 0.001
Central obesity(%) 88 97 80 0.001
TPV: Total Prostate Volume, PSA: Prostate Specific Antigen, IPSS: International Prostate Symptom Score.
increase in the total prostate volume and transitional zone volume with increase in the age. However the total IPSS score, storage symptom score and PSA were only significantly different between the 50’s decade and over 60’s age group. The voiding symptom was not different among three groups (Table 2).
Table 3 show analyses result by age groups to determine the effect of metabolic syndrome. In the
40’s decade, all parameters except PSA were higher in the MS group than in the non-MS group. But the 50’s decade, only total prostate volume was larger in the MS group than in the non-MS group. No significant difference according to the IPSS, voiding and storage scores and PSA was noted. And the over 60’s age group, there were no significant difference in the all parameters between the two groups (Table 3).
Table 2 Demographic characteristics of the study participants according to age distribution
Total subjects 40≤Age<50 50≤Age<60 60≤Age p value
Age(y) 54.6±6.7 45.82±2.31 54.24±2.36 64.24±3.09
TPV(ml) 27.79±9.79 25.32±13.54 27.60±7.47 30.77±10.25 0.001
Transitional Volume(ml) 9.05±22.01 7.25±2.28 9.13±28.52 10.63±6.58 0.037
PSA(ng/mL) 1.21±1.01 1.19±1.19 1.15±0.82 1.38±1.26 0.001
Total IPSS 6.16±5.78 5.79±5.55 5.96±5.63 7.13±6.32 0.001
Storage symptoms 2.51±2.38 2.23±2.22 2.38±2.27 3.18±2.72 0.001
Voiding symptoms 3.65±4.07 3.57±3.96 3.58±4.00 3.95±4.35 0.197
TPV: Total Prostate Volume, PSA: Prostate Specific Antigen, IPSS: International Prostate Symptom Score.
Table 3 Comparison of the metabolic syndrome group and non-metabolic syndrome group by age groups
Total subjects Metabolic
syndrome Group
Nonmetabolic
syndrome Group p value
40≤Age<50 N=555 N=183 N=372
IPSS 5.79±5.55 6.73±6.53 5.33±4.93 0.013
Voiding symptom 3.57±3.96 4.23±4.54 3.24±3.60 0.013
Storage symptom 2.23±2.22 2.50±2.53 2.09±2.04 0.062
PSA(ng/mL) 1.19±1.19 1.25±0.91 1.17±1.31 0.427
TPV(ml) 25.32±13.54 27.47±21.78 24.26±6.08 0.049
Transitional Volume(ml) 7.25±2.28 7.69±2.34 7.03±2.22 0.010
50≤Age<60 N=1545 N=749 N=796
IPSS 5.96±5.63 5.84±5.49 6.07±5.75 0.441
Voiding symptom 3.58±4.00 3.49±3.94 3.67±4.07 0.391
Storage symptom 2.38±2.27 2.36±2.20 2.40±2.33 0.689
PSA(ng/mL) 1.15±0.82 1.15±0.87 1.15±0.77 0.908
TPV(ml) 27.60±7.47 28.21±8.00 27.03±6.90 0.002
Transitional Volume(ml) 9.13±28.52 10.26±40.81 8.05±3.14 0.129
60≤Age N=554 N=303 N=251
IPSS 7.13±6.32 7.15±6.59 7.11±5.99 0.942
Voiding symptom 3.95±4.35 4.06±4.54 3.81±4.12 0.535
Storage symptom 3.18±2.72 3.09±2.82 3.30±2.60 0.409
PSA(ng/mL) 1.38±1.26 1.35±1.33 1.43±1.16 0.453
TPV(ml) 30.77±10.25 30.79±10.56 30.74±9.88 0.955
Transitional Volume(ml) 10.63±6.58 10.67±6.79 10.58±6.32 0.864
TPV: Total Prostate Volume, PSA: Prostate Specific Antigen, IPSS: International Prostate Symptom Score.
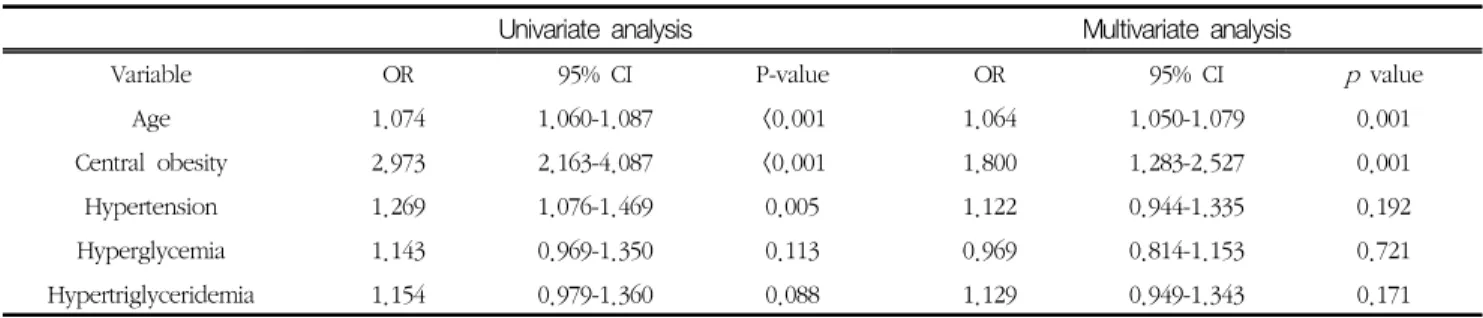
Table 4 shows the odds ratios (OR) and 95% confidence interval (CI) for benign prostate enlargement more than 30ml according to the components of diagnostic criteria for metabolic syndrome and age. Among the 2654 subjects, the prevalence of the benign prostate enlargement more than 30ml was 836 subjects (31.5%). Result of multivariate regression analysis showed that age and central obesity were associated with BPE. Between the two, central obesity was strongest risk factors for prostate enlargement more than 30ml.
Ⅳ. Discussion
The Korea has seen a rise in the levels of prostate enlargement and prostate-related disorders.
However, to our knowledge, there is a paucity of epidemiologic studies about prostate volume of Korean men.
In this study, we prospectively recorded the data of participants who undergoing a medical health checkup program at the health promotion center of our hospital and excluded patients who had been diagnosed or treated for a urologic disease, such as prostate cancer or BPH. So our study data looks like a meaningful epidemiologic result reflect the trends of Korean men’s prostate volume and LUTS.
Recently, Lee et al reported a multicenter, prospective observational cohort study for Korean patient with BPH from September 2008 to January 2009[20]. They survey cases of BPH among patients visiting urologists at general hospital in the Korea with LUTS and reported following results of average prostate volume by age decade: 50-59
years old, 31.6 ± 12.4mL; 60-69years old, 35.5±15.5mL;
70 years or old, 40.1±27.2mL.
As compared with our study data, objectively patients with LUTS who were treated by urologist have more large size of prostate volume than men without LUTS.
In a recent several studies for Korean people [14-18], it were reported that metabolic syndrome is not related with PSA level and lower urinary tract symptom. Especially Kim et al reported that metabolic syndrome and prostate volume were only significantly related in young males under the age of 60[15]. They also evaluated the subgroup analysis by age decades and their results did not show any differences or trends by age groups.
In the current study, our data demonstrated similarly that metabolic syndrome only related with prostate volume enlargement and have no relation with PSA level and lower urinary tract symptoms. But in the results of subgroup analysis by age decades, it seems like metabolic syndrome more influence on prostate younger age group. In the 40’s decade, all parameters except PSA were higher in the MS group than in the non-MS group. But the 50’s decade, only total prostate volume was larger in the MS group and the over 60’s age group, there were no significant difference in the all parameters between the two groups(Table 3).
We cannot exactly describe the reasons but one of the main reasons might be that aging effect on prostate enlargement. So in older age, no matter the diagnosis of metabolic syndrome, prostate will be enlarged and may cause lower urinary tract symptoms. This could imply metabolic syndrome has to be managed from early Table 4 Multivariate logistic regression analysis to determine the independent effects of metabolic syndrome components on
prostate enlargement more than 30mL
Univariate analysis Multivariate analysis
Variable OR 95% CI P-value OR 95% CI p value
Age 1.074 1.060-1.087 <0.001 1.064 1.050-1.079 0.001
Central obesity 2.973 2.163-4.087 <0.001 1.800 1.283-2.527 0.001
Hypertension 1.269 1.076-1.469 0.005 1.122 0.944-1.335 0.192
Hyperglycemia 1.143 0.969-1.350 0.113 0.969 0.814-1.153 0.721
Hypertriglyceridemia 1.154 0.979-1.360 0.088 1.129 0.949-1.343 0.171