Biological Effects of Allium monanthum Extracts on Lipid Metabolism, Anti‐oxidation and the Production of Pro‐inflammatory Cytokines in Rats
Fed a High‐Fat Diet
Kwang Ro Yoon, Jae Kuk Ryu and Eun Lee*
Department of Pharmaceutical Engineering, Sangji University, Wonju‐si 220‐702, Korea
Abstract - This study is a basic study on the development of functional substances involved in obesity prevention, lipid metabolism, and immune regulation. Male Sprague‐Dawley rats were fed a high‐fat diet for 10 weeks. Allium monanthum extracts (AME) were administered orally to obesity‐induced rats, and their lipid‐lowering, antioxidative and various types of biological effects related to the immune system were examined. Blood free fatty acid and triglyceride concentrations decreased as the dose of AME increased. Total cholesterol and LDL cholesterol concentrations in the blood decreased as the dose of AME increased. The total cholesterol concentrations in the liver of the AME‐treated groups were lower than the control group. The thiobarbituric acid reactive concentrations were lower in the plasma and liver of all AME‐treated groups than the control group. Plasma AST and ALT activities did not show any significant differences among the treatment groups. IL‐1β and IL‐6 concentrations in the liver tended to decrease as the dose of AME increased. TNF‐α and IL‐10 concentrations did now show any significant differences compared to the control group. Lower expression levels of TNF‐α, Apo‐B and Apo‐E genes were found in the AME‐treated groups. Taken together, these results indicate that AME may show positive effects in lipid lowering, antioxidation and anti‐inflammation.
Key words -
Allium monanthum extracts, Cytokines, Lipid‐lowering effect, Anti‐oxidative activity, Anti‐inflammatory effect*Corresponding author. E-mail : [email protected]
Introduction
More than 50% of adult metabolic diseases are caused by obesity, which is physiologically characterized by an increase in inflammation‐mediating substances, abnormal cytokine production and the activation of the inflammatory signaling mechanism. Therefore, obesity can cause chronic inflammatory conditions and negatively affect the immune system and may result in obesity‐induced adult diseases and other diseases (Cook et al., 2000).
Previous studies on obesity showed that a pro‐adipocyte may become a macrophage under certain conditions (Charrière et al., 2003), and it has been reported that an accumulation of neutral fat tissues is associated with various physiological reactions, such as the endocrine system, energy metabolism, stress and infections (Baker et al., 1993; Hill et al., 1992).
The typical clinical symptoms of obesity‐induced diseases
include diabetes (Mohamed‐Ali et al., 1997; Mohamed‐Ali et al., 1998), which is induced by the cytokines TNF‐α and IL‐6, which are released by adipocytes and directly affect insulin resistance (Weigle, 1994; Nielsen and Jensen, 1997; Kissebah et al., 1976). Additionally, excessively accumulated adipocytes may cause the abnormal production, decomposition and release of fatty acid in the liver and may lead to liver diseases.
They may also increase the blood lipid concentration and cause cardiovascular diseases (Lee et al., 1988; Bray, 1992), and excessive lipid peroxides may induce cell aging and cell destruction and cause cancers or chronic inflammatory conditions (Hotamisligil et al., 1993; Krauss et al., 1998;
Eckel and Krauss, 1998). These research results demonstrate that obesity can be involved in most diseases, and they suggest reducing obesity to prevent and treat various types of diseases and the need to adequately control factors that cause abnormal lipid metabolism.
Therefore, to improve obesity and develop functional substances involved in lipid metabolism and immune regula-
Original Research Article
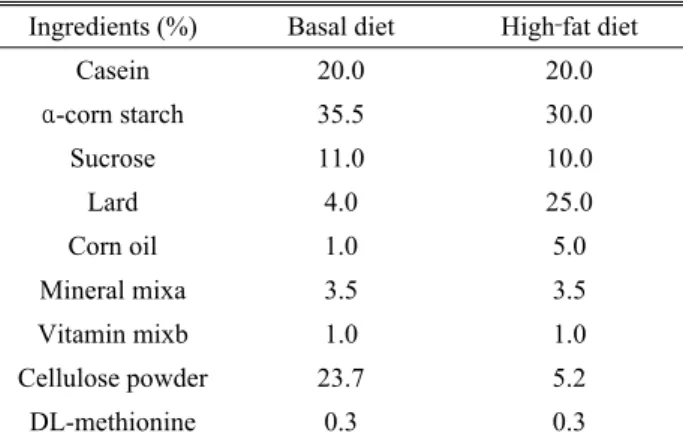
Table 1. Composition of the experimental diet
Ingredients (%) Basal diet High‐fat diet
Casein 20.0 20.0
α-corn starch 35.5 30.0
Sucrose 11.0 10.0
Lard 4.0 25.0
Corn oil 1.0 5.0
Mineral mixa 3.5 3.5
Vitamin mixb 1.0 1.0
Cellulose powder 23.7 5.2
DL-methionine 0.3 0.3
aMineral mix (g/kg diet): CaCO3, 29.29; CaHPO4․2H2O, 0.43;
KH2PO4, 34.30; NaCl, 25.06; MgSO4․7H2O, 9.98; Ferric citrate hexahydrate, 0.623; CuSO4․5H2O, 0.516; MnSO4․H2O, 0.121;
ZnCl2, 0.02; KI, 0.005; and (NH4)6 Mo7O24․4H2O, 0.0025.
bVitamin mix (mg/kg diet): Thiamine‐HCl, 12; Riboflavin, 40;
Pyridoxine‐HCl, 8; Vitamin B12, 0.005; Ascorbic acid, 300; D- biotin, 0.2; Menadione, 52; Folic acid, 2; D‐calcium pantothe- nate, 50; P-aminobenzoic acid, 50; Nicotinic acid, 60; Choline chloride, 2,000 (IU/kg diet); Retinyl acetate, 5,000 (IU/kg diet);
and Cholecalciferol, 250 (IU/kg diet).
tion, many studies have been conducted using natural products (Lee et al., 2000; Lee, 2003; Kang et al., 1996;
Ishikawa et al., 1997; Ueda and Tanoue, 2000; Laganiere and Yu, 1987). As a result, they represent a possibility in the production of functional substances involved in obesity and immune regulation from natural substances, and further systematic research on natural resources is needed.
Allium monanthum (Allium monanthum Max.) is a perennial plant categorized in Liliaceae Allium. It is a condiment herb, its bulbs and soft parts are edible, it is used in Korean traditional medicine, and it is distributed under the name of Allium monanthum, Yasan, or Haebaek (Baek et al., 2011). The main ingredients have been reported as alliin, methyl alliin, and scorodose (Ahn et al., 2000; Choi et al., 1992). Among the major ingredients, alliin has anti‐cancerous, anti‐diabetic and anti‐oxidative effects, increases immune system functions, suppresses hyperlipidemia, improves liver function, increases blood circulation and suppresses thrombus formation (Ji, 2010; Seo et al., 2009). Based on previous results, Allium monanthum has been suggested to improve obesity, and it contains functional substances involved in decreasing the excessive production of obesity‐induced per- oxides and inflammatory conditions.
Therefore, this study was a basic study aimed to develop functional substances involved in obesity prevention, lipid metabolism and immune regulation. Allium monanthum extracts were administered to obese rats, and lipid‐lowering, anti‐oxidative and various biological effects related to the immune system were examined.
Materials and methods
Experimental animals, experimental groups and obesity induction
Fifty male Sprague‐Dawley rats with an average weight of 185.38 ± 5.21 g were fed a high‐fat diet (Table 1) for 10 weeks. Forty rats that weighed 400 g or more were selected, and 10 rats were randomly assigned to each of four groups: a control group (physiological saline solution, 100 mg/kg), treatment 1 group (100 mg/kg Allium monanthum extract), treatment 2 group (200 mg/kg Allium monanthum extract)
and treatment 3 group (300 mg/kg Allium monanthum extract).
All of the procedures employed in this study were performed in accordance with the Guide for the Care and Use of Laboratory Animals, and the work was approved by the Ethics Committee of the Faculty.
Feeding
Food was supplied equally to all groups using basic feed (Table 1) for 5 weeks. The feed amount was equally supplied such that the difference in the amount of consumption was within 5% in each group. The animals were allowed free access to water.
Allium monanthum extracts and oral administration Allium monanthum (500 g dried weight) was collected from the mountains in Gangwondo and dried under shade. It was extracted 3 times for 5 hours each time in a water bath refluxed with cold water. The extract was filtered, decom- pressed and concentrated, and 117 g of ethanol extract was obtained. A fixed amount of the ethanol extract was orally
administered at 5 pm each day using a sonde needle.
Blood sampling and collection of liver samples
Blood was collected after 12 hours of fasting by the heart puncture method on the last day of the experiment. Approxi- mately 7 ml of sample was collected and divided for individual analysis. Liver samples were collected after blood sampling, processed according to the specific biochemical analysis and stored at ‐80°C.
Lipids in the plasma and liver
The total cholesterol, triglyceride (TG), LDL cholesterol and HDL cholesterol concentrations in the plasma were analyzed using an automatic blood‐analyzing device (Boe- hringer Mannheim, Mannheim, Germany). The plasma free fatty acid (FFA) content was measured by an enzymatic method using a V‐NEFA kit (Nissui Pharmaceutical Co., Tokyo, Japan). The amount of total cholesterol and TG in the liver was analyzed using a quantitative kit (Wako Pure Chemical Industries, Ltd, Osaka, Japan).
Plasma thiobarbituric acid‐reactive substance (TBARS)
The TBARS amounts in the plasma were quantitatively measured after incubation at 37°C for 120 minutes according to the Buege and Aust method (Buege and Aust, 1978).Liver TBARS
Approximately 1‐2 g of the liver extract was washed in normal saline to remove blood, mixed with 1.15% KCl solution and homogenized to obtain a 10% homogenate. In total, 100 µl of the homogenate was placed into a screw cap tube, and 0.2 ml of 8.0% sodium dodecyl sulfate, 1.5 ml of 20% acetic acid solution (pH 3.5) and 1.5 ml of 0.8% TBA solution were added. Distilled water was added to a total volume of 4 ml, and the mixture was vortexed and placed into a 95°C water bath for 1 hour. The heated test tube was cooled under running tap water, and 1 ml of distilled water and 5 ml of a mixture of n‐butanol:pyridine (15:1, v/v) was added and vortexed. The solution was then centrifuged at 1,500 × g for 10 minutes, and the absorbance of the supernatant (n‐butanol: pyridine layer) was measured at 532 nm. TMP (1,1,3,3‐ tetramethoxypropane) was used as a standard substance, and the lipid peroxide level was presented as nM of malondialdehyde (MDA).
Liver glutathione peroxidase (GSH‐Px)
GSH‐Px activity in the liver was analyzed according to the methods of Levander et al. (1983). A fixed amount of the liver was washed in normal saline to remove blood, mixed with 0.15 M KCl solution and homogenized to make a 20%
homogenate, which was centrifuged at 9,000 × g for 15 minutes. The supernatant was centrifuged again at 15,000 × g for 1 hour. Aliquots of supernatant corresponding to 100‐200 µg of protein were used for the analysis. During centrifuga- tion, the temperature was maintained at 4°C. The prepared sample was placed into a stock solution (K buffer, 40 mM glutathione, KH buffer, 1 unit of glutathione reductase per ml) at 37°C for 10 minutes, followed by the addition of 20 mM of NADPH for 2 minutes. Then, 15 mM t‐butyl hydroperoxide was added, and the absorbance was measured at 340 nm for 1 minute. A unit of GSH‐PX activity was defined as the enzymatic activity required to oxidize 1 nmole of NADPH to NADP per mg protein over 1 minute.
Liver superoxide dismutase (SOD)
SOD activity in the liver was measured through its decreased reduction speed, known as the Flohe et al. method (Flohe et al., 1988). When superoxide is produced by xanthine oxidase, superoxide reduces ferricytochrome C (Fe3+) to ferrous cyto- chrome C (Fe2+). If SOD is present, SOD competes with super- oxide, and as a result, the reduction speed of cytochrome C decreases. In this experiment, the degree of inhibition of the reduction of ferricytochrome C was measured by colorimetry at 550 nm at 30‐second intervals for 3 minutes. A unit of SOD was defined as the amount of SOD that inhibited 50% of the reduction of ferric cytochrome C.
Liver catalase (CAT)
To measure CAT activity in the liver, 0.2 g of liver was homogenized in 20 fold (by weight) 25 mM KH2PO4‐NaOH buffer (pH 7.0). The homogenate was diluted 60 fold in the same buffer and ultrasonicated twice for 15 seconds with a W385 sonicator (Heat Systems‐Ultrasonics Inc, NY, USA) in an ice bath. The sample’s absorbance was measured with a spectrophotometer at 550 nm, and the CAT activity was calculated from the standard curve obtained using formalde- hyde as a standard solution (Johansson and Borg, 1988).
Table 2. Primers used in RT‐PCR and the estimated size of the amplified fragments
RNA Primer sequences (5′to 3′)
TNF‐α: 446 bp 5′‐AGC CCA CGT CGT AGC AAA CCA CCA A‐3′
5′‐AAC ACC CAT TCC CTT CAC AGA GCA AT‐3′
Apolipoprotein B: 170 bp 5′‐AGA AAG AGA ACA AAG CAG AGA TTG TGG‐3′
5′‐CAT GCT CCA TTC TCA CAT GTT TA‐3′
Apolipoprotein E: 300 bp 5′‐GTG GGC AAA CCT AAT GGA GA‐3′
5′‐GCT GAA GCT GTG TGG AAT CA‐3′
Leptin: 458 bp 5′‐GTG GCT TTG GTC CTA TCT GTC CTA TG‐3′
5′‐TCA GGG CTA AGG TCC AAC TGT TGA AG‐3′
β‐actin: 348 bp 5′‐TGG AAT CCT GTG GCA TCC ATG AAA‐3′
5′‐TAA AAC GCA GCT CAG TAA CAG TCC G‐3′
Aspartate aminotransferase (AST) and alanine aminotrans- ferase (ALT) activities in the plasma
AST and ALT activities in the plasma were measured using an automatic blood‐analyzing device (Boehringer Mannheim, Mannheim, Germany).
Cytokines in the plasma and liver
Plasma samples used for the quantitation of cytokines were prepared by separating plasma immediately after blood collec- tion, and they were stored at ‐80°C. Liver samples for the quantitation of cytokines were collected from 1 g of liver mixed with 5 ml cold phosphate‐buffered saline (PBS, pH 7.4, containing a protease inhibitor cocktail) and ground on ice. The ground mixture was centrifuged at 4°C at 15,000 rpm for 15 minutes. The supernatant was filtered using a 0.45 µm filter and centrifuged again, and the supernatant was stored at
‐80°C. The cytokine levels (IL‐1β, TNF‐α, IL‐6 and IL‐10) were determined using a commercially available kit (Bio Source International Inc., Camarillo, CA, USA). The lowest detectable concentration of TNF‐α was 0.7 pg/ml, and the lowest detectable concentration for the other cytokines was 3‐8 pg/ml. The amount of cytokines in the liver was measured using a control solution mixed with 5 ml PBS and 1 g of raw liver, and the values are presented as pg/mg.
RT‐PCR (reverse transcription polymerase chain reaction) analysis
Total RNA was extracted from differentiated cells using TRI reagent (Sigma‐Aldrich, St Louis, MO, USA). cDNA was reverse transcribed from 5 mg/ml total RNA using the M‐MLV reverse transcriptase kit (Promega, Madison, WI,
USA). PCR was performed with synthesized cDNA and primers for mouse TNF‐α, Apo‐B, Apo‐E, leptin and β‐actin genes (Table 2). PCR was performed in a 30 µl mixture containing 3 µl of 10× Ex‐Taq buffer, 2.5 µl of dNTP mixture (2.5 mM each), 0.5 µl of Ex‐Taq polymerase (5 units/µl, TaKaRa), 2 µl of forward and reverse primers (100 pM/µl each), 1 µl of cDNA template and 21 µl of distilled water. The PCR conditions were as follows: initial denaturation at 94°C for 5 minutes; 35 cycles of denaturation at 94°C for 30 seconds, annealing at 57‐
60°C for 30 seconds, and extension at 72°C for 45 seconds;
and extension at 72°C for 10 minutes. PCR products were electrophoresed using a 1.5% agarose gel (0.1 mg/ml ethidium bromide), and a GeneRuler DNA Ladder Mix (Fermentas, Glen Burnie, MD, USA, Cat. No. SM0333) was used as a size marker.
Statistical analysis
The experimental results were assessed by a one‐way ANOVA using the SPSS statistical program. Significant differences between treatment groups were determined by Duncan's multiple range test at the P<0.05 level.
Results
FFA and TG concentrations in the plasma
The blood FFA and TG concentrations are shown in Table 3.
As the dose of Allium monanthum extract increased, both the FFA concentration and TG concentration decreased.
Cholesterol concentration in the plasma
Total cholesterol and LDL cholesterol concentrations decreased as the dose of Allium monanthum extract increased.
Table 3. Effects of Allium monanthum extracts on plasma FFA and triglyceride concentrations in rats fed a high‐fat diet
Treatment FFA (uEql) Triglyceride (mg/dl)
Control 953.29 ± 62.58b 327.59 ± 37.15b
100 mg/kg Allium monanthum ext. 902.73 ± 49.37b 244.98 ± 31.55a
200 mg/kg Allium monanthum ext. 871.59 ± 38.44b 237.41 ± 25.69a
300 mg/kg Allium monanthum ext. 755.74 ± 31.71a 219.58 ± 28.36a
a,b: Means in the same column with different superscripts are significantly different (P<0.05).
Table 4. Effects of Allium monanthum ext. on plasma total cholesterol, HDL cholesterol and LDL cholesterol concentration in rats fed a high‐fat diet
Treatment Total cholesterol (mg/dl) HDL cholesterol (mg/dl) LDL cholesterol (mg/dl)
Control 352.77 ± 32.85c 27.57 ± 6.81NS 47.95 ± 5.11b
100 mg/kg Allium monanthum ext. 275.49 ± 26.98b 30.15 ± 5.77NS 38.26 ± 4.57ab 200 mg/kg Allium monanthum ext. 233.15 ± 25.72ab 28.54 ± 3.91NS 29.85 ± 5.93a 300 mg/kg Allium monanthum ext. 219.12 ± 27.38a 29.66 ± 5.03NS 27.44 ± 3.83a
a,b,c: Means in the same column with different superscripts are significantly different (P<0.05).
NS: Not significantly different (P>0.05).
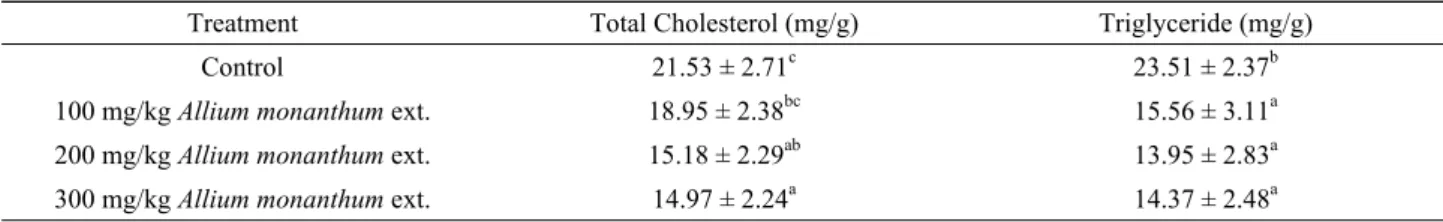
Table 5. Effects of Allium monanthum ext. on liver total cholesterol and triglyceride concentration in rats fed a high‐fat diet
Treatment Total Cholesterol (mg/g) Triglyceride (mg/g)
Control 21.53 ± 2.71c 23.51 ± 2.37b
100 mg/kg Allium monanthum ext. 18.95 ± 2.38bc 15.56 ± 3.11a
200 mg/kg Allium monanthum ext. 15.18 ± 2.29ab 13.95 ± 2.83a
300 mg/kg Allium monanthum ext. 14.97 ± 2.24a 14.37 ± 2.48a
a,b,c: Means in the same column with different superscripts are significantly different (P<0.05).
However, the HDL cholesterol concentration did now show a significant difference between the control group and the Allium monanthum extract‐treated groups (Table 4).
Total cholesterol and TG concentrations in the liver
The total cholesterol concentrations in the liver of the extract‐treated groups appeared to be lower than the control group, and the concentration decreased as the dose of extracts increased. The TG concentrations were significantly lower in the Allium monanthum extract‐treated groups than the control group. Among the Allium monanthum extract‐treated groups, no significant difference was observed (Table 5).TBARS concentration in the plasma and liver
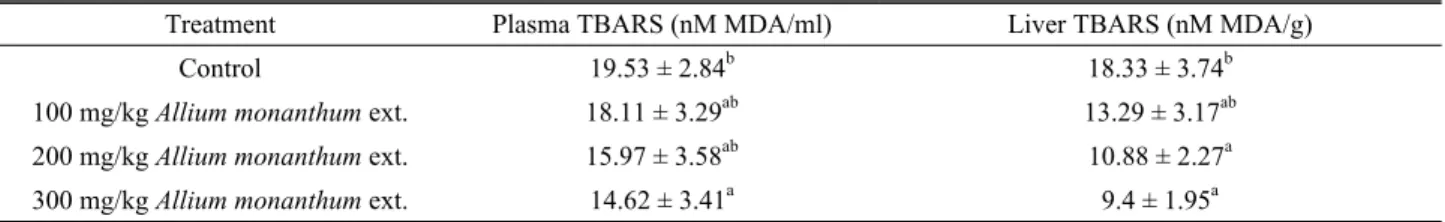
The TBARS concentrations in the plasma and liver of all
Allium monanthum extract‐treated groups were lower than the control group and tended to decrease as the dose increased (Table 6).
GSH‐Px, SOD and CAT activity in the liver
The anti‐oxidant activity values in the liver are shown in Table 7. GSH‐Px activity did not show a significant difference among the treatment groups. The SOD and CAT activities of all Allium monanthum extract‐treated groups were higher compared with the control group. However, no significant difference was observed between the 100 mg/kg Allium monanthum extract‐treated group and the control group.
AST and ALT activity in the plasma
Table 8 shows the AST and ALT activity in the plasma. No
Table 6. Effects of Allium monanthum ext. on plasma and liver TBARS concentration in rats fed a high‐fat diet
Treatment Plasma TBARS (nM MDA/ml) Liver TBARS (nM MDA/g)
Control 19.53 ± 2.84b 18.33 ± 3.74b
100 mg/kg Allium monanthum ext. 18.11 ± 3.29ab 13.29 ± 3.17ab
200 mg/kg Allium monanthum ext. 15.97 ± 3.58ab 10.88 ± 2.27a
300 mg/kg Allium monanthum ext. 14.62 ± 3.41a 9.4 ± 1.95a
a,b: Means in the same column with different superscripts are significantly different (P<0.05).
Table 7. Effects of Allium monanthum ext. on antioxidant activity in rats fed a high‐fat diet
Treatment GSH‐Px(nmoles/min/mg protein) SOD(unit/mg protein) CAT(μmoles (H2O2)/min/mg protein)
Control 137.61 ± 6.53NS 13.29 ± 2.11a 67.36 ± 7.29a
100 mg/kg Allium monanthum ext. 141.29 ± 5.81NS 16.35 ± 3.78ab 72.29 ± 5.11a 200 mg/kg Allium monanthum ext. 139.68 ± 6.21NS 21.67 ± 3.59b 82.55 ± 4.71b 300 mg/kg Allium monanthum ext. 149.32 ± 5.94NS 21.94 ± 2.21b 87.43 ± 5.38b
a,b: Means in the same column with different superscripts are significantly different (P<0.05). NS: Not significantly different (P>0.05).
Table 8. Effects of Allium monanthum ext. on aspartate aminotransferase (AST) and alanine aminotransferase (ALT) activity in rats fed a high‐fat diet
Treatment AST (Karmen unit) ALT (Karmen unit)
Control 41.37 ± 5.61NS 31.75 ± 5.05NS
100 mg/kg Allium monanthum ext. 39.71 ± 5.39NS 33.87 ± 5.32NS
200 mg/kg Allium monanthum ext. 41.55 ± 5.72NS 31.91 ± 3.94NS
300 mg/kg Allium monanthum ext. 42.39 ± 5.48NS 30.68 ± 4.27NS
NS: Not significantly different (P>0.05).
Table 9. Effects of Allium monanthum ext. on plasma cytokine concentrations in rats fed a high‐fat diet
Treatment IL‐1β(pg/ml) IL‐6(pg/ml) TNF‐α(pg/ml) IL‐10(pg/ml)
Control 38.23 ± 4.09c 58.66 ± 7.47c 45.89 ± 4.72b 13.58 ± 2.11a
100 mg/kg Allium monanthum ext. 34.77 ± 4.54bc 51.89 ± 8.16bc 43.35 ± 6.83ab 14.71 ± 2.54ab 200 mg/kg Allium monanthum ext. 26.59 ± 4.38a 49.54 ± 6.29b 36.12 ± 5.85ab 16.69 ± 3.07ab 300 mg/kg Allium monanthum ext. 28.21 ± 4.51ab 39.35 ± 5.62a 34.97 ± 4.61a 18.25 ± 2.12b
a,b,c: Means in the same column with different superscripts are significantly different (P<0.05).
significant difference was observed among the groups.
Cytokine concentration in the plasma
The blood concentrations of various cytokines involved in the inflammatory reaction are shown in Table 9. The IL‐1β concentrations were lower in the plasma of all Allium monanthum extract‐treated groups than the control group.
However, the 100 mg/kg Allium monanthum extract‐treated
group did not show a significant difference compared to the control group. IL‐6 concentrations in the plasma tended to decrease as the dose of Allium monanthum extract increased.
The TNF‐α concentration in the plasma seemed to increase as the dose of Allium monanthum extract increased. However, only the 300 mg/kg Allium monanthum extract‐treated group showed a significant difference compared to the control group. For IL‐10 concentrations in the plasma, only the 300
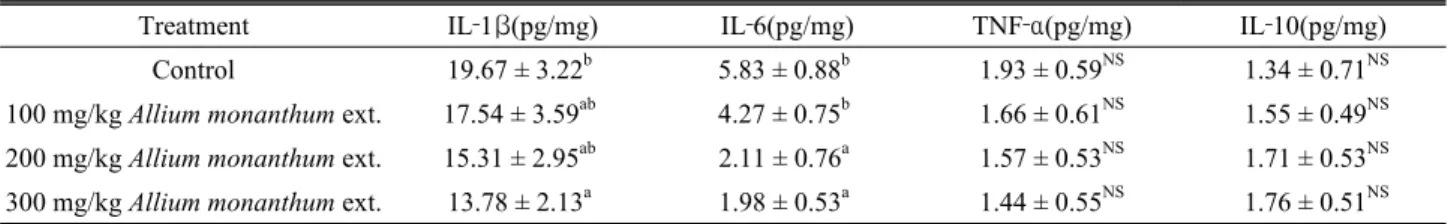
Table 10. Effects of Allium monanthum ext. on liver cytokine concentrations in rats fed a high‐fat diet
Treatment IL‐1β(pg/mg) IL‐6(pg/mg) TNF‐α(pg/mg) IL‐10(pg/mg)
Control 19.67 ± 3.22b 5.83 ± 0.88b 1.93 ± 0.59NS 1.34 ± 0.71NS
100 mg/kg Allium monanthum ext. 17.54 ± 3.59ab 4.27 ± 0.75b 1.66 ± 0.61NS 1.55 ± 0.49NS 200 mg/kg Allium monanthum ext. 15.31 ± 2.95ab 2.11 ± 0.76a 1.57 ± 0.53NS 1.71 ± 0.53NS 300 mg/kg Allium monanthum ext. 13.78 ± 2.13a 1.98 ± 0.53a 1.44 ± 0.55NS 1.76 ± 0.51NS
a,b: Means in the same column with different superscripts are significantly different (P<0.05).
NS: Not significantly different (P>0.05).
Fig. 1. RT‐PCR analysis of TNF‐α, Apo‐B, Apo‐E and leptin gene expression.
100: 100 mg/kg Allium monanthum ext.
200: 200 mg/kg Allium monanthum ext.
300: 300 mg/kg Allium monanthum ext.
Fig. 2. The gene expression ratio of TNF‐α/β‐actin by RT‐PCR.
a,b,c,d
: Means with different superscripts are significantly different (P<0.05).
100: 100 mg/kg Allium monanthum ext.
200: 200 mg/kg Allium monanthum ext.
300: 300 mg/kg Allium monanthum ext.
mg/kg Allium monanthum extract‐treated group showed a significantly higher value than the control group (Table 9).
Liver cytokine concentration
The IL‐1β, IL‐6, TNF‐α and IL‐10 concentrations in the liver are shown in Table 10. IL‐1β and IL‐6 concentrations tended to decrease as the dose of Allium monanthum extract increased. The TNF‐α and IL‐10 concentrations did now show any significant differences compared to the control group.
RT‐PCR analysis of TNF‐α, Apo‐B, Apo‐E and leptin gene expression
The TNF‐α, Apo‐B and Apo‐E gene expression levels were lower in the Allium monanthum extract‐treated groups than the control group. However, leptin gene levels were similar in the Allium monanthum extract‐treated groups and the control group (Fig. 1).
Ratio of TNF‐α, Apo‐B, Apo‐E and leptin gene expression to β‐actin expression
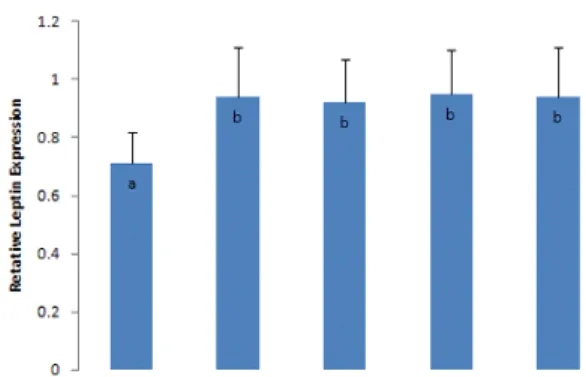
The gene expression ratio of TNF‐α to β‐actin in the 300 mg/kg Allium monanthum extract‐treated group was significantly lower than the control group (Fig. 2). The gene expression ratios of Apo‐B to β‐actin in the 200 and 300 mg/kg Allium monanthum extract‐treated groups were significantly lower than the control group (Fig. 3). The gene expression ratio of Apo‐E to β‐actin in the 300 mg/kg Allium monanthum extract‐treated group was significantly lower than the control group (Fig. 4). The gene expression ratios of leptin in all of the obese groups were significantly higher than the control group (obese, non‐treated rats). However, no significant difference was observed between the control group
and the Allium monanthum extract‐treated groups (Fig. 5).
Discussion
FFA, total cholesterol, LDL cholesterol and TG concen- trations in the blood are increased in obesity (Considine et al.,
Fig. 3. The gene expression ratio of Apo‐B/β‐actin by RT‐PCR.
a,b,c
: Means with different superscripts are significantly different (P<0.05).
100: 100 mg/kg Allium monanthum ext.
200: 200 mg/kg Allium monanthum ext.
300: 300 mg/kg Allium monanthum ext.
Fig. 4. The gene expression ratio of Apo‐E/β‐actin by RT‐PCR.
a,b,c
: Means with different superscripts are significantly different (P<0.05).
100: 100 mg/kg Allium monanthum ext.
200: 200 mg/kg Allium monanthum ext.
300: 300 mg/kg Allium monanthum ext.
Fig. 5. The gene expression ratio of leptin/β‐actin by RT‐PCR.
a,b,c
: Means with different superscripts are significantly different (P<0.05).
100: 100 mg/kg Allium monanthum ext.
200: 200 mg/kg Allium monanthum ext.
300: 300 mg/kg Allium monanthum ext.
1996). With the increase in these biological parameters, the possible occurrence of adult diseases, such as diabetes and cardiovascular diseases, further increases (Nielsen and Jensen, 1997).
The results show that these biological parameters were decreased in Allium monanthum extract‐treated groups, which suggests that Allium monanthum extracts contain functional substances with lipid‐lowering effects and may be used in the prevention and treatment of adult diseases.
The total cholesterol concentrations were lower in the liver
of the Allium monanthum extract‐treated groups than the control group. The concentrations decreased as the dose of Allium monanthum extract increased. The TG concentrations of all Allium monanthum extract‐treated groups were signifi- cantly lower than the control group. Because the dietary intake was nearly identical in all groups in this experiment, the results suggested that functional substances in Allium monanthum extracts may have affected lipid synthesis and degradation in the liver.
TBARS is often used as an indicator of the amount of lipid peroxides being produced in vivo. Lipid peroxide induces oxidative damage in cells and various types of functional disorders and is considered a cause of aging and diseases (Kissebah et al., 1976).
In this experiment, TBARS concentrations were lower in the plasma and liver of all Allium monanthum extract‐treated groups than the control group. The concentrations tended to decrease as the dose of Allium monanthum extract increased (Table 6). It is thought that the functional substances in Allium monanthum may have greatly contributed to these results.
CAT is an enzyme that is necessary to prevent H2O2
converted by SOD from producing a stronger free radical (Kono and Fridovich, 1982).
In this experiment, GSH‐Px activity did not show signifi- cant differences among the treatment groups. However, the SOD and CAT activities were higher in all Allium monanthum
extract‐treated groups than the control group, which was consistent with the TBARS results.
In this experiment, the plasma AST and ALT activities did not show significant differences among the treatment groups.
This result indicates that there was no damage to liver function regardless of the dose of Allium monanthum extract.
The concentrations of IL‐1β, IL‐6 and TNF‐α in the plasma were decreased as the dose of Allium monanthum extract increased. The IL‐10 concentration in the 300 mg/kg Allium monanthum extract‐treated group was significantly higher than the control group.
Cytokines are responsible for defense against inflammation, the growth, differentiation and death of cells, angiogenesis, and the restoration and development of homeostasis (Oppenheim, 2001). In addition, cytokines released from fat cells, including leptin, TNF‐α and IL‐6, are closely related to insulin resistance (Weigle, 1994; Nielsen and Jensen, 1997;
Kissebah et al., 1976), and they are known as major causes for diabetes (Mohamed‐Ali et al., 1997; Mohamed‐Ali et al., 1998).
IL‐1β induces T‐cell activation, B‐cell maturation and NK cell activity and also acts on the hypothalamus and induces fever (Delgado et al., 2003).
IL‐6 is as an important regulator of immunity and metabol- ism, and it inhibits the effect of TNF‐α, which is an infectious precursor related to insulin resistance, and regulates glucose and lipid metabolism by acting on the liver and adipose tissues (Pedersen et al., 2001).
TNF‐α is known to affect insulin receptors in tissues and inhibit glucose uptake into tissues (Hotamisligil et al., 1993).
TNF‐α also induces the apoptosis of hepatocytes and the pathogenic condition of tissues.
In this study, IL‐1β, IL‐6 and TNF‐α concentrations in the Allium monanthum extract‐treated groups tended to decrease and IL‐10 concentrations tended to increase. This result suggests that Allium monanthum extracts may have inhibited inflammatory cytokine production in vivo, and they may contain a functional substance that increases the production of anti‐inflammatory cytokines.
The IL‐1β and IL‐6 concentrations in the liver tended to decrease as the dose of Allium monanthum extract increased.
However, neither TNF‐α nor IL‐10 concentrations showed
significant differences among the treatment groups. Consider- ing that various types of cytokines are produced and released through the blood in the liver, this result indicates that Allium monanthum extracts may have affected cytokine production and release in the liver. As a result, it is suggested that Allium monanthum extracts positively affect inflammatory reactions due to obesity.
In this study, the expression of TNF‐α, Apo‐B, and Apo‐E genes but not leptin was lower in the Allium monanthum extract‐treated groups than the control group. Allium monanthum extracts have a high lipid‐lowering effect. Leptin gene expression did not show a difference compared to the control group. This result is considered to be because of the time difference between the reduction of adipocytes and the decrease in leptin released from the adipocytes.
Taken together, these results suggest that the functional substances contained in Allium monanthum extracts have lipid‐lowering and antioxidative effects and regulate inflamma- tory reactions.
Literature Cited
Ahn, E.M., T.O. Jang and N.I. Baek. 2000. Development of biologically active compounds from edible plant sources‐III.
Isolation of flavonoid‐glycoside from the Allium monanthum Max. J. Korean Soc. Appl. Biol. Chem. 43:314‐316.
Baek, N.I., E.M. Ahn, H.Y. Kim, Y.D. Park, Y.J. Chang and S.Y. Kim. 2011. Development of biologically active com- pounds from edible plant sources‐IV. Isolation of galactosyl- diglyceride from the Allium monanthum Max. Korean J. Life Science 11:93‐96.
Baker, J., J.P. Liu, E.J. Robertson and A. Efstratiadis. 1993.
Role of insulin‐like growth factors in embryonic and postnatal growth. Cell 75:73‐82.
Bray, G.A. 1992. Obesity increase risk for diabetes. Int. J.
Obes. Relat. Metab. Disord. 16:S13‐S17.
Buege, J.A. and S.D. Aust. 1978. Microsomal lipid peroxida- tion. Methods Enzymol. 52:302‐310.
Charrière, G., B. Cousin, E. Arnaud, M. André, F. Bacou, L.
Penicaud and L. Casteilla. 2003. Preadipocyte conversion to macrophage: evidence of plasticity. J. Biol. Chem. 278:9850
‐9855.
Choi, J.Y., I.S. Lee and S.C. Kim. 1992. Effects of wild garlic on serum component of cholesterol fed rats. J. Korean Oil Chemists' Soc. 9:73‐79.
Considine, R.V., M.K. Sinha, M.L. Heiman, A. Kriauciunas, T.W. Stephens, M.R. Nyce, J.P. Ohannesian, C.C. Marco, L.J. McKee, T.L. Bauer and J.F. Caro. 1996. Serum immunoreactive leptin concentration in normal‐weight and obese humans. N. Engl. J. Med. 334:292‐295.
Cook, D.G., M.A. Mendall, P.H. Whincup, I.M. Carey, L.
Ballam, J.E. Morris, G.J. Miller and D.P. Strachan. 2000. C‐
reactive protein concentration in children: relationship to adiposity and other cardiovascular risk factors. Athero- sclerosis 149:139‐150.
Delgado, A.V., A.T. McManus and J.P. Chambers. 2003.
Production of tumor necrosis factor‐α, interleukin‐1β, inter- leukin‐2 and interleukin‐6 by rat leukocyte subpopulations after exposure to substance P. Neuropeptides 37:355‐361.
Eckel, R.H. and R.M. Krauss. 1998. American Heart Association call to action: obesity as a major risk factor for coronary heart disease. AHA Nutrition Committee. Circulation 97:2099‐2100.
Flohe, L., R. Becker, R. Brigelius, E. Lengfelder and F. Otting.
1998. Convenient assasy for superoxide dismutase. In CRC Handbook of Free Radicals and Antioxidants in Bio- medicine, CRC Press, Boca Raton, USA. pp. 287‐293.
Hill, J.O., D. Lin, F. Yakubu and J.C. Peters. 1992.
Development of dietary obesity in rats: influence of amount and composition of dietary fat. Int. J. Obes. Relat. Metab.
Disord. 16:321‐33.
Hotamisligil, G.S., N.S. Shargill and B.M. Spiegelman. 1993.
Adipose expression of tumor necrosis factor‐α: direct role in obesity‐linked insulin resistance. Science 259:87‐91.
Ishikawa, T., M. Suzukawa, T. Ito, H. Yoshida, M. Ayaori, M.
Nishiwaki, A. Yonemura, Y. Hara and H. Nakamura. 1997.
Effect of tea flavonoid supplementation on the susceptibility of low‐density lipoprotein to oxidative modification. Am. J.
Clin. Nutr. 66:261‐266.
Ji, T.J. 2010. A study on radio‐protection mechanism of platelet cells after injection of alliin. J. Radiol. Sci. Tech. 33:185-191.
Johansson, L.H. and L.A. Borg. 1988. A spectrophotometric method for determination of catalase activity in small tissue samples. Anal. Biochem. 174: 331‐336.
Kang, Y.H., T.Y. Ha and K.D. Moon. 1996. Effects of pine needle extracts on serum and liver lipid contents in rats fed high fat diet. J. Korean Soc. Food Nutr. 25:367‐373.
Kissebah, A.H., S. Alfarsi, P.W. Adams and V. Wynn. 1976.
Role of insulin resistance in adipose tissue and liver in the pathogenesis of endogenous hypertriglyceridaemia in man.
Diabetologia 12:563‐571.
Kono, Y. and I. Fridovich. 1982. Superoxide radical inhibits
catalase. J. Biol. Chem. 257:5751‐5754.
Krauss, R.M., M. Winston, B.J. Fletcher and S.M. Grundy.
1998. Obesity: impact on cardiovascular disease. Circulation 98:1472‐1476.
Laganiere, S. and B.P. Yu. 1987. Anti‐lipoperoxidation action of food restriction. Biochem. Biophys. Res. Comm. 145:1185‐
1191.
Lee, E., M.Y. Choi and H.S. Oh. 2000. Effects of powdered Siho (Bupleuri radix) on serum and liver lipid composition and antioxidative capacity in rat fed high oxidized fat.
Korean J. Nutrition 33:502‐506.
Lee, E. 2003. Effects of powdered pine needle (Pinus densiflora seib et Zucc.) on serum and liver lipid composi- tion and antioxidative capacity in rats fed high oxidized fat.
J. Korean Soc. Food Sci. Nutr. 32:926‐930.
Lee, K.U., H.K. Lee, C.S. Koh and H.K. Min. 1988. Artificial induction of intravascular lipolysis by lipid‐heparin infusion leads to insulin resistance in man. Diabetologia 31:285‐290.
Levander, O.A., D.P. DeLoach, V.C. Morris and P.B. Moser.
1983. Platelet glutathione peroxidase activity as an index of selenium status in rats. J. Nutr. 113:55‐63.
Mohamed‐Ali, V., S. Goodrick, A. Rawesh, D.R. Katz, J.M.
Miles, J.S. Yudkin, S. Klein and S.W. Coppack. 1997.
Subcutaneous adipose tissue releases interleukin‐6, but not tumor necrosis factor‐α, in vivo. J. Clin. Endocrinol. Metab.
82:4196‐4200.
Mohamed‐Ali, V., J.H. Pinkney and S.W. Coppack. 1998.
Adipose tissue as an endocrine and paracrine organ. Int. J.
Obes. Relat. Metab. Disord. 22:1145‐1158.
Nielsen, S. and M.D. Jensen. 1997. Obesity and cardiovascular disease: is body structure a factor? Curr. Opin. Lipidol.
8:200‐204.
Oppenheim, J.J. 2001. Cytokines: past, present and future. Int.
J. Hematol. 74:3‐8.
Pedersen, B.K., A. Steensberg, C. Fischer, C. Keller, K.
Ostrowski and P. Schjerling. 2001. Exercise and cytokines with particular focus on muscle‐derived IL‐6. Exerc.
Immunol. Rev. 7:18‐31.
Seo, J.H., J.M. Kim, S.Y. Ahn, J.G. Cho, J.M. Kim and H.Y.
Park. 2009. Effect of alliin on vascular functions. J. Life Science 19:976‐982.
Ueda, H. and K. Tanoue. 2000. Growth‐depressing and cholesterol‐
lowering effects of quillaja and tea saponins in chicks as influenced by diet composition. Anim. Sci. J. 71:393‐399.
Weigle, D.S. 1994. Appetite and the regulation of body composition. FASEB J. 8:302‐310.