• 검색 결과가 없습니다.

Filtering Effect in Supervised Classification of Polarimetric Ground Based SAR Images

N/A
N/A
Protected

Academic year: 2021

Share "Filtering Effect in Supervised Classification of Polarimetric Ground Based SAR Images"

Copied!
15
0
0

로드 중.... (전체 텍스트 보기)

전체 글

(1)

1. Introduction

Classification of earth terrain using polarimetric synthetic aperture radar (POLSAR) images has been an important application in the SAR polarimetry technique. Many algorithms for supervised and unsupervised classification have been developed and the application studies using POLSAR data were presented. Unsupervised method classifies the POLSAR image automatically by computing clusters based on a certain criterion and the class identification may have to be inferred. These unsupervised classifications are effective when the ground truth data are not available. Supervised

classification firstly determines training sets for each class that are selected based on ground truth maps or differences in scattering feature of POLSAR image and then classify an whole image by decision rule.

Unsupervised classification techniques of POLSAR image data can be categorized into 3 types.

The first type of unsupervised classification technique is based on the statistical characteristics of POLSAR image data without considering of the physical scattering mechanism of terrain media. The second approach classifies POLSAR image by inherent physical scattering properties without utilizing the statistical characteristics (van Zyl, 1989; Cloude and Pottier, 1997; Lee et al., 1999a; Ferro-Famil et al.,

Filtering Effect in Supervised Classification of Polarimetric Ground Based SAR Images

Moon-Kyung Kang*, Kwang-Eun Kim*

, Seong-Jun Cho*, Hoonyol Lee**, and Jae-Hee Lee*

*Korea Institute of Geoscience and Mineral Resources, Daejeon, Republic of Korea

**Kangwon National University, Chuncheon, Republic of Korea

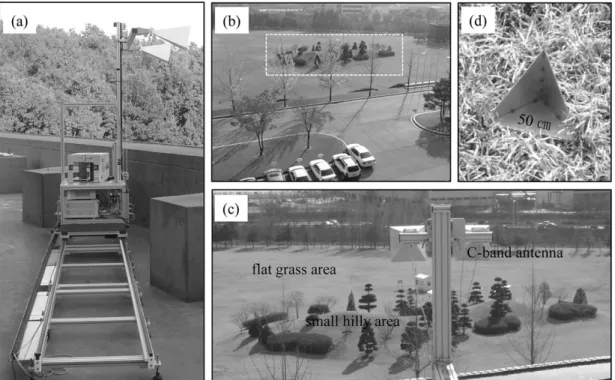
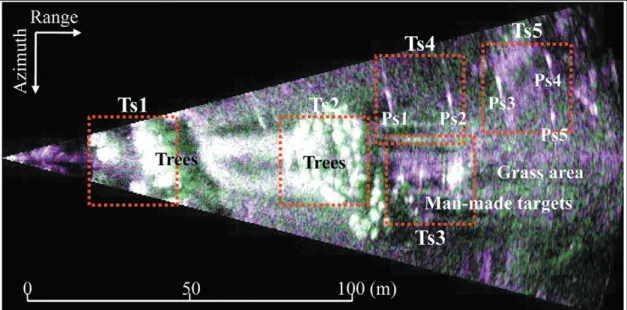
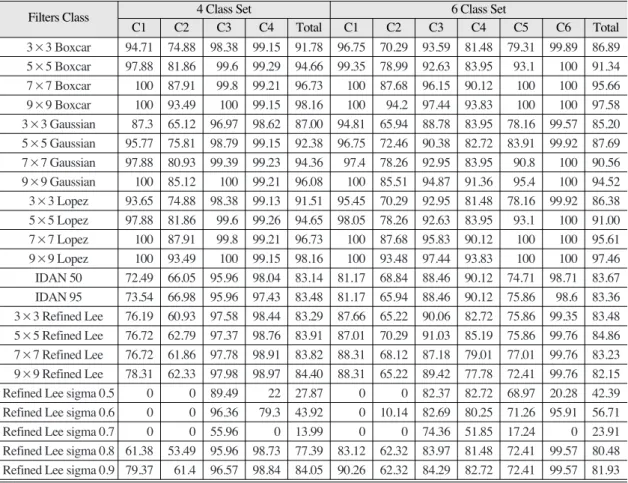
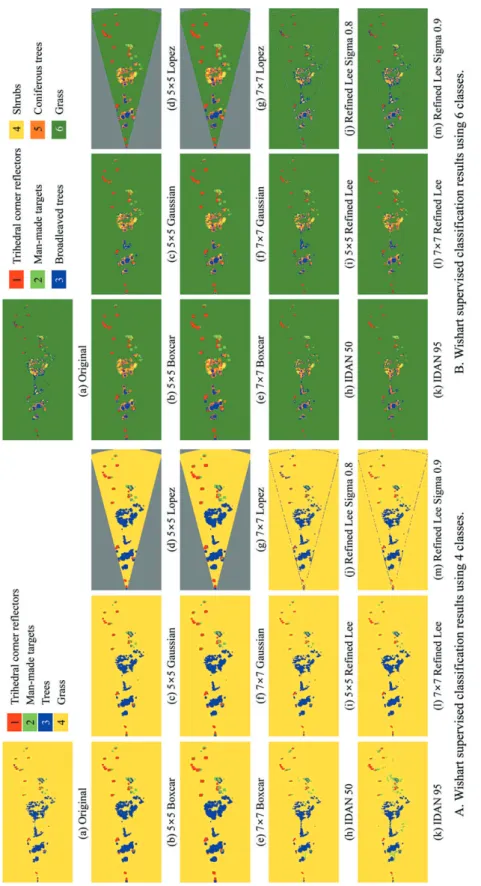
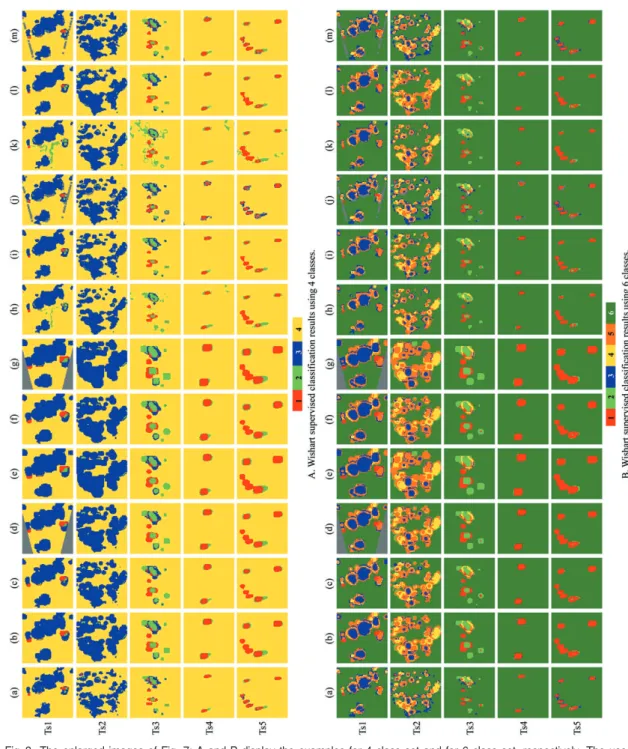
Abstract : We investigated the speckle filtering effect in supervised classification of the C-band polarimetric Ground Based SAR image data. Wishart classification method was used for the supervised classification of the polarimetric GB-SAR image data and total of 6 kinds of speckle filters were applied before supervised classification, which are boxcar, Gaussian, Lopez, IDAN, the refined Lee, and the refined Lee sigma filters. For each filters, we changed the filtering kernel size from 3×3 to 9×9 to investigate the filtering size effect also. The refined Lee filter with the kernel size of bigger than 5×5 showed the best result for the Wishart supervised classification of polarimetric GB-SAR image data. The result also showed that the type of trees could be discriminated by Wishart supervised classification of polarimetric GB-SAR image data.

Key Words : GB-SAR, polarimetric SAR, SAR speckle filter, Wishart supervised classification.

Received December 22, 2010; Accepted December 27, 2010.

Corresponding Author: Kwang-Eun Kim ([email protected])

(2)

2001). This type of unsupervised classification technique has the advantage of providing information for class type identification. The third approach proposed by Lee et al. (2004) combines both the statistical property and its physical scattering characteristics.

For POLSAR image classification, many techniques used the 3×3 polarimetric covariance matrix to derive a feature vector, and then the feature vector was assumed to have a joint Gaussian distribution. A distance measure between a sample and a class center of Gaussian distribution is defined and then supervised classification or unsupervised classification techniques are applied. In the early studies, the supervised classification algorithm based on the polarimetric contrast between two media was developed using the characteristics of POLSAR data.

The method uses only the intensities of linear polarization components, the phase difference between HH and VV, the ratio of HH and VV, and the coefficient of variation.

Kong et al. (1988) introduced Bayes classification scheme using the multivariate complex Gaussian distribution to utilize the complete polarimetric information. For single-look POLSAR data, the scattering matrix has the complex Gaussian distribution. Kong et al. (1988) proposed a distance measure for Maximum Likelihood (ML) classification based on this distribution and this approach has been extended by other researches.

However, this algorithm has the limitation that it can be only applicable to single-look polarimetric SAR data. Yueh et al. (1988) and Lim et al. (1989) extended this technique for normalized polarimetric SAR data.

Usually POLSAR data are processed as a multilooking data to reduce the speckle noise.

Multilook POLSAR data can be expressed in the form of a polarimetric covariance matrix which has a

complex Wishart distribution (Goodman, 1963). Lee et al. (1994) developed a new supervised algorithm for multilook SAR image based on the complex Wishart distribution in the polarimetric covariance matrix. The Wishart classification technique uses Wishart distance for the measurement of polarimetric similarity. The Wishart distance is simple to measure and has several good characteristics of applicability to speckle filtered data, robustness in its independence of polarization basis, and generalization to multi- frequency polarimetric SAR classification.

In general, the speckle in SAR image data makes it difficult to interpret, segment, and classify the image.

Therefore, understanding the speckle effect in SAR image data is essential and important to extract reliable information and geophysical parameters. As shown in the left image of Fig. 1 (Lee and Pottier, 2009), speckle in SAR image is a scattering phenomenon due to the coherent interference of the reflected waves from many elementary scatterers within a resolution cell (Goodman, 1976). SAR systems coherently record the returned waves to obtain high spatial resolution in the azimuth dimension. The speckle noise is arising from this coherent nature. The right-hand side of Fig. 1 shows the sum of scattered waves act as random walk in the complex plane. The speckle noise is appeared as a granular pattern consisted of very bright and very dark spots caused a pixel-to-pixel variation in intensity. The bright backscattering spot is the

Fig. 1. Speckle formation (Lee and Pottier, 2009, p. 102).

(3)

interference has been highly constructive and the dark backscattering spot is related the interference has been highly destructive.

Speckle in SAR images can be considered as multiplicative noise model that means the standard deviation to mean ratio is a constant as listed in Table 1. The theory about speckle noise and speckle filtering for single polarization SAR image is well developed. Single polarization system has a multiplicative characteristic for the amplitude and an additive characteristic for the phase. On the contrary, the speckle noise problem for POLSAR data is complicated and still not solved. Speckle noise in POLSAR data appears not only in the three intensity images, but also in the complex and cross-product terms. Therefore, the speckle reduction problem for POLSAR data is more complicated than a single polarization SAR because of difficulties of preserving polarimetric properties and of dealing with the cross- product terms. Recent studies showed that the speckle noise component for POLSAR data must be considered a combination of multiplicative and additive noise sources (López-Martínez and Fàbregas, 2003; López-Martínez et al., 2005).

Single polarization SAR imagery can be described by the Rayleigh speckle model (Ulaby et al., 1988).

Single look and multilook POLSAR data obey the complex Gaussian distribution and complex Wishart

distribution, respectively. In covariance or coherency matrix of POLSAR image data, the diagonal terms of the matrix have the multiplicative noise characteristic.

But the off-diagonal terms which give complex correlation information can be approximated by a combination of additive and multiplicative noise model (López-Martínez and Fàbregas, 2003). Speckle filters by the complex Wishart distribution based on the covariance or coherency matrix should be developed to satisfy this statistical characteristics.

The primary goal of speckle filters in SAR image data is to reduce the speckle noise level without the information loss. The ideal speckle filter should smooth the speckle noise in homogeneous area, retain the edge and boundary sharpness, and preserve the subtle but distinguishable details, such as a thin linear feature and a point target. The standard digital noise filtering techniques as the mean filter (the boxcar filter) and the median filter were considered to be incapable of dealing with speckle noise. Lee et al.

(1999) proposed an algorithm for POLSAR speckle filtering that uses edge-aligned windows concept and the local statistics. This polarimetric speckle filter was developed to avoid crosstalk between polarization channels, to preserve polarimetric properties, and to retain features, edge sharpness, and point targets.

Vasile et al. (2005, 2006) presented a new method named Intensity-Driven Adaptive-Neighborhood (IDAN) filter for polarimetic or interferometic SAR data. The adaptive neighbourhood (AN) concept has been introduced in medical image processing. In each pixel called seed, an adaptive neighbourhood of variable shape and dimension is determine by a region growing algorithm that is a simple region- based image segmentation method. Lee et al. (2009) proposed an improved Sigma filter that is effective in speckle reduction without the deficiencies of the original Lee sigma filter that shows underestimation problem and blurring strong targets. This refined Lee Table 1. Ratios of standard deviation to the mean of multilook

SAR images (Lee and Pottier, 2009, p. 106)

Number N-Look N-Look N-Look

of Looks Intensity Amplitude Amplitude () (Amplitude (Intensity

Averaging) Averaging)

1 1.000 0.5227 0.5227

2 0.707 0.3696 0.3630

3 0.577 0.3017 0.2941

4 0.500 0.2614 0.2536

6 0.408 0.2134 0.2061

8 0.352 0.1848 0.1781

N-Look N-Look N-Look Number

Intensity Amplitude Amplitude of Looks

(1/ N) (Amplitude (Intensity

Averaging) Averaging)

(4)

sigma filter is a sophisticate speckle filter for single- look and multilook SAR images.

As aforementioned, it is important to determine the speckle noise effect to retrieve the reliable physical information from POLSAR data and to gain a precise classification map. The main objective of this study is to analyse the classification results using Wishart supervised classification method and also to compare the speckle filtering effect on these classification results. We discussed on the Wishart supervised classification result of the fully polarimetric ground based synthetic aperture radar (GB-SAR) data at C- band. We also focused on the most effective speckle filtering method to improve image analysis and to produce precise classification results of the C-band polarimetric GB-SAR data.

2. Ground Based SAR Image Data

We used the fully polarimeric SAR image data of which the range resolution is 0.75 meter and the azimuth resolution are 0.5 meter at 100 meter range distance and 3.4 meter at 600 meter range distance.

The SAR image data was acquired by the GB-SAR system developed by KIGAM (Korea Institute of Geoscience and Mineral Resources) and Kangwon National University (KNU). The KIGAM-KNU GB- SAR system operates at C-band (5.3 GHz) and at X- band (9.65 GHz) and obtains the fully polarimetric and interferometric SAR data. The two main parts of this GB-SAR system are radio frequency (RF) system and motion controlling instruments (Lee et al., 2007a). The RF part composed of a vector network analyzer (VNA), a power amplifier, a microwave switch, and a dual polarization square horn antenna. The Agilent 8362B VNA operates at

Fig. 2. The GB-SAR system (a) and the test site inside KIGAM field (b and c). The (d) is the photo of a trihedral corner reflector used

as a RCS reference.

(5)

the frequency domain from 10 MHz to 20 GHz as a coherent microwave transmitter and receiver. The motion part uses a linear rail 6 meter long where the antenna move for scanning the synthetic aperture 5 meter with 5 cm sampling step length.

The GB-SAR data was acquired at C-band (5.3 GHz) and quad polarization mode during 3 days between 3

rd

and 5

th

November, 2008. The test performed inside KIGAM field and the GB-SAR system was installed on 4

th

floor building height (about 21 meter) as shown in Fig. 2(a). There are several different targets, a natural medium such as trees and grass and a man-made target such as wooden geomagnetic measurement boxes, a metallic pole, and a metallic panel in the test site (Fig. 2(b) and Fig. 2(c)). Five metallic trihedral corner reflectors (50 cm side length) in Fig. 2(d) were used to obtain a high radar cross section (RCS) reference.

The finally focused GB-SAR image has the dimension of 256 rows by 2048 columns. The Deramp-FFT algorithm was used for the focusing of GB-SAR image data (Lee et al., 2007b). We used the PolSARpro v4.0 program for the analysis of GB-

SAR image data, which is the open software package (http://earth.esa.int/polsarpro/) for a polarimetric analysis and classification of POLSAR images.

3. Results and Discussion

It had been reported that a natural medium and a man-made target could be classified by the unsupervised Wishart-H/alpha and Wishart- H/A/alpha classification method (Kang et al., 2009).

In this study, we focused on the speckle filtering effect in the supervised classification of the fully polarimetric GB-SAR image data. In order to analyse the filtering effect in supervised classification of GB- SAR image data, we applied various averaging window size for speckle filtering of the GB-SAR image. The 1 ×4 averaging window is used for multilook processing, the 3 ×3, 5×5, 7×7, and 9×

9 windows for speckle filter processing, and the 3×3 additional averaging window for supervised classification processing.

The Wishart supervised classification is known as

Fig. 3. The polarimetric Pauli color coded image of 1×4 multilook (Red: HH-VV, Green: HV, Blue: HH+VV).

(6)

an efficient and effective method to classify different terrain targets in POLSAR image data (Lee et al., 1994). When a ground truth map is available, supervised classification using the Wishart distance measure can be easily applied to POLSAR data. In the absence of ground truth map, training areas have to be selected from POLSAR images based on scattering characteristics of each class. In this study, the training area set was selected by using the polarimetric Pauli color coded image.

Pauli and Lexicographic (Sinclair) color coding method is well-known representation for POLSAR image. The Pauli color coding is based on a vector representation of linear combination of scattering matrix elements. The polarimetric channels, HH+VV, HH-VV and HV are associated to the blue, red and green colors respectively. Fig. 3 shows the polarimetric Pauli color coded image of the test site.

Over grass area the green color indicated a dominant HV component which is general in vegetated area.

The five trihedral reflectors denoted by Ps1 to Ps5 in the Ts4 and Ts5 areas of Fig. 3 are represented by white and magenta colors, and the wooden boxes and metallic media in the Ts3 area show similar characteristics. White color corresponds to equal amplitude area over all polarimetric channels and magenta color is the mixture of red and blue. The red color associate with HH-VV channel related to double bounce reflection and the blue color indicates the characteristic of surface scattering related to HH+VV channel. The trees area (in Ts1 and Ts2 areas of Fig. 3) shows the characteristic of equal amplitude over all polarization components and also green color was appeared especially at the sloping sides in the Ts1 and at a small hilly area in the Ts2 of Fig. 3.

Speckle noise causes a pixel-to-pixel variation in intensity and appeared as a granular pattern in SAR image. In early SAR technique, a common approach

to reduce speckle noise level is to average several independent estimates of reflectivity. The standard deviation of speckle can be reduced using the N-look processing. Table 1 listed the value of ratios as a function of the number of looks. These values in Table 1 are used very essential reference for speckle levels as function of multilooking. Additional averaging for SAR image by speckle filter can be applied to further reduce speckle noise level. Fig. 4 displays the span images in dB, the first row for original 1 ×4 multilook image and the ones applied speckle filters with 5×5 averaging window size. The speckle filters are used a traditional method such as boxcar, Gaussian, and Lopez filters and a new method such as the IDAN, the refined Lee, and the refined Lee sigma filters.

Fig. 4(b) to Fig. 4(g) show the span image from 5

×5 boxcar filter, 5×5 Gaussian filter, 5×5 Lopez filter, 5 ×5 refined Lee filter, IDAN filter of 50%, and the refined Lee sigma filter using s=0.9, respectively. The enlarged span images have a dimension of 300×300 pixels and zoomed 4 times for visual evaluation of the Ts1 to Ts5 areas in Fig. 3.

The original span image is for revealing the typical speckle characteristics of the 1×4 multilook image.

The values of the span image in Fig. 4 range -80 to 30 dB. The span images from the boxcar (Fig. 4(b)), from the Gaussian (Fig. 4(c)), and from the Lopez (Fig. 4(d)) filters exhibited the burring problem and resolution degradation, and also the square imprints pattern was appeared. The IDAN filter (Fig. 4(e)), the refined Lee filter (Fig. 4(f)), and the refined Lee sigma filter (Fig. 4(g)) showed a better filtering characteristic of eliminating the burring effect and preserving subtle details. The refined Lee filter in Fig.

4 showed its overall good filtering characteristic in retaining subtle details and strong target signatures while reducing speckle effect in homogeneous areas.

The Wishart supervised classification is well

(7)

known technique for the supervised classification of the POLSAR image data. The Wishart supervised classification scheme performs a ML statistical classification of POLSAR data based on the multivariate complex Wishart probability density function of second order matrix. The classifier learns the Wishart statistics of user-defined training areas and the whole data set is then classified by assigning

each pixel to the closest class using a ML decision rule. In this study, training cluster areas are selected for 6 classes - trihedral corner reflector, man-made targets, grass, broadleaved trees, coniferous trees, and shrubs. Fig. 5(a) shows the Pauli color coded image overlaid the selected 6 training areas and Fig. 5(b) to (i) display the corresponding photos of different terrain targets located in the test site.

Fig. 4. The span images in dB of the overall area and the enlarged images for Ts1 to Ts5 areas of Fig. 3: (a) original 1×4 multilook

image, (b) 5×5 boxcar filter, (c) 5×5 Gaussian filter, (d) 5×5 Lopez, (e) IDAN using 50%, (f) 5×5 refined Lee, and (g)

refined Lee sigma using s=0.9. The enlarged image has a dimension of 300×300 pixels zoomed 4 times.

(8)

Firstly, we classified the GB-SAR image data into four classes by using the trees as one class and then used full 6 classes to investigate the possibility of discriminating the type of trees using the polarimetric GB-SAR data. Fig. 6 shows the enlarged images of the Wishart supervised classification results after the boxcar and the refined Lee filters applied with different 3×3, 5×5, 7×7, and 9×9 window sizes.

The boxcar filter is a traditional filtering method and the refined Lee filter is a new filtering algorithm.

Comparing between the boxcar and the refined Lee filters, the boxcar filter showed the burring problem increasing filtering window sizes, whereas the refined

Lee filter did not. In Fig. 6 we can see that the smaller windows preserve the detail features but remain incorrect discriminations especially at outlines of the trees as shown in the Ts1 and Ts2 areas of Fig. 6C(a) and Fig. 6D(a). The less precise class discrimination in the 3×3 window results cause of the small number for sufficient filtering. The larger 9×9 window result showed that the tree’s shape expanded and merged into the other ones as shown in the Ts2 area of Fig.

6C(d) and Fig. 6D(d). We can see that precise details for terrain media in the GB-SAR image were preserved until smaller 5×5 windows, but the smaller windows also appeared uncertainty to Fig. 5. The 6 training cluster set for Wishart supervised classification (a) and the photos of different terrain targets in the test site. The

photos from (b) to (i) are connected to the corresponding training area by red dotted line.

(9)

discriminate the boundary on different media. From these result, it is considered that the 5×5 and 7×7 windows are better effective than 3×3 or 9×9 windows.

Table 2 listed the theoretical estimation results of the confusion matrix from six different filters. The values are the diagonal of the confusion matrix estimated from the 3×3, 5×5, 7×7, and 9×9 boxcar, Gaussian, Lopez, and the refined Lee filters, IDAN filter using 50% and 95%, and the refined Lee sigma filter using 0.5 to 0.9 for a sigma parameter.

The performance of a supervised segmentation

process is generally estimated via a confusion matrix

computed from the training data. The confusion

matrix summarizes the percentage of pixels

belonging to an original cluster. The diagonal of the

confusion matrix represent an ideal and error-free

segmentation. To evaluate the classification accuracy

when ground truth is not available, theoretical

classification errors can be calculated for a given set

of feature covariance matrices by integrating the

complex Wishart distributions. In the Wishart

Fig. 6. The enlarged supervised classification images of the Ts1 to Ts5 areas after the boxcar and the refined Lee filters applied with

different (a) 3×3, (b) 5×5, (c) 7×7, and (d) 9×9 window sizes during filtering processing. A and B display the classification

result for 4 class set and C and D for 6 class set.

(10)

supervised classification method, the Monte Carlo simulation is used to compute the theoretical estimation of classification accuracy.

As shown in Table 2, the boxcar, Gaussian, and Lopez filters have a filtering characteristic that increasing of window size improved the accuracy value of classification results. In IDAN and the refined Lee filters, they were affected less by window size. And the refined Lee sigma filter showed a prominent characteristic about the used sigma parameter for filtering processing. It is need to use over 0.8 in a sigma value for consistent class discriminations. In Table 2, the estimated percentages of the new filters such as the IDAN, the refined Lee, and the refined Lee sigma filters has lower accuracy

than ones of the three traditional filters. In particular, the class 2 (man-made targets) estimations of the new filters ranged 60% to 70% because of the small number of classified pixels. By increasing the averaging window size of speckle filtering, the theoretical estimations become more accuracy but cause the burring effect and the resolution degradation.

Fig. 7A and Fig. 7B show the Wishart supervised classification results categorized into four classes and into six classes respectively. Overall classification result shows that the Wishart supervised classification method is reliable and effective to discriminate the different terrain media of the polarimetric GB-SAR image. Fig. 6A(a) and Fig. 6B(a) show the Table 2. Theoretical diagonal estimation of confusion matrix for 4 classes and 6 classes sets applying different window size for

filtering process. The used window size is 3×3 for the classification processing Filters Class 4 Class Set6 Class Set

C1 C2 C3 C4 Total C1 C2 C3 C4 C5 C6 Total

3×3 Boxcar 94.71 74.88 98.38 99.15 91.78 96.75 70.29 93.59 81.48 79.31 99.89 86.89 5×5 Boxcar 97.88 81.86 99.6 99.29 94.66 99.35 78.99 92.63 83.95 93.1 100 91.34 7×7 Boxcar 100 87.91 99.8 99.21 96.73 100 87.68 96.15 90.12 100 100 95.66 9×9 Boxcar 100 93.49 100 99.15 98.16 100 94.2 97.44 93.83 100 100 97.58 3×3 Gaussian 87.3 65.12 96.97 98.62 87.00 94.81 65.94 88.78 83.95 78.16 99.57 85.20 5×5 Gaussian 95.77 75.81 98.79 99.15 92.38 96.75 72.46 90.38 82.72 83.91 99.92 87.69 7×7 Gaussian 97.88 80.93 99.39 99.23 94.36 97.4 78.26 92.95 83.95 90.8 100 90.56 9×9 Gaussian 100 85.12 100 99.21 96.08 100 85.51 94.87 91.36 95.4 100 94.52 3×3 Lopez 93.65 74.88 98.38 99.13 91.51 95.45 70.29 92.95 81.48 78.16 99.92 86.38 5×5 Lopez 97.88 81.86 99.6 99.26 94.65 98.05 78.26 92.63 83.95 93.1 100 91.00 7×7 Lopez 100 87.91 99.8 99.21 96.73 100 87.68 95.83 90.12 100 100 95.61 9×9 Lopez 100 93.49 100 99.15 98.16 100 93.48 97.44 93.83 100 100 97.46 IDAN 50 72.49 66.05 95.96 98.04 83.14 81.17 68.84 88.46 90.12 74.71 98.71 83.67 IDAN 95 73.54 66.98 95.96 97.43 83.48 81.17 65.94 88.46 90.12 75.86 98.6 83.36 3×3 Refined Lee 76.19 60.93 97.58 98.44 83.29 87.66 65.22 90.06 82.72 75.86 99.35 83.48 5×5 Refined Lee 76.72 62.79 97.37 98.76 83.91 87.01 70.29 91.03 85.19 75.86 99.76 84.86 7×7 Refined Lee 76.72 61.86 97.78 98.91 83.82 88.31 68.12 87.18 79.01 77.01 99.76 83.23 9×9 Refined Lee 78.31 62.33 97.98 98.97 84.40 88.31 65.22 89.42 77.78 72.41 99.76 82.15 Refined Lee sigma 0.5 0 0 89.49 22 27.87 0 0 82.37 82.72 68.97 20.28 42.39 Refined Lee sigma 0.6 0 0 96.36 79.3 43.92 0 10.14 82.69 80.25 71.26 95.91 56.71

Refined Lee sigma 0.7 0 0 55.96 0 13.99 0 0 74.36 51.85 17.24 0 23.91

Refined Lee sigma 0.8 61.38 53.49 95.96 98.73 77.39 83.12 62.32 83.97 81.48 72.41 99.57 80.48 Refined Lee sigma 0.9 79.37 61.4 96.57 98.84 84.05 90.26 62.32 84.29 82.72 72.41 99.57 81.93

Filters Class 4 Class Set 6 Class Set

C1 C2 C3 C4 Total C1 C2 C3 C4 C5 C6 Total

(11)

Fig. 7. Wishart supervised classification results of the polarimetric GB-SAR image. A and B display the examples for 4 class s et and for 6 class set, respectively. The used speckle filters are (a) original 1 × 4 multilook, (b) 5 × 5 boxcar, (c) 5 × 5 Gaussian, (d) 5 × 5 Lopez, (e) 7 × 7 boxcar, (f) 7 × 7 Gaussian, (g) 7 × 7 Lopez, (h) IDAN using 50%, (i) 5 × 5 refined Lee, (j) refined Lee sigma using 0.8, (k) IDAN using 95%, (l) 7 × 7 refined Lee, and (m) refined Lee sigma filters using 0.9. The 3 × 3 window size is applied for the classification processing.

(12)

classification results of the original 1 ×4 multilook images without speckle filtering processing. And the other ones of Fig. 7A and Fig. 7B are processed after applying speckle filters with 5×5 and 7×7 window sizes for the boxcar, Gaussian, Lopez, and the refined Lee methods. And the IDAN filter is used 50% and 95% and the refined Lee sigma is applied with 0.8 and 0.9 for a sigma parameter. The additional averaging of 3 ×3 window size is applied during supervised classification processing. These supervised classification results in Fig. 7 showed better discrimination than the unsupervised classification results as presented in the previous work (Kang et al., 2009) in which we could only discriminated between natural media and man-made targets.

The boxcar, Gaussian, and Lopez speckle filters showed less precise characteristics than the new filters as shown in Fig. 7A and Fig. 7B. These traditional filtering methods produced reliable discrimination results but remained burring problems and resolution degradation at overall area. To eliminate burring effect, these filters need to use smaller window size for filtering processing. The IDAN, the refined Lee, and the refined Lee sigma filters showed better characteristics of preserving subtle details and a strong target signature and removing the burring problem. The IDAN filter and the refined Lee sigma filter showed the effective performance in preserving subtle details. But the refined Lee sigma filter appeared burring effect at permanent scatterers than the other new methods and some unclassified pixels (gray color) are produced.

And the IDAN filter showed that some pixels in grass area were classified into class 2 (man-made targets) as shown in Fig. 7A(k). It seems that high- backscattering grass areas have a polarimetric characteristic similar to an artificial target.

Fig. 8A and Fig. 8B show the enlarged classification images of Fig. 7. As shown in the Ts1

and Ts2 area of Fig. 8B, the Wishart supervised classification method can discriminate trees into three types such as broadleaved, coniferous, and shrubs trees. The Ts1 area contained several ginkgo trees (Fig. 5(e)) at right part, two maple trees (Fig. 5(b)) at upper left, and pine trees (Fig. 5(g)) at lower left of the image. At the pine trees area, one big rock locates on the ground under pine trees as shown in Fig. 5(g).

The pixels in the pine tree area are classified into class 5 (coniferous trees) and class 1 (trihedral corner reflectors) as shown in the Ts1 area of Fig. 8B. The same area are also discriminated to class 3 (trees), class 1 (a trihedral corner reflector), and class 2 (a man-made target) using 4 training areas as shown in the Ts1 of Fig. 8A. The rock on the ground seems to act like a permanent scatterer.

The Ts2 area in the test site is densely planted with different trees such as juniper, rhododendron, and crape myrtle trees, and so on at a small hilly area. The rhododendron trees (Fig. 5(h)) classified into class 4 (shrubs), the juniper trees classified into class 5 (coniferous trees), and the crape myrtle trees which fall leaves in late autumn classified into class 3 (broadleaved trees). We can see that rhododendron trees show reliable classification result, but it is not clear to discriminate between broadleaved trees and coniferous trees in the Ts2 area. In Fig. 8A and Fig.

8B, some pixels nearby Ps3 in the left part of the Ts5 area was classified as a permanent scatterer and some area around of a wooden measurement box in the Ts3 area was also classified into class 1 (trihedral corner reflectors). These areas are assumed wet grass area.

From overall classification results, we confirm that the refined Lee filter is the most effective method to discriminate different terrain targets and preserve the precise details in the GB-SAR image, and the optimal window size is 5×5 and 7×7 for filtering process.

The other new filters such as the IDAN and the

refined Lee sigma filters also give a good

(13)

performance for the subtle details, but the refined Lee sigma filter shows the burring effect of a strong target signature at a permanent scatterer and also appears

the unclassified portion. And the IDAN filter shows less precise to discriminate some pixels in grass area and outline of trees than ones of the refined Lee filter.

Fig. 8. The enlarged images of Fig. 7: A and B display the examples for 4 class set and for 6 class set, respectively. The used speckle filters are (a) original 1×4 multilook, (b) 5×5 boxcar, (c) 5×5 Gaussian, (d) 5×5 Lopez, (e) 7×7 boxcar, (f) 7×7 Gaussian, (g) 7×7 Lopez, (h) IDAN using 50%, (i) 5×5 refined Lee, (j) refined Lee sigma using 0.8, (k) IDAN using 95%, (l) 7

×7 refined Lee, and (m) refined Lee sigma filters using 0.9. The 3×3 window size is applied for the classification processing.

(14)

4. Conclusions

In this paper, we presented the supervised classification results of the polarimetric GB-SAR images with several well-known speckle filtering such as boxcar, Gaussian, Lopez, IDAN, the refined Lee, and the refined Lee sigma filters. Wishart supervised classification method was used for the discrimination of the different terrain media. The refined Lee filter with the kernel size of bigger than 5

×5 showed the best result for the Wishart supervised classification of polarimetric GB-SAR image data.

The finally classified results of the polarimetric GB- SAR image data into four classes - a permanent scatterer, a man-made target, trees, and the grass demonstrated the potential capability of the polarimetric GB-SAR for the ground target classification. And the classified results using 6 classes where we divided the tree class into three sub classes - broadleaved, coniferous, and shrub trees showed that the type of trees could be discriminated by Wishart supervised classification of polarimetric GB-SAR image data.

Acknowledgements

This research was supported by a grant (07KLSGC03) from Cutting-edge Urban Development - Korean Land Spatialization Research Project funded by Ministry of Land, Transport and Maritime Affairs of Korean government.

References

Cloude, S. R. and E. Pottier, 1997. An Entropy Based Classification Scheme for Land Applications

of Polarimetric SAR, IEEE Transactions on Geoscience and Remote Sensing, 35(1): 68- 78.

Ferro-Famil, L., E. Pottier, and J. -S. Lee, 2001.

Unsupervised Classification of Multifrequency and Fully Polarimetric SAR Images Based on the H/A/Alpha-Wishart Classifier, IEEE Transactions on Geoscience and Remote Sensing, 39(11): 2332-2342.

Goodman, J. W., 1976. Some Fundamental Properties of Speckle, J. Opt. Soc. Am., 66(11): 1145-1150.

Goodman, N. R., 1963. Statistical Analysis Based on a Certain Multivariate Complex Gaussian Distribution (An Introduction), Annals of Mathematics Statistics, 34(1): 152-177.

Kang, M. -K, K. -E. Kim, H. Lee, S. -J. Cho, and J. - H. Lee, 2009. Preliminary Results of Polarimetric Characteristics for C-band Quad- Polarization GB-SAR Images Using H/A/α Polarimetric Decomposition Theorem, Korean Journal of Remote Sensing, 25(6):

531-546.

Kong, J. A., A. A. Swartz, H. A. Yueh, L. M. Novak, and R. T. Shin, 1988. Identification of Terrain Cover Using the Optimum Polarimetric Classifier, Journal of Electromagnetic Waves and Applications, 2(2): 171-194.

Lee, H., S. -J. Cho, N. -H. Sung, and J. -H. Kim, 2007a. Development of a GB-SAR (I):

System Configuration and Interferometry, Korean Journal of Remote Sensing, 23(4):

237-245.

Lee, H., S. -J. Cho, N. -H Sung, and J. -H. Kim, 2007b. Development of a GB-SAR (II):

Focusing Algorithms, Korean Journal of Remote Sensing, 23(4): 247-256.

Lee, J. -S. and E. Pottier, 2009. Polarimetric Radar

Imaging from Basics to Applications, CRC

(15)

Press, Boca Raton, FL, USA.

Lee, J. -S., M. R. Grunes, T. L. Ainsworth, L. -J. Du, D. L. Schuler, and S. R. Cloude, 1999a.

Unsupervised Classification Using Polarimetric Decomposition and the Complex Wishart Classifier, IEEE Transactions on Geoscience and Remote Sensing, 37(5): 2249- 2258.

Lee, J. -S., J. -H. Wen, T. L. Ainsworth, K. -S. Chen, and A. J. Chen, 2009. Improved Sigma Filter for Speckle Filtering of SAR Imagery, IEEE Transactions on Geoscience and Remote Sensing, 47(1): 202-213.

Lee, J. S., M. R. Grunes, and R. Kwok, 1994.

Classification of Multi-Look Polarimetric SAR Imagery Based on Complex Wishart Distribution, International Journal of Remote Sensing, 15(11): 2299-2311.

Lee, J. -S., M. R. Grunes, E. Pottier, and L. Ferro- Famil, 2004. Unsupervised Terrain Classification Preserving Polarimetric Scattering Characteristics, IEEE Transactions on Geoscience and Remote Sensing, 42(4):

722-731.

Lee, J.-S., M. R. Grunes, and G. de Grandi, 1999b.

Polarimetric SAR Speckle Filtering and Its Implication for Classification, IEEE Transactions on Geoscience and Remote Sensing, 37(5): 2363-2373.

Lim, H. H., A. A. Swartz, H. A. Yueh, J. A. Kong, and R. T. Shin, 1989. Classification of Earth Terrain Using Polarimetric Synthetic Aperture Radar Images, Journal of Geophysical Research, 94(B6): 7049-7057.

López-Martínez, C. and X. Fàbregas, 2003.

Polarimetric SAR Speckle Noise Model, IEEE Transactions on Geoscience and Remote Sensing, 41(10): 2232-2242.

López-Martínez, C., E. Pottier, and S. R. Cloude, 2005. Statistical Assessment of Eigenvector- Based Target Decomposition Theorems in Radar Polarimetry, IEEE Transactions on Geoscience and Remote Sensing, 43(9): 2058- 2074.

Ulaby, F. T., T. F. Haddock, and R. T. Austin, 1988.

Fluctuation Statistics of Millimeter-Wave Scattering from Diatributed Targets, IEEE Transactions on Geoscience and Remote Sensing, 26(3): 268-281.

van Zyl, J. J. 1989. Unsupervised Classification of Scattering Behavior Using Radar Polarimetry Data, IEEE Transactions on Geoscience and Remote Sensing, 27(1): 36-45.

Vasile, G., E. Trouvé, J. -S. Lee, and V. Buzuloiu, 2006. Intensity-Driven Adaptive-Neighborhood Technique for Polarimetric and Interferometric SAR Parameters Estimation, IEEE Transaction on Geoscience and Remote Sensing, 44(6):

1609-1621.

Vasile, G., E. Trouvé, M. Ciuc, P. Bolen, and V.

Buzuloiu, 2005. Intensity-Driven-Adaptive- Neighborhood Technique for POLSAR Parameters Estimation, in Proc. Geoscience and Remote Sensing Symposium, Seoul, Korea, 2005, VIII: 5509-5512.

Yueh, H. A., A. Swartz, and J. A. Kong, R. T. Shin,

and L. M. Novak, 1988. Bayes Classification

of Terrain Cover Using Normalized

Polarimetric Data, Journal of Geophysical

Research, 93(B12): 15261-15267.

수치

Fig. 1.  Speckle formation (Lee and Pottier, 2009, p. 102).
Fig. 2.  The GB-SAR system (a) and the test site inside KIGAM field (b and c). The (d) is the photo of a trihedral corner reflector used as a RCS reference.
Fig. 3.  The polarimetric Pauli color coded image of 1×4 multilook (Red: HH-VV, Green: HV, Blue: HH+VV).
Fig. 4.  The span images in dB of the overall area and the enlarged images for Ts1 to Ts5 areas of Fig
+5

참조

관련 문서

Department of Japanese Language and Literature, Graduate School, Cheju National University. Supervised by Professor

• 음식물 폐기물: collected by trucks  food waste 

• Controlled decomposition of organic materials such as plant materials, animal waste, food.. waste, and wastewater sludge

Construction New construction sites, road repair sites, demolition of  buildings.

It considers the energy use of the different components that are involved in the distribution and viewing of video content: data centres and content delivery networks

The 1990 American College of Rheumatology Classification Criteria for Wegener’s Granulomatosis and Churg-Strauss Syndrome (Data obtained from ref. 12, 13).. Wegener's

After first field tests, we expect electric passenger drones or eVTOL aircraft (short for electric vertical take-off and landing) to start providing commercial mobility

1 John Owen, Justification by Faith Alone, in The Works of John Owen, ed. John Bolt, trans. Scott Clark, "Do This and Live: Christ's Active Obedience as the