Original Article
심근 관류 SPECT에서 핵종에 따른 Uniformity correction map 설정을 통한 영상의 질 비교서울아산병원 핵의학과
송재혁·김경식·이동훈·김성환·박장원
The difference of image quality using other radioactive isotope in uniformity correction map of myocardial perfusion SPECT
Jae hyuk Song, Kyeong Sik Kim, Dong Hoon Lee, Sung Hwan Kim and Jang Won Park
Department of Nuclear Medicine, Asan Medical Center, Seoul, KoreaPurpose When the patients takes myocardial perfusion SPECT using
201
Tl, the operator gives the patients an injection of201
Tl. But the uniformity correction map in SPECT uses99m
Tc uniformity correction map. Thus, we want to compare the image quality when it uses99m
Tc uniformity correction map and when it uses201
Tl uniformity correction map.Materials and Methods Phantom study is performed. We take the data by Asan medical center daily QC condition with flood phantom including
201
Tl 21.3 kBq/mL. After postprocessing with this data, we analyze CFOV integral uniformity(I.U) and differential uniformity(D.U). And we take the data with Jaszczak ECT Phantom by American college of radiology accreditation program instruction including201
Tl 33.4 kBq/mL. After post processing with this data, we analyze spatial Resolution, Integral Uniformity(I.U), coefficient of variation(C.V) and Contrast with Interactive data language program.Results In the flood phantom test, when it uses
99m
Tc uniformity correction map, Flood I.U is 3.6% and D.U is 3.0%.When it uses
201
Tl uniformity correction map, Flood I.U is 3.8% and D.U is 2.1%. The flood I.U is worsen about 5%, but the D.U is improved about 30% inversely. In the Jaszczak ECT phantom test, when it uses99m
Tc uniformity correction map, SPECT I.U, C.V and contrast is 13.99%, 4.89% and 0.69. When it uses201
Tl uniformity correction map, SPECT I.U, C.V and contrast is 11.37%, 4.79% and 0.78. All of data are improved about 18%, 2%, 13% The spatial resolution was no significant changes.Conclusion In the flood phantom test, Flood I.U is worsen but Flood D.U is improved. Therefore, it’s uncertain that an image quality is improved with flood phantom test. On the other hand, SPECT I.U, C.V, Contrast are improved about 18%, 2%, 13% in the Jaszczak ECT phantom test. This study has limitations that we can’t take all variables into account and study with two phantoms. We need think about things that it has a good effect when doctors decipher the nuclear medicine image and it’s possible to improve the image quality using the uniformity correction map of other radionuclides other than
99m
Tc,201
Tl when we make other nuclear medicine examinations.Key Words Uniformity correction map, contrast, uniformity,
201
Tl SPECT6)
∙Received: October 02. 2015 Accepted: October 13. 2015
∙Corresponding author: Jae Hyuk Song
∙Department of Nuclear Medicine. Asan Medical Center.
388-1 Pung nap 2-dong Song pa gu. Seoul 138-736. Korea Tel : (02) 3010-4608 Fax: +82-2-3010-5429
E-mail: [email protected]
서 론
SPECT (Single photon emission computed tomography) 에
서 Uniformity는 균일한 방사능을 갖는 선원에 대해서 균일
한 영상을 제공하는 능력이다. SPECT에서는 다양한 이유로
Fig. 1. This is Ventri(General Electric Healthcare, USA)
Fig. 2. This is Flood Phantom
Fig. 3. This is Jaszczak ECT Phantom (Data Spectrum, USA)
Fig. 4. This analysis tool is Xeleris ver 2.05 (General Electric Healthcare, USA)
영상에서 불균일이 발생하고 있으며, 이는 영상에 artifacts 를 유발하여 임상적으로 진단에 악영향을 줄 수 있다. 이를 보정하기 위해 여러 보정 방법이 시행되고 있다. 이 중 Uniformity correction map 은 검사에 사용하는 동위원소를 이용하여 Map을 설정하여, 이를 통해 불균등한 Image의 변 동폭을 최소한으로 낮춰 주는 역할을 하고 있다 1-3) . 본원에 서 시행되고 있는 Myocardial SPECT 검사는 Thallium을 이 용하여 검사가 진행되고 있지만, 99m Tc 의 Uniformity correction map 이 적용되어 있다. 따라서 본 논문은 201 Tl 으로 심근 SPECT 검사 시 99m Tc 과 201 Tl 각각의 핵종으로 Uniformity correction map 을 설정하였을 때, 영상의 질에 차 이가 있는지 비교해보고 영상의 질을 향상시킬 수 있는 방안 에 대하여 모색해 보고자 한다.
실험방법 및 재료
1. 실험 기기 및 재료실험 장비로 심장 검사 Gamma camera인 Ventri(General
Electric healthcare, USA) 에 LEGP(Low Energy General
Purpose) collimator 를 장착하였다(Fig. 1). Phantom 실험을 위
해 Flood phantom , Jaszczak ECT Phantom (Data Spectrum,
USA) 이 사용하였다(Fig. 2) (Fig .3). 그리고 영상 분석에는
Xeleris ver 2.05(General Electric Healthcare, USA) 와
Interactive Data Language(Exelis visual information solutions,
USA) 프로그램을 이용하였다 (Fig. 4)(Fig. 5) .
Fig. 5. This analysis tool is Interactive Data Language (Exelis visual information solutions, USA)
2. 실험방법
1) Uniformity Mapping
ACR 에서 권고하는 방법으로 Collimator를 제거한 상태에 서 Detector 표면 중심으로부터 2.5 m 떨어진 지점에 1 cc 주 사기에 99m Tc 25.9 Mbq, 201 Tl 14.8 Mbq 의 방사성 동위원소를 주입한 point source를 위치하였다. 영상 획득을 위한 Count 는 장비 사에서 권고하는 6X10 7 count 로 Detector 1, Detector 2 에 대하여 99m Tc 와 201 Tl 각각의 방사성 동위원소로 Uniformity Mapping 을 실시하였다 4) .
2) Flood phantom test
Flood Phantom 에 201 Tl 을 21.3 kBq/mL를 주입하여 Phantom 을 제작하였다. 이 Phantom을 이용하여 본원에서 사용되는 Daily QC 조건에 의하여 총 4X10 6 count 의 데이터 를 획득한 후 CFOV Integral uniformity, Differential uniformity 의 두 항목에 대하여 비교 평가하였다.
3) Jaszczak ECT Phantom test
Jaszczak ECT Phantom (Data Spectrum, USA) 에 201 Tl 을 33.4 kBq/mL 를 주입하여 Phantom을 제작하였다. 이 Phantom 을 이용하여 Matrix size는 128 x 128, 이중 에너지 창 을 이용하였고(70 keV±15%, 167 keV±10%), ACR (American college of Radiology) acquisition time equation 에 따라 sec를
계산하여 총 Count가 3.2X10 7 count 가 되도록 60 views를
99m Tc 와 201 Tl 각각에 대하여 데이터를 획득하였다 5) (Fig. 6).
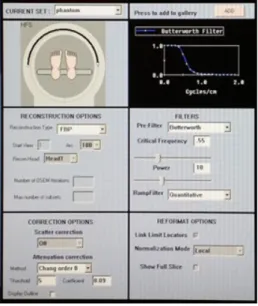
영상 재구성으로는 Xeleris ver 2.05(General Electric Healthcare, USA) 프로그램으로 모든 영상에 동일한 SPECT 옵션으로 FBP, Butterworth filter (critical frequency; 0.55 power; 10) 를 적용하고 scatter correction (chang’s order; 0 threshold; 5 coefficient; 0.09) 을 적용하였다. 획득한 데이터에 대하여 Integral uniformity, Contrast, Coefficient of variation, Spatial resolution 의 네 항목에 대하여 비교 평가하였다.
Fig. 6. Jaszczak ECT phantom including 201 Tl image acqusition
4) 영상 비교 분석
Flood Phantom 으로 획득된 데이터는 Xeleris ver 2.05 (General Electric Healthcare, USA) 프로그램으로 아래와 같 은 식에 의해서 Integral uniformity, Differential uniformity을 산출하였다. 6-7)
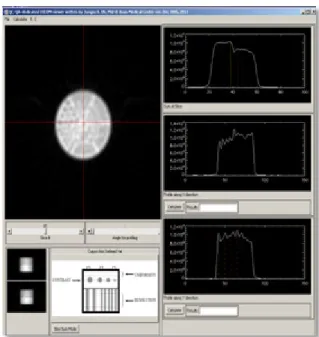
Jaszczak ECT Phantom 으로 획득된 데이터를 본원에서 자 체 개발한 Interactive Data Language (Exelis visual information solutions, USA) 프로그램에 입력하여 아래와 같 은식에 의해서 Integral uniformity, Contrast, Coefficient of variation 을 산출하였다. 8)
SPECT I.U =
min min
X 100
Contrast =
Table. 1. Flood integral uniformity and differential uniformity value (%) with Flood phantom
CFOV Flood I.U(%) CFOV Flood D.U(%)
99m Tc
3.6 3.0201
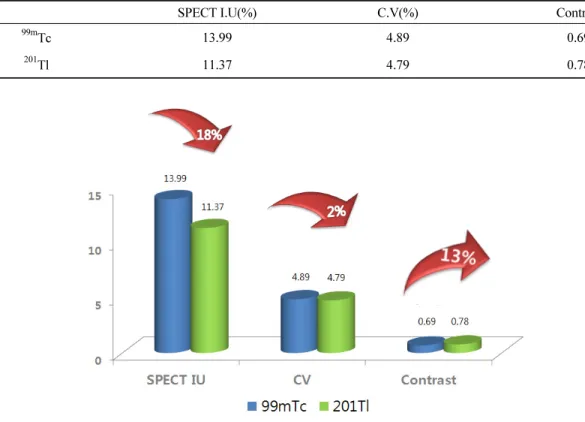
Tl 3.8 2.1Table. 2. SPECT Integral uniformity, coefficient of variation (%) and contrast with Jaszczak ECT phantom
SPECT I.U(%) C.V(%) Contrast
99m
Tc 13.99 4.89 0.69201
Tl 11.37 4.79 0.78Fig. 7. The comparison with other radionuclide uniformity correction map of Jaszczak ECT phantom test value
Fig. 8. (A) Jaszczak ECT phantom spatial resolution using 99m Tc uniformity correction map
(B) Jaszczak ECT phantom spatial resolution using 201 Tl uniformity correction map
결 과
1. Flood phantom test99m Tc 에서의 Flood I.U값은 3.6%, Flood D.U값은 3.0%으 로 나타났고, 201 Tl Flood I.U 값은 3.8%, Flood D.U값은 2.1%
으로 나타났다. 201 Tl 으로 uniformity map을 설정하였을 때, Flood I.U 값은 5% 감소하였으나, Flood D.U 값은 30% 향상 된 수치를 나타내었다(Table 1).
2. Jaszczak ECT Phantom test