- 65 -
AIS를 활용한 인천항 선박의 온실가스 배출량 추정*
Sadaqat Khan
*․ 장영태
**․이수형
***․ 최경숙
****Assessment of greenhouse gas emissions from ships operation at the Port of Incheon using AIS
Sadaqat Khan
**․ Young-Tade Chang
***․ Suhyung Lee
****․ Kyoung-Suk Choi
*****Abstract
This paper attempts to estimate GHG emissions, primarily CO
2ship emissions, at the port of Incheon in October 2014. This study employed a bottom-up approach based on Automatic Identification System (AIS) data to estimate the total amount of fuel consumption and the total amount of CO
2emission produced as a result of fuel combustion. Using a sample of 330 ships operating at the port of Incheon in Korea, the total amount of CO
2gases emitted from ships in October 2014 were estimated to be 164693.06 tons, with estimated total fuel consumption of 51953.64 tons. General cargo ships were most common type of ships, but they were less polluting compared to passenger ships. The detailed emission estimates by ship type revealed that passenger ships were the most polluting ships (81409.6 tons of emissions), followed by tugboats (37248.4 tons), cargo ships (32154.6 tons), ships used for other activities (9039.1 tons), chemical tankers (4027.06 tons), and fishing ships (814.048 tons), respectively.
Key words: AIS, GHG, Ship CO
2Emission, Incheon Port, Bottom-up Approach
▷ 논문접수: 2018. 02. 20. ▷ 심사완료: 2018. 03.19. ▷ 게재확정: 2018. 03. 26.
*This work was supported by Inha Research Fund (52855).
** 인하대학교 물류전물대학원 석사, 제1저자, [email protected]
*** 인하대학교 물류전문대학원, 교수, 교신저자, [email protected]
**** 인하대학교 물류전문대학원, 박사과정, 공동저자, [email protected]
***** 중국산동사범대학교, 박사, 공동저자, [email protected]
Ⅰ. Introduction
Many studies have been conducted to measure ships exhaust emissions and to quantify their contribution to overall atmospheric pollution and resulting climate change or global warming. The findings suggested that due to increasing mar- itime traffic, ship exhaust emissions have become a significant source of atmospheric pollution.
Emissions from maritime traffic contribute a very small portion of the total atmospheric pollution compared to that of rail and other means of land and air transportation though.
The shipping industry has become a key com- ponent of the global trade and world’s economy. More than 80% of global trade is car- ried by sea. Ship transportation is generally con- sidered as an environmentally friendly mean of transportation. However, the relative share of emissions from shipping has increased during the past years due to rapid technological advance- ment compared to land and air transportation and other industries. The ships are enlarged with more load carrying capacity. On the other hand, there is an increasing concern of climate change and global warming at societal, corporate and governmental levels. One of the biggest chal- lenges for governments both at national and in- ternational level is to reduce or limit the emis- sions of greenhouse gases (GHG), mainly CO
2.
Several studies suggest that ship emissions have become major source of air pollution for cities adjacent to main ports and these emissions have negative effects on local residents causing acid rains and degrading air quality and leading to severe health problems such as cardio and
respiratory diseases in common. However on a larger scale, according to recent report issued by United Nation Office for Disaster Risk Reduction (UNISDR) titled “The Human Cost of Weather Related Disasters” reveals that on average 335 weather-related disasters were recorded per year between 2005 -14, an increase of 14% which is almost double compared to the level recorded during 1985-95. 87 million homes were damaged or destroyed over the period of the survey. The report also highlights that 2.3 billion people were affected by floods and killing 157,000;
While storms affected 330 million people and kil- led 242,000, drought affected 1.1 million people and killing 22,000 people; While 94 million were affected by extreme temperature killing 164,000 people and similarly 8 million were affected and 20,000 were killed by land sliding and wildfire.
These all weather related disasters were a result of global warming and associated with high CO
2emissions.
The objective of this study is to measure GHG particularly CO
2emissions from ships at the port of Incheon.
The paper is structured as follows. Section 2 overviews the literature on estimation of ships emissions. Section 3 describes data and method- ology adopted in the study. Section 4 discusses the empirical results. Finally the paper concludes suggesting areas for further research.
II. Literature Review
Various studies on GHG emissions from ships
operation were undertaken in different ports of
the world.
Ugur Kesgin and Nurten Vardar (2001) con- ducted a study on exhaust gas emissions from ships in Turkish Straits, namely Bosphorus and Canakkale in Istanbul. In this paper, the general characteristics, the main engine systems, the fuel types, cruising times and speeds of all ships were taken into account for calculating fuel consumption. The results show that the transit ships caused more than half the total amount of emissions from ships on the Bosphorus, as calcu- lated NOx emissions on the Bosphorus were 2720 t from domestic passenger ships and 4357 t from transit ships.
J. Isakson et al. (2001) measured ship emis- sions and their effects in the harbor of Goteborg in Sweden using multivariate analysis. From 250 ship plumes annual emissions of SO
2and NO
2were estimated to be 220 and 115 kg km
-2yr
-1. Environmentally Heavy Metal Pollutants were pos- itively correlated with Nitrous oxide emissions from ships.
D.A. Cooper (2003) investigated exhaust emis- sions from six ships at berth and during their usual operations, such as hoteling, unloading and loading activities. The results indicate significant changes between different engines among differ- ent ships, as well as for the same type of en- gines used on board. Also emissions from boiler use and possible main engine warm up before departure were less compared to those smaller auxiliary engines. Furthermore, the results ob- tained for the three passenger ferries suggested that empirically derived, emission formulae using dead weight tonnage can be accurate for harbour emission inventories.
H. Saxe and T. Larsen (2004) conducted a
study using operational meteorological air quality model to calculate the urban dispersion of air pollutants emitted from ships in three sea ports of Denmark, namely Copenhagen, Elsinore and Koge. The ships in both Copenhagen and Elsinore harbour’s contributed considerably less to urban pollution with SO
2after the im- plementation of expected regulations on sulphur content in bunker fuels. However, PM10 emis- sions from ships in Copenhagen potentially led to health problem for residents living or working close to the harbour (0.2-0.4% EC’s limit). On the other hand due to low activity in the Koge harbour the resulting impact on urban air quality was insignificant.
Satish Vutukuru and Donald Dabdub (2008) performed a study for modeling the effects of ocean going ships emission on ozone and coastal air quality of Southern California. The PM con- centrations were measured using UCICIT model for the year 2002 and simulated forecast was generated till 2020. The results revealed that con- trolling ships emissions reduced air pollution and forecasted impact areas were along the coast and as well as inland locations.
S. B. Dalsøren et al. (2009) took into ac-
count ships’ different specifications along its
global port arrival and departure based on data
set of 32000 merchant ships and about 2 million
global ship observations. The fuel consumption
methodology was used to make global emission
inventories for a wide range of pollutants dis-
tributed geographically. Furthermore, a global
Chemical Transport Model (CTM) was used to
calculate the environmental impacts of the
emissions. The results show that ship emissions
were also major source of pollution for world’s ocean to surface concentration of nitrogen diox- ide and sulphur dioxide and these emissions had severe impact on ozone in some regions.
Emissions were concentrated at large over coastal zones. The container ships traffic was the largest emitter by ship type and made most impacts, followed by bulk ships and tank ships.
Cengiz Deniz and Alper Kilic (2009) examined exhaust gas emissions from ships in one of the main ports in Marmara Sea , Ambarlı port, Turkey, for the base year of 2005. The study es- timated total emissions consisting of different pol- lutants from ships in the port area and a model program was used to estimate the dispersions of those emissions, with the real topographic and meteorological conditions. The results suggested that emissions contributed 100 µgm
-3NOx and 55 µgm
-3SO
2to ambient air concentrations in range of 2 km from the port. This highlights the possi- bility of affecting people around 60000 estimated to be living within that range due to combina- tion of different sources.
Warren B. Fitzgerald et al. (2011) assessed GHG from New Zealand’s international maritime transport of goods, mainly their import and export. The results differed between activity based and fuel based methodologies in measur- ing a single country's emissions.
Ernestos Tzannatos (2010) conducted a study using fuel based methodology to assess exhaust emissions for 25 years for both international and domestic shipping within Greek Sea’s and also monetized their externalities for 2008. The result finding suggest annual average increase rate of 2.85% from ships emissions which were esti-
mated to be 12.9MT with externalities of 3.1€
billion Euros.
Ernestos Tzannatos (2010) carried out a similar study to estimate ships exhaust emissions and quantify externalities using activity based ap- proach at the port of Piraeus for 2008-09. The annual emissions of pollutants reached up to 2600 tons, whereas the externalities were up to 51 million Euros during the study period.
Volker Matthias et al. (2010) assessed the im- pact of emissions in Northern Sea’s coastal areas, using a three dimensional Eulerian chem- istry transport model for 2000. Germany and Denmark were more affected in the region due to pollutants from ships emissions. Furthermore, SO
2was condirably reduced due to im- plementation of sulphu emission control area (SECA).
Veronika Eyring et al. (2010) examined the impact of ship emissions on atmosphere and climate. The emissions spaning within range of 400km affected air quality and mostly coastal population. The results also indicate that decreas- ing sulphur emissions would result in decrease in their negative radiative forcing at regional level as well.
Apollonia Miola and Biagio Ciuffo1 (2011) ana-
lyzed several studies on grounds of different ap-
proaches and different data sources that were
used, for the purpose of modeling. The finding
reveals that estimation of emission based on fuel
statistics leads to underestimation, and also there
is a degree of uncertainty among the results due
to different methodologies and different data
sources were used, so further investigation was
required using a detailed bottom-up approach.
This study also emphasized on use AIS data and also presented a systematic approach for using different data sources for both domestic as well as international shipping to obtain accurate results.
D. Contini (2011) measured the impact of ships traffic on atmospheric levels and resulting particulate matters (PM) and polycyclic aromatic hydrocarbons (PAHs) at harbour of Venice, using high temporal resolutions along with data on wind direction and information on ships passages. The results show PM levels contributed from 1 to 8% while the PAH’s contribution was up to 10% in gaseous state.
Gara Villalba and Eskinder Demisse Gemechu (2011) estimated GHG from ships emissions at the port of Barcelona including both land and sea based emissions for 2008. The results shows 331MT of CO
2Equivalent emissions, 50% of which were assigned to ships movement at sea while remaining half were ascribed to land based emissions. The highest emitters were auto car carriers based on cargo handled.
Joseph Berechman and Po-Hsing Tseng (2012) conducted a study using bottom-up approach to measure environmental cost arising from ships emission in the port of Kaohsiung, Taiwan, for 2010. The main polluters were tankers, container ships and bulk carrier followed by trucks and the environmental cost for both ships and trucks were over 123$ million dollars annually.
P.S. Yau et al. (2012) measured exhaust emis- sions from ocean going ships in Hong Kong, by performing activity based approach and using AIS data for 2007. Showing total emissions of 37150t the regions close to East Lamma channel and container port were identified as highest emission
locations using spatial allocation.
Clara Schembari et al. (2012) conducted a study based on instruction of European Union, requiring them to estimate air pollution in Mediterranean harbour’s for 2010. It measured the effect after the implementation of Sulphur Emission Control Areas (SECA), in which ships were directed to use fuel having sulphur content less than 0.1%. The study found 66% reductions in SO
2emissions on daily basis for the 3 har- bours except Barcelona harbour.
Ching-Chih Chang and Chih-Min Wan (2012) estimated emissions to analyze the effectiveness of green port policies and appraised different strategies for Kaohsiung harbor in Taiwan used for reducing pollutants. The studies suggested a strategy of decreasing ship speed to 12knots, in order to reduce fuel consumption and their re- sulting emissions. Also using land based power for ship for their onboard activities could reduce CO
2by 57 % whereas PM up to 39%.
Halil SaraçoLlu et al. (2013) used ships activity based method to investigate ships exhaust emis- sions for the port of Izmir, Turkey. The ships calling Izmir port were the main source of air pollution in the area which could possibly affect the local population.
Chang et al. (2013) measured GHG emissions
from ships operations using bottom up approach
based on individual ship characteristics and using
the data on ships processed by Incheon Port for
2012. The emissions were 5 times higher com-
pared to the emission results obtained through
top down approach. The key polluting ships
were identified as international car ferries fol-
lowed by full container ships and the key pollut-
ing activities were passing through lock gates and approaching the dock which together ac- counted for 96% of the total emissions.
Minjiang Zhao et al. (2013) conducted a study to identify air pollutants due to marine traffic and their characteristics for the Port of Shanghai.
On average hourly SO
2and NO
2concentrations in Shanghai Port were 29.4 and 63.7µgm
-3re- spectively, and average daily concentrations of TSP and PM
2.5were 114.39 and 62.60 µgm
-3. Furthermore ship traffic had a significant con- tribution to atmospheric levels of fine particles.
P.S. Yau et al. (2013) investigated the con- tribution of ships emissions that resulted in fine particulate in community surrounding at the port of Hong Kong for the period of Aug 2009 to Mar 2010. Samples of PM were selected from both residential as well as from the port area and PMF analysis was used to identify eight po- tential sources. The proportion of ships emissions to PM
2.5was 7.6µgm
-3which accounted for 25%
compared to average total of 30.5µgm
-3.
Sang Keun Song and Zang Ho Shon (2014) used activity based method to analyze exhaust emissions from ships at Busan port for the peri- od of 2006-09, and also forecasted emissions for the year 2020 and 2050. The findings revealed that majority of emissions were related to con- tainer ships and were observed near port area.
The forecasted emissions were estimated to be 6 times higher compared to that of base year 2009.
Fan Zhang et al. (2014) carried out a study to identify and measure emissions from ships at Bohai Rim, using air mass analysis together with temporal distribution. The fine particles concen- tration during spring season was more compared
to that of winter.
Chang et al. (2014) conducted a detailed study using bottom up approach to measure noxious gasses from ships operation at the port of Incheon. International car ferries and full contain- er ships were high polluter and the majority of the emissions were observed during the cruise phase. However, the study only addressed meas- uring noxious gases, but not the CO
2emissions, which are major contributor to the global warm- ing and climate change.
Jonathan Coello et al. (2015) measured atmos- pheric emissions resulting from a group of fish- ing ships in UK, using both AIS activity and fuel based methodologies. The AIS activity based emission results were significantly high while the fuel based emission results were much lower.
In short, very limited studies have been car- ried out in this field, using various method- ologies and data sources. Reviewing the literature reveals that the use of top-down approach (based on fuel statistics) leads to underestimation of emissions while bottom-up is more appro- priate methodology resulting in accurate estima- tion of emissions.
Most studies were focused on domestic ports, because the pollutants have more negative im- pact on nearby residents compared to those in open seas. Moreover, few studies were under- taken to formulate policies and strategies to re- duce noxious gasses emission as well as other GHG such as CO
2that is main source of global warming.
This research has originality and contributions
to the literature in that using bottom up ap-
proach based on the AIS data at the Port of
Incheon as previous studies employed mostly top-down approach or non-AIS based bottom-up approach. Summary of comparisons among exist- ing works can be seen in Appendix.
Ⅲ. Data Description and Methodology
Different methodologies and data sources can be used to estimate fuel consumption and their resulting emissions as outlined previously in liter- ature review. This study employed AIS data and the sample consisted of 330 ships out of total 602 ships which operated at the port of Incheon during the period of October, 2014. The data was collected in cooperation with the Incheon Port Authority and the Korea Maritime Institute.
In total 272 ships were excluded due to missing data, in which 3 were hazard goods ship and 4 were pilot boats and other 263 were excluded due to the lack of information on gross tonnage;
engine load factor; its design and operating speed. Some ships with gross tonnage less than 300 (GT) were not equipped with AIS system so had to be excluded. The IMO’s International Convention for the Safety of Life at Sea, requires international voyaging ships with gross tonnage of 300 or more tons to have an AIS system, and for all passengers ships it is mandatory regardless of size.
AIS is a technical system that makes it possi- ble to monitor ships from other ships, and from shore based stations. AIS-equipped ships con- tinuously transmit a short message containing in- formation of position, course over ground (COG), speed over ground (SOG), heading, etc.
This study used AIS- based bottom up ap-
proach taking into consideration the type of ship along with its specification. The detailed date, time stamp information and speed on ground (operating speed) obtained from AIS data for each ship were thoroughly investigated and were used to calculate exact time spent (hours) and the distance
1)covered (NM) by individual ship.
The Date and Time information was provided in the form of a UNIX date (14 digits) rather than the more familiar YYYY/MM/DD HH:MM:SS format. Firstly it was converted into
"YYYY-MM-DD HH:MM:SS" format and later on calculated the difference between two time stamps/or intervals (rt= t2-t1) and expressed it in- to seconds and later on converted into hours to be used for calculating distance by multiplying speed (nm) by time in hours.
First of all, we had to estimate the total amount of fuel consumed by each ship during its motion of each activity or stage. Corbett et al. (2009) estimated a ship’s fuel consumption for a given navigation distance by considering the amount of fuel required for main and auxil- iary engines on a daily basis. Fuel consumption by the main engine follows the cubic law of the design and operational speed. Chang and Wang (2012) and Chang et al. (2013) both employed the same methodology to estimate GHG emis- sions at Kaohsiung harbor and port of Incheon, respectively. However, the two previous papers did not use AIS data, which enables us to esti- mate the emissions more accurately. The data on main engine power; auxiliary engine power; fuel
1) D (distance in nautical miles) = Speed (knots) x
Time (hours)
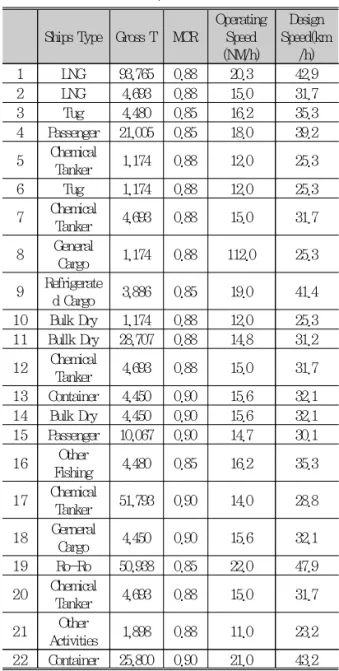
consumption rate; load factor; ship design speed were obtained from previous study of Chang et al. (2013) which is listed in Table 1. That covers most of the ships operated at the port of Incheon. This approach holds the idea of captur- ing fuel consumptions of the engines (main and auxiliary) between location points in a leg.
Table 1. Data on Engine Operating Speed and Design Speed
Ships Type Gross T MCR
Operating Speed (NM/h)
Design Speed(km
/h)
1 LNG 93,765 0.88 20.3 42.9
2 LNG 4,693 0.88 15.0 31.7
3 Tug 4,480 0.85 16.2 35.3
4 Passenger 21,005 0.85 18.0 39.2 5 Chemical
Tanker 1,174 0.88 12.0 25.3
6 Tug 1,174 0.88 12.0 25.3
7 Chemical
Tanker 4,693 0.88 15.0 31.7 8 General
Cargo 1,174 0.88 112.0 25.3 9 Refrigerate
d Cargo 3,886 0.85 19.0 41.4 10 Bulk Dry 1,174 0.88 12.0 25.3 11 Bullk Dry 28,707 0.88 14.8 31.2 12 Chemical
Tanker 4,693 0.88 15.0 31.7 13 Container 4,450 0.90 15.6 32.1 14 Bulk Dry 4,450 0.90 15.6 32.1 15 Passenger 10,067 0.90 14.7 30.1 16 Other
Fishing 4,480 0.85 16.2 35.3 17 Chemical
Tanker 51,793 0.90 14.0 28.8 18 Gerneral
Cargo 4,450 0.90 15.6 32.1
19 Ro-Ro 50,938 0.85 22.0 47.9
20 Chemical
Tanker 4,693 0.88 15.0 31.7 21 Other
Activities 1,898 0.88 11.0 23.2 22 Container 25,800 0.90 21.0 43.2
The fuel consumption by a ship at each stage of its port movement is denoted as:
․
․
Eq
2).(1) Whereas,
F
ijk= is the amount of fuel consumed by ship k moving from point i to j;
MF
k= is the daily fuel consumption by the main engine;
AF
k= the daily fuel consumption by the auxiliary engine;
S
1k= the ship’s operating speed
3)(nm/h);
S
0k= is the ship’s design speed (nm/h) and
d
ij=is the distance from i to j.
Secondly, after measuring the fuel con- sumptions, the next step was measuring GHG using conversion factors. Normally CO
2emis- sions are measured based on fuel combustion.
For the purpose of simplicity, it was assumed that all the ships were using bunker fuel, al- though different type of fuel could be used con- sidering the type of ship, (in general, the bunker fuel is widely used and contains 86.4% of car- bon per unit weight). In addition, the ratio of CO
2to carbon is known to be 44/12.
Therefore, CO
2emissions from fuel com- bustion can be estimated as follows:
2) All the equations are adopted from Chang, Y., Song, Y., & Roh, Y. (2013), Assessing greenhouse gas emissions from port ship operations at the Port of Incheon. Transportation Research Part D, 25, pp.1-4.
3)Operating Speed was already given for each ship at
each date-time stamp and denoted by “speed on
Ground”. Only values for designed speed were
obtained from the table 1.
S/
No.
No.
of Ships
Ship Type
Fuel Consumption
Average Per Unit
1 160
Cargo
Ships 10143.429 63.396
2 11
Fishing
ships 256.798 23.345
3 61
Other
ships 2851.459 46.745
4 23
Passenge
r ships 25681.293 1116.5 78
5 43
Chemical
Tankers 1270.366 29.543
6 32 Tugboats 11750.304 367.19
7
330
Total Fuel Consump
tion
51953.649
․
․∑
*∑
Eq.(2)
․∑
․
․
Eq(3)
Ⅳ. Empirical Results
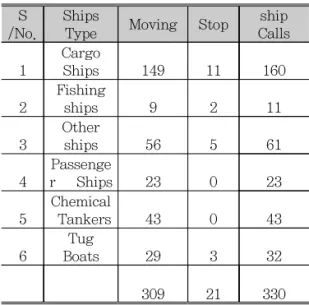
The total amount of fuel consumed by all the ships (330) from the movement of its arrival to departure was estimated to be 51953.6 tons. The ship call figures in Table 2 show that the gen- eral cargo ships used the port of Incheon most frequently, followed by chemical tankers; tug ships; passenger ships and fishing ships respectively. Furthermore, the AIS data stamp in- formation and additional parameters such as in- formation on speed on ground “operating speed of the ships” indicated that 21 ships were sta- tionary while 309 were moving during the period of study.
Table 2. Ships Status and ship Calls S
/No.
Ships
Type Moving Stop ship Calls 1
Cargo
Ships 149 11 160
2
Fishing
ships 9 2 11
3
Other
ships 56 5 61
4
Passenge
r Ships 23 0 23
5
Chemical
Tankers 43 0 43
6
Tug
Boats 29 3 32
309 21 330
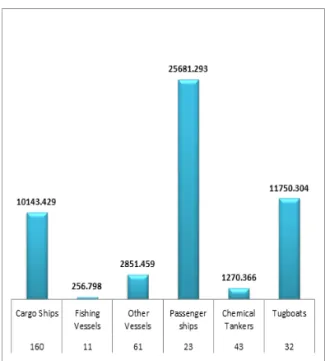
The major portion of fuel was consumed by Passenger Ships (25681.2 tons), followed by Tugboats (11750.3 tons); Cargo Ships (10143.4 tons); Other ship’s (2851.4 tons); Chemical tankers (1270.3 tons) and Fishing ships with 256.7 tons, respectively (see Table 3 and Figure 2).
It should be noted that the Passenger ships consumed greatest amount of fuel due to their main engine power compared to that of other ships. On the other hand, the cargo ships out- numbered passenger ships.
Table 3. Estimation of the fuel consumption by ship type
unit : ton
Figure 2. Fuel Consumption by ship type
As for CO
2emissions by ship type most CO
2was emitted by Passenger Ships (81409.6tons), followed by Tugboats (37248.4tons); Cargo Ships (32154.6tons); Other ships (9039.1tons); Chemical Tankers (4027.06 tons) and Fishing ships (814.04 tons), respectively (see Table 4 and Fig 3).
Table 4. Estimation of CO
2Emission by Ship type
unit : ton S/N
o.
No.
of Ships
Ship Type
CO
2Emission
Average Per Unit
1 160 Cargo
Ships 32154.669 200.967 2 11 Fishing
ships 814.048 74.004
3 61 Other
ships 9039.125 148.182 4 23 Passenger
ships 81409.699 3539.552 5 43 Chemical
Tankers 4027.061 93.653 6 32 Tugboats 37248.465 1164.015
330
Total CO
2Emissions
164693.067
Figure 3. CO
2Emissions by Ship Type
Ⅴ. Conclusion and Recommendations for Further Research
This study was conducted to estimate GHG emissions, mainly CO
2emissions from ships at the port of Incheon for the period of Oct, 2014.
The final sample AIS data consisted of 330 ships and AIS-based bottom up approach was em- ployed to estimate the total amount of fuel con- sumed and its resulting CO
2emissions. The de- tailed date time stamp information and speed on ground (operating speed) obtained from AIS data for each ship were thoroughly investigated and were used to calculate exact time spent (hour) and the distance covered (NM) by individual ship. The total amount CO
2emitted from ships were estimated to be 164693.06 tons with esti- mated total fuel consumption of 51953.64 tons for the period of study. The figures show that Cargo Ships make more frequent use of port fa- cilities but is less polluting compared to Passenger Ships. During the period of study 21 ships were reported to be stationary and did not move at all while 309 were moving. The pas- senger ships were most polluting ships, followed in order by tugboats; Cargo Ships; ships used for other activities; chemical tankers and fishing ships, respectively.
Several studies have been conducted in this field to measure ships exhaust emissions and to quantify their contribution to overall atmospheric pollution and resulting climate change or global warming in general. They were conducted to en- hance awareness of global warming and also to enable international organizations and government bodies to meet the growing environmental chal-
lenges for lowering the effects of global warming. However, the strategies and policies should be formulated based on authentic reports and studies, as there is still a high degree of un- certainty due to lacking information or access to reliable data sources (commercial databases) and also the type of methodology being used.
Though AIS-based bottom approach is more ac- curate in estimating GHGs emissions, it does have a limitation.
This study could use only 330 ships excluding 272 ships due to missing data, which is one limitation. Future study should find a more prop- er way to mitigate this common issue of missing data pertinent to AIS studies. Estimation of the amount of GHG and some other pollutants is just the initial step, and further research work is required in this field ensuing GHG studies.
Investigating the movement of the emissions and their impact on human population can be one of future research topics including monetization of these impacts. This level of comprehensive in- tegrating works requires researchers to develop new models and collect vast amounts of data on emissions, dispersions and impacts on human society. This work should be perhaps one of overarching study for policy formulations in the future.
Acknowledgement
This work was supported by Inha Research
Fund (52855).
References
2012 greenhouse gas conversion factors for company reporting, https://www.gov.uk/government/publi- cations/2012-greenhouse-gas-conversion- fac- tors-for-company-reporting (access at November 3, 2015).
AIS for Ships in the future, http://www.sjofartsverket.
se/upload/1486/a171_2.pdf (access at November 29, 2015).
Berechman, J. and Tseng, P. (2012), Estimating the en- vironmental costs of port related emissions:
The case of Kaohsiung, Transportation Research Part D: Transport and Environment, 17, 35-38.
Business.un.org, https://business.un.org/en/entities/13 (access at November 16, 2015).
Chang, C. and Wang, C. (2012), Evaluating the effects of green port policy: Case study of Kaohsiung harbor in Taiwan, Transportation Research Part D: Transport and Environment , 17, 185-189.
Chang, Y., Roh, Y. and Park, H. (2014), Assessing noxious gases of ship operations in a potential Emission Control Area, Transportation Research Part D: Transport and Environment , 28, 91-97.
Chang, Y., Song, Y. and Roh, Y. (2013), Assessing greenhouse gas emissions from port ship oper- ations at the Port of Incheon, Transportation Research Part D: Transport and Environment , 25, 1-4.
Coello, J., Williams, I., Hudson, D. and Kemp, S.
(2015), An AIS-based approach to calculate at- mospheric emissions from the UK fishing fleet, Atmospheric Environment , 114, 1-7.
Contini, D., Gambaro, A., Belosi, F., De Pieri, S., Cairns, W. R. L., Donateo, A., Zanotto, E.
and Citron, M. (2011), The direct influence of ship traffic on atmospheric PM2.5, PM10 and PAH in Venice, Journal of Environmental Management , 92(9), 2119-2129.
Cooper, D. (2003), Exhaust emissions from ships at berth, Atmospheric Environment , 37, 3817-3830.
Dalsøren, S., Eide, M., Endresen, Ø, Mjelde, A., Gravir, G. and Isaksen, I. (2009), Update on emissions and environmental impacts from the
international fleet of ships: the contribution from major ship types and ports, Atmospheric Chemistry and Physics , 9(6), 2171-2194.
Deniz, C. and Kilic, A. (2009), Estimation and assess- ment of shipping emissions in the region of Ambarlı Port, Turkey, Environmental progress
& Sustainable Energy , 29(1), 107-115.
Eyring, V., Isaksen, I., Berntsen, T., Collins, W., Corbett, J., Endresen, O., Grainger. R. G., Moldanova, J. Schlager, H. and Stevenson, D.
S. (2010), Transport impacts on atmosphere and climate: Shipping, Atmospheric Environment , 44(37), 4735-4771.
Fitzgerald, W., Howitt, O. and Smith, I. (2011), Greenhouse gas emissions from the interna- tional maritime transport of New Zealand's im- ports and exports, Energy Policy, 39(3), 1521-1531.
Greenhouse Gas Protocl, http://ghgprotocol.org/sites/de- fault/files/ghgp/Global-Warming-Potential-Values.
pdf (access at November 7, 2015).
Incheon Port Authority, Inner Port of Incheon, http://service.icpa.or.kr/ images/eng/cyber/
innerPort.jpg (access at June 2, 2015)
Isakson, J., Persson, T. and Lindgren, E. (2001), Identification and assessment of ship emissions and their effects in the harbour of Göteborg, Sweden, Atmospheric Environment, 35(21), 3659-3666.
Kesgin, U. and Vardar, N. (2001), A study on exhaust gas emissions from ships in Turkish Straits, Atmospheric Environment , 35(10), 1863-1870.
Matthias, V., Bewersdorff, I., Aulinger, A. and Quante, M. (2010), The contribution of ship emissions to air pollution in the North Sea regions, Environmental Pollution, 158(6), 2241-2250.
Miola, A. and Ciuffo, B. (2011), Estimating air emis- sions from ships: Meta-analysis of modelling approaches and available data sources, Atmospheric Environment , 45(13), 2242-2251.
Port of Incheon, http://www.worldportsource.com /ports/review/KOR_Port_of_Incheon_1483.php (access at November 23, 2015).
Review of Marine Transport, http://unctad.org/en/Publi
cationsLibrary/rmt2012_en.pdf (access at
November 14, 2015).
Saraçoğlu, H., Deniz, C. and Kılıç, A. (2013), An Investigation on the Effects of Ship Sourced Emissions in Izmir Port, Turkey, The Scientific World Journal, 2013, 1-8.
Saxe, H. and Larsen, T. (2004), Air pollution from ships in three Danish ports, Atmospheric Environment, 38(24), 4057-4067.
Schembari, C., Cavalli, F., Cuccia, E., Hjorth, J., Calzolai, G., Pérez, N., Pey, J. Prati, P. and Raes, F. (2012), Impact of a European direc- tive on ship emissions on air quality in Mediterranean harbours, Atmospheric Environment , 61, 661-669.
Seatrade Maritime News, http://www.seatrade-maritime.
c om/ n ews / a s i a / i nc h e on - ne w- po r t - s t a r t s -operation-with-8000-teu-capacity.html (access at November 23, 2015).
Song, S. and Shon, Z. (2014), Current and future emission estimates of exhaust gases and par- ticles from shipping at the largest port in Korea, Environmental Science and Pollution Research , 21(10), 6612-6622.
Speed, time, and distance; learn how to calculate the missing variable, http://www.schoolofsailing.net/
speed-time -and-distance.html (access at November 30, 2015).
The Human Cost of Weather Related Disasters, http://reliefweb.int/sites/reliefweb.int/files/re- sources/COP21_WeatherDisastersReport_2015_
FINAL.pdf (access at November 29, 2015).
Tzannatos, E. (2010), Ship emissions and their external- ities for the port of Piraeus – Greece, Atmospheric Environment , 44(3), 400-407.
Tzannatos, E. (2010). Ship emissions and their external- ities for Greece. Atmospheric Environment, 44, 2194-2202.
UN Report, http://www.un.org/apps/news/stor- y.asp?NewsID=52627#.VmVNg3YrLcd (access at November 23, 2015).
Villalba, G. and Gemechu, E. (2011), Estimating GHG emissions of marine ports—the case of Barcelona, Energy Policy , 39(3), 1363-1368.
Vutukuru, S. and Dabdub, D. (2008), Modeling the ef- fects of ship emissions on coastal air quality:
A case study of southern California, Atmospheric Environment , 42(16), 3751-3764.
Yau, P., Lee, S., Cheng, Y., Huang, Y., Lai, S. and Xu, X. (2013), Contribution of ship emissions to the fine particulate in the community near an international port in Hong Kong, Atmospheric Research, 124(28), 61-72.
Yau, P., Lee, S., Corbett, J., Wang, C., Cheng, Y. and Ho, K. (2012), Estimation of exhaust emission from ocean-going ships in Hong Kong, Science of The Total Environment , 431, 299-306.
Zhang, F., Chen, Y., Tian, C., Wang, X., Huang, G., Fang, Y. and Zong, Z. (2014), Identification and quantification of shipping emissions in Bohai Rim, China, Science of The Total Environment , 497-498, 570-577.
Zhao, M., Zhang, Y., Ma, W., Fu, Q., Yang, X., Li,
C., Zhou, B., Yu, Q. and Chen, L. (2013),
Characteristics and ship traffic source identi-
fication of air pollutants in China's largest port,
Atmospheric Environment , 64, 277-286.
AIS를 활용한 인천항 선박의 온실가스 배출량 추정