785
Copyright © 2016 The Korean Society of Fisheries and Aquatic Science pISSN:0374-8111, eISSN:2287-8815
서 론
쏘가리
(Siniperca scherzeri)
는농어목(Order Perciformes)
꺽 지과에속하는어식성담수어이며,
대형강중상류의유속이빠 르고바위가많은곳이거나수질이양호한호수,
저수지등에서 서식한다.
우리나라에서는한강수계를중심으로압록강을비 롯한서남해로흐르는대청호,
충주호,
춘천호,
소양호등에주 로서식하고있다(Lee et al., 2005; Kim and Kang,1993;Lee et al.,1997).
특히쏘가리는자갈이깔린바닥에산란을하며,
산란 기는5-7
윌로알려져있으나, 5
월말,
혹은6
월말부터성숙도가 감소한다고도알려져있다(Baek et al., 2015; Lee et al., 2002).
그리고쏘가리는 오래전부터유용한식용대상종으로잘알
려져왔을뿐만아니라낚시대상어종으로도오랫동안선호도 가높을뿐만아니라
,
국내내수면어업의중요한경제적어종 이며담수어종중기호도가매우높은고급어종으로경제적가 치가매우크다고알려져있다(Baek et al., 2015). 2015
년우 리나라내수면수산물의생산량은33,056
톤이며,
이중어류생 산량은26,237
톤이다.
특히,
쏘가리생산량은최근하천오염 및남획으로인해개체수가매우감소하여104
톤이어획되었 다(KOSIS, 2016).
내수면어류에대한영양성분관련연구는메기
,
동자개,
뱀장 어,
미꾸라지,
산천어,
잉어등에국한되어있으며(Gye et al., 2015; Oh et al., 2008; Yang and Lee, 1983; Choi et al., 1984;
Kim and Lee, 1986; Park and Kim, 1996; Kang et al., 1992),
쏘가리(Siniperca scherzeri)의 시기에 따른 영양성분 변화
심길보*·김민아·윤나영·송미영
1·정수정·임치원
국립수산과학원 식품위생가공과, 1국립수산과학원 중앙내수면연구소
Seasonal Variation in the Nutritional Composition of the Muscle of Mandarin Fish Siniperca scherzeri
Kil Bo Shim*, Min A Kim, Na Young Yoon, Mi Young Song
1
, Su Jung Jung and Chi Woon LimFood Safety and Processing Research Division, National Institute of Fisheries Science, Busan 46083, Korea
1
Central Inland Fisheries Research Institute, National Institute of Fisheries Science, Gapyeong 12453, Korea
Seasonal variation in the composition and fatty acid, amino acid, cholesterol, and vitamin contents in the muscles of the mandarin fish Siniperca scherzeri , caught in Soyangho Lake, Korea, was studied. The moisture content was 74.5- 78.7 g/100 g, lipids ranged between 1.06 and 4.23 g/100 g, protein between 18.5-20.7 g/100 g, and ash between 0.74 and 2.04 g/100 g. The moisture content was lowest in May and tended to increase from June to October. The high- est protein levels occurred in May, which coincided with the timing of oocyte maturation, and then decreased at the beginning of spawning. The highest lipid levels occurred in May and November coinciding with the periods before spawning and hibernation. The ratio of EAA/NEAA was higher than the value recommended by FAO for an ‘ideal’
food protein. There were significant differences in Mg and Fe contents with spawning; they were highest in May.
Contents of vitamin A and E were from not detected (ND) to 17.1 µg/100 g and ND to 0.69 mg/100 g, respectively and were highest in November. The content of niacin tended to decrease in June and increased until November and hibernation. The cholesterol content was 14.9-78.9 mg/100 g; it decreased from March to July and then increased until November. In conclusion, there is potential for expanding the commercial utilization of the mandarin fish as a food resource.
Key words: Mandarin fish , Seasonal variation, Proximate composition, Niacin, Hibernation
This is an Open Access article distributed under the terms of the Creative Commons Attribution Non-Commercial Licens (http://creativecommons.org/licenses/by-nc/3.0/) which permits unrestricted non-commercial use, distribution, and reproduction in any medium, provided the original work is properly cited.
http://dx.doi.org/10.5657/KFAS.2016.0785 Korean J Fish Aquat Sci 49(6) 785-791, December 2016
Received 28 October 2016; Revised 22 November 2016; Accepted 29 November 2016
*Corresponding author: Tel: +82. 51. 720. 2650 Fax: +82. 51. 720. 2669
E-mail address: [email protected]
쏘가리에대한관심이점차증가되고있으나식품영양학적인 연구는많지않으며
(Ha and Kang, 1990),
어획시기에따른영 양성분분석및평가관련연구는전무한실정이다.
따라서본연구에서는자연산쏘가리의시기에따른일반성 분
,
지방산,
총아미노산,
미네랄,
콜레스테롤,
비타민함량을조 사하였으며,
영양학적우수성홍보와산업적인이용을위한기 초자료로활용하고자하였다.
재료 및 방법
재료
쏘가리는강원도순천시소재에위치하고있는소양호에서매 월자망으로채취하였으며
, 12
월부터이듬해2
월까지는동면으 로인하여어획이되지않아채취하지못하였다. 3
월부터11
월 까지채취한시료는깨끗이씻어껍질과내장을제거하고가식 부만사용하였으며,
이들시료에대한평균체장과평균체중은Table 1
에나타내었다.
일반성분
일반성분은
AOAC (1995)
방법에따라수분은상압가열건조 법,
조단백질은Kjeldahl
질소정량법,
조지방은Soxhlet
추출 법,
회분은건식회화법으로분석하였다.
지방산 조성
Bligh and Dyer (1959)
의 방법에 의하여 시료의5
배량의chloroform:methanol (2:1, v/v)
용액으로 지질을 추출한 후, 14% BF
3-methanol
을이용하여지방산의methyl ester
화하여, gas chromatography (GC; Shimazu GC 2010 Plus, Shimazu, Tokyo, Japan)
로분석하였다.
총아미노산 함량
총아미노산은시료
200 mg
을6 N HCl
로24
시간동안110℃
에서 가열하여 가수분해하였다
.
시료용액을 감압 건조시킨 후, pH 2.2
의구연산완충액으로50 mL
로정용하여0.20 μm membrane filter
로 여과한후,
아미노산 분석용시료로 사용 하였다.
아미노산은 아미노산 분석기(Sykam DE/S-433D, Sykam, Eresing, Germany)
로분석하였다.
미네랄 함량
동결건조한시료
1 g
을코니컬비커에정밀히칭량한후질산65% (Suprapur grade, Merck, Darmstadt, Gremany) 10 mL
를 가하여180
분이상반응시킨후80℃
에서400
분간가열분해하 였다.
가열분해한시험용액의질산을완전히휘발시키고상온 에서냉각후질산10 mL
를다시가하여위와같은조건으로재 가열분해한뒤질산을휘발시켰다.
잔류물을2%
질산으로충분 히재용해하여여과지(ADVANTEC No.5C, Tokyo, Japan)
로 여과한다음100 mL
로정용하여Inductively coupled plasma
spectrometry (ICP; Optima 3300XL, PerkinElmer, Waltham,
MA, USA)
로분석하였다.
무기질함량은원물기준으로환산하여나타내었다
(MFDS, 2014).
콜레스테롤 함량
동결건조한시료
2-3 g
을정밀히칭량하여95% ethanol 40 mL
과8 mL 50% KOH
용액을가하여환류냉각관을부착한후80-90℃
에서70
분간비누화시켰다.
환류가완료되면가열기를 제거하고95% ethanol 60 mL
를환류냉각관상부를통해넣어 준뒤교반하고15
분후실온으로냉각시킨후24
시간동안안 정화하였다.
이용액에toluen 100 mL
를첨가하여30
초이상 교반하여500 mL
분액여두로옮겨1 M KOH
용액110 mL
을가하여10
초간진탕하여분리된윗층만을취하여다시0.5 M KOH
용액40 mL
를넣고10
초간진탕한뒤정치하여아래 층을버렸다.
잔류toluene
층에40 mL
증류수로천천히분액여 두를돌려주며수세한뒤정치하여분리된아래층은제거하고toluene
층에맑게보일때까지이과정을반복하여행하였다.
남 은toluene
층을유리솜과약20 g
의무수황산나트륨이채워진 유리깔대기를통해취한후40±3℃
에서감압농축하여건고된잔류물에아세톤
3 mL
를가하여다시감압농축하여완전건고시켰다
.
잔류물을3 mL dimethylformamide
에녹여그중1 mL
를취해0.2 mL hexamethyldisilane
과0.1 mL trimethyl- chlorosilane
을가하여유도체화하여5α-cholestane
내부표준 물질을넣어시험용액으로하였다(MFDS, 2015).
이시료액은HP-1 (30 m×0.25 mm×0.25 μm, Agilent, USA)
칼럼을이 용하여gas chromatography (GC; Agilent 7890, Agilent, CA, USA)
로분석하였다(MFDS, 2015).
비타민 A, E 함량
비타민
A, E
함량은Kwak et al. (2004)
의방법을일부수정하 여사용하였다.
시료3 g
을갈색메스플라스크에취한후etha- nol 30 mL, 60% KOH
용액3 mL,
그리고10% pyrogallol 1 mL
를첨가하여이를환류냉각기에서30
분간비누화시킨후,
실온으로냉각시켜증류수
30 mL
를가해갈색분액깔때기로옮겼다
.
플라스크는증류수와petroleum ether
로헹군후,
분액 깔때기에혼합하여방치시킨후물층을별도의갈색분액깔때 기에옮기고petroleum ether 50 mL
씩가하여2
회추출하였 다.
추출된petroleum ether
액을증류수10 mL
씩phenolphtha-
lein
시약으로정색이되지않을때까지수세하였고, petroleum
ether
층을sodium sulfate
를가해탈수하고갈색플라스크에 옮겼다. Petroleum ether
추출액은25°C
에서 감압농축하여methanol 5 mL
로정용하고0.25 μm membrane filter
로여과하 였다.
이시료액은Develosil RP-Aqueous C30 (4.6×250 mm,
5 μm particle size, Phenomenex, Tokyo, Japan)
칼럼을이용하 여HPLC (Surveyor Plus HPLC system, Thermo, CA, USA)
로분석하였다.
Niacin 함량
시료
5-10 g
을5 mM Sodium hexanesulfonate
용액에녹 여50 mL
가되도록하였다.
이용액을30
분간초음파추출하 고600 rpm
에서30
분간교반한후,
원심분리하고(4℃, 3,699 g×15
분)
상등액을취해0.2 µm membrane syringe filter
로 여과하여시험용액으로사용하였다(MFDS, 2015).
분석조건 은C18 column (250×4.6 mm 5 μm, Waters, USA)
을사용 하였고이동상용매는A: 5 mM hexanesulfonate/0.1% acetic acid, B: 35% 5 mM hexanesulfonate/0.1% acetic acid 65%
MeOH
을사용하였으며,
유속은1.0 mL/min,
시료주입량은10 μL
로하여260 nm
에서HPLC (Surveyor Plus HPLC system, Thermo, CA, USA)
를이용하여분석하였다.
통계처리
시료의영양성분변화결과에대한통계처리는시료에대해 평균
±
표준오차로 나타내었으며,
분석은Duncan’s multiple range test
로평균간의유의성(P<0.05)
로검정하였다(Steel and Torrie, 1980).
결과 및 고찰
가식부 수율 및 일반성분 변화
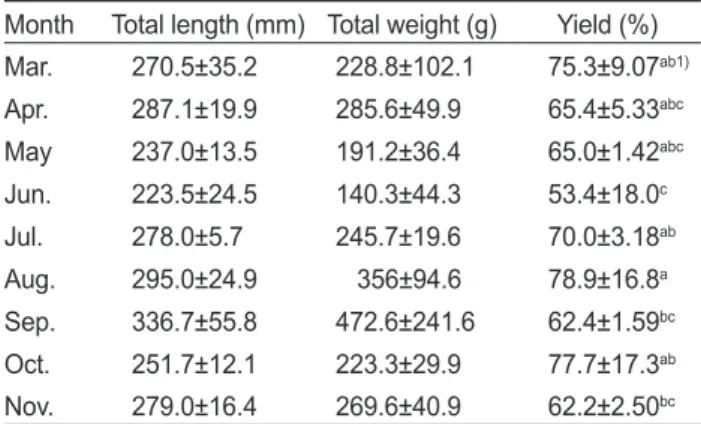
쏘가리의가식부수율은
62.2-78.9%
이었으며,
산란기인3
월 부터6
월까지는지속적으로감소하였다(Table 1).
그리고시기 에따른쏘가리근육의일반성분함량변화는Table 2
에나타내 었다.
수분함량은74.5-78.7 g/100 g
이었으며, 5
월과11
월에각 각74.5
및75.0 g/100 g
으로유의적인차이는없었다(P>0.05).
조지방함량은
1.06-4.23 g/100 g
이었으며,
산란직전인5
월에3.46 g/100 g
이었으며,
산란기인6
월과7
월에는각각1.69, 1.06 g/100 g
으로감소하였다.
이후함량이증가하여11
월에는4.23 g/100 g
으로가장높았다.
조단백질함량은18.5-20.7 g/100 g
이었으며, 10
월에가장높았고4
월에가장낮았다.
회분함량은0.74-2.04 g/100 g
이었으며, 8
월에0.74 g/100 g
으로가장낮았 으나3
월에2.04 g/100 g
으로가장높았다.
내수면어종중대표적인어종인미꾸라지는연령
,
기후,
수온 등에따라다르나대략4
월에서7
월사이에산란을하고10
월 하순에서3
월하순경까지땅속에서 동면을하면서월동을하 는특성을가지고있다(Park et al., 1995).
또한미꾸라지는산 란직후에가장수분함량이낮고동면직후에가장높았으며,
조 단백질과조지방은산란직후가가장높았으나동면직후에가 장낮다고보고하였다(Park et al., 1995).
쏘가리도동면하면서 월동하는어종이며,
산란직전인5
월과동면직전인11
월에조 지방함량이가장높았고,
조단백질함량은산란직전에는높았 지만,
동면직전에는다소낮았다.
동아시아지역뿐만아니라중 국등에서고품질의근육과독특한맛으로잘알려져있는쏘가 리(Siniperca chuatisi, Siniperca scherzeri)
의영양성분을조사한결과
,
조지방함량은2 g/100 g
이하이며,
조단백질은18.14- 19.81 g/100 g
으로보고하였으며(Chu et al., 2013),
또한우리 나라에서 쏘가리의 일반성분 조사연구에서는수분함량79.7 g/100 g,
회분함량0.9 g/100 g,
지방함량0.8 g/100 g,
조단함량15.7 g/100 g
로보고되었다(Ha and Kang, 1990).
이들연구와 비교하면, 5
월과11
월을제외한시기의쏘가리의일반성분함 량과유사하였다.
지방산 조성비 변화
쏘가리의월별지방산조성비변화를
Table 3
에나타내었다.
일반적으로어류의지방산조성비와유사하였으며,
시기와상 관없이 포화지방산은palmitic acid (C16:0),
단일불포화지 방산은oleic acid (C18:1),
고도불포화지방산은linoleic acid (C18:2n6), docosahexaenoic acid (C22:6n-3)
그리고eicosa-
Table 1. The capture date and biological data of mandarin fish Siniperca scherzeriMonth Total length (mm) Total weight (g) Yield (%) Mar. 270.5±35.2 228.8±102.1 75.3±9.07ab1) Apr. 287.1±19.9 285.6±49.9 65.4±5.33abc May 237.0±13.5 191.2±36.4 65.0±1.42abc Jun. 223.5±24.5 140.3±44.3 53.4±18.0c Jul. 278.0±5.7 245.7±19.6 70.0±3.18ab Aug. 295.0±24.9 356±94.6 78.9±16.8a Sep. 336.7±55.8 472.6±241.6 62.4±1.59bc Oct. 251.7±12.1 223.3±29.9 77.7±17.3ab Nov. 279.0±16.4 269.6±40.9 62.2±2.50bc
1Different superscripts within a same column are significantly dif- ferent by Duncan's multiple range at P<0.05.
Table 2. Seasonal variation in proximate composition content (g/100 g) of the muscle of mandarin fish Siniperca scherzeri Month Moisture Crude lipid Crude
protein Ash Mar. 77.9±0.491a2 2.23±0.09d 19.1±0.25c 2.04±0.32a Apr. 77.1±0.36ab 2.99c 18.5±0.16d 1.38±0.03b May 74.5±0.6b 3.46±0.26b 20.7±0.38a 0.98±0.05cd Jun. 78.0±0.15a 1.69±0.06e 19.7±0.11b 1.05±0.06c Jul. 78.7±0.1a 1.06±0.09f 19.8±0.12b 1.52±0.12b Aug. 76.9±3.94ab 1.2±0.19f 19.2±0.24c 0.74±0.05d Sep. 78.6±0.38a 1.94±0.09e 18.9±0.18cd 0.99±0.05dc Oct. 76.6±0.14ab 1.92±0.16e 20.7±0.45a 1.23±0.2bc Nov. 75.0±0.4b 4.23±0.09a 19.9±0.32b 1.06±0.22c
1Mean±standard deviation. 2Different superscripts within a same column are significantly different by Duncan's multiple range at P<0.05.
pentaenoic acid (C20:5n-3)
의조성비가가장높았다.
고도불포화지방산조성비는
27.8-39.7%
이었으며, 3
월부터8
월9
월까지는감소하는경향을나타내다가증가하여10
월부터39.45%
까지차지하였다.
이에반해포화지방산은24.4-32.1%
이었으며
,
단일불포화지방산은33.2-42%
이었다.
이들지방산 조성비는고도불포화지방산과달리8
월과9
월까지증가하다가 감소하는경향이었다.
고도불포화지방산 중
EPA
조성비는3
월에6.48%
이었으나 지속적으로감소하여7
월과8
월에3.65%
및3.28%
이었으며 이후증가하였다. DHA
조성비는6
월에9.07%
로증가하고이 후급격히감소하여9
월에3.85%
이었으며,
이후급격히증가하 여11
월에는7.75%
이었다.
포화지방산인C18:0
조성비는9
월 까지20.7%
으로증가하였으며,
이후감소하여11
월에17.8%
이었다
.
총아미노산 함량 변화
쏘가리의 시기에 따른 총아미노산 함량 변화는
15.9-19.1 g/100 g
이었으며,
주요 아미노산은leucine, lysine, aspartic acid, glutamic acid, alanine, arginine
이었다.
총아미노산함 량은5
월에각각19.1 g/100 g
으로가장함량이높았으며, 7
월 에15.9 g/100 g
으로함량이낮았다(Table 4).
필수아미노산함 량은7.01-8.09 g/100 g
이었으며, 9
월에8.09 g/100 g
으로가 장높았다.
반면비필수아미노산함량은8.89-10.6 g/100 g
이 었으며, 9
월에가장높았다.
비필수아미노산대비필수아미노 산비율이0.75-0.82
이었으며, FAO
에서이상적인단백질식품 으로규정한권장수치보다높았다(FAO, 1957).
중국연안에서 어획된쏘가리의비필수아미노산과필수아미노산함량비율은0.64-0.68
이며,
본결과는이들보다는상당히높은함량이었다(Chu et al., 2013).
미네랄 함량 변화
쏘가리의 시기에 따른 미네랄 함량은
Table 5
에 나타내었다
.
이들미네랄중함량이높은것은황,
칼륨,
인이었으며,
각 각230.4-498 mg/100 g, 273.8-394.5 mg/100 g, 177.7-294.1 mg/100 g
으로나타났다.
내수면어류중산천어의칼륨함량은357.9±2.1 mg/100 g,
인함량은226.2±1.3 mg/100 g
이었으 며(Oh et al., 1980),
송어의인함량이263 mg/100 g,
칼륨함 량이400 mg/100 g
으로보고하였으며(RDA, 2011),
자연산메 기의칼륨함량은323.88-379.40 mg/100 g,
인함량은193.74- 223.02 mg/100 g
으로(Gye et al., 2015),
본실험과비교하였 을때칼륨과인함량은기타내수면어류와비교하였을때비슷 한함량을나타내었으며황함량은다소높은것으로나타났다쏘가리근육의미네랄함량의시기에따른변화를조사한결 과
,
산란시기인7
월에마그네슘,
철함량이다른시기에비하여 높았으며,
기타미네랄은 봄철에높은것으로나타났다.
마그 네슘함량은3
월에23.9 mg/100 g
이었으나지속적으로증가 하여7
월에38.1 mg/100 g
함량으로가장높았으며,
이후다 시감소하는경향이었다.
또한아연함량은시기에따른함량 의차이는있었으나시기에따른경향은없었다.
또한칼슘함 량은3
월에35.2 mg/100 g
이었으나4
월에는급격히감소하여13.6 mg/100 g
이었으며,
이후비슷한함량이었다.
인함량은4
월에308.3 mg/100 g
으로가장높았으며,
이후서서히감소하 여11
월에는200.1 mg/100 g
이었다.
칼륨함량은3
월에381.5 mg/100 g
이었다가이후감소하여11
월에는273.8 mg/100 g
까 Table 3. Seasonal variation in fatty acid composition (%) of the muscle of mandarin fish Siniperca scherzeriFatty acid Mar. Apr. May Jun. Jul. Aug. Sep. Oct. Nov.
C14:0 4.08 3.94 2.59 2.65 3.67 1.83 2.83 2.99 3.59
C16:0 16.1 15.2 17 17.2 18.5 20.7 19.5 19.6 17.8
C18:0 2.90 2.74 4.13 5.25 4.65 5.54 4.21 4.39 3.29
∑Saturated 25.9 24.4 26.5 27.9 31.1 32.1 30.2 29.2 27.4
C16:1 11.2 11.5 8.46 8.57 9.45 10.2 14.3 13.8 10.4
C18:1 22.4 23.8 27.7 24 27.8 27 26.1 20.1 22.1
C20:1 0.40 0.42 0.70 0.74 0.75 1.36 0.96 0.70 0.42
∑Monoen 34.5 36.1 37.1 33.5 38.3 39.2 42 35.6 33.2
C18:2n-6 5.72 5.73 6.20 5.41 5.46 4.70 4.57 3.08 5.52
C18:3n-3 4.02 4.24 3.55 3.21 2.69 3.91 4.16 4.11 4.75
C18:4n-3 1.67 1.83 1.00 1.00 1.00 0.37 0.71 0.57 2.10
C20:4n-6 5.74 5.41 5.13 5.14 4.71 2.77 2.04 2.91 5.05
C20:5n-3(EPA) 6.48 7.18 5.16 4.97 3.65 3.28 3.78 5.95 6.13
C22:6n-3DHA) 7.40 6.84 7.25 9.07 5.85 4.98 3.85 8.58 7.75
∑Polyen 39.7 39.4 36.4 38.5 30.6 28.7 27.8 35.2 39.5
지감소하였다
.
철함량은
3
월에0.41 mg/100 g
이었으며,
이후감소하여6
월 에는0.14 mg/100 g
이었다가7
월에는급격히증가하여0.49
mg/100 g
으로증가하고이후다소함량은적었으나비슷한경향이었다
.
셀레늄함량은불검출-0.15 mg/100 g
으로10
월에함 량이가장높았으며,
황함량은3
월에230.6 mg/100 g
이었으며,
이후에는칼슘및칼륨과유사하게감소하여, 11
월에는276.6 mg/100 g
이었다.
나트륨함량은3
월에70.3 mg/100 g
이었다 Table 4. Seasonal variation in amino acid content (g/100 g) of the muscle of mandarin fish Siniperca scherzeriAmino acids Mar. Apr. May Jun. Jul. Aug. Sep. Oct. Nov.
Essential amino acids (E)
Histidine 0.58 0.54 0.58 0.58 0.52 0.43 0.45 0.52 0.53
Isoleucine 0.92 0.83 0.75 0.88 0.74 0.80 0.87 1.01 0.93
Leucine 1.46 1.45 1.41 1.59 1.37 1.41 1.66 1.65 1.55
Lysine 1.30 1.28 1.41 1.25 1.50 1.52 1.72 1.39 1.35
Methionine 0.50 0.45 0.55 0.38 0.55 0.54 0.62 0.63 0.63
Phenylalanine 0.85 0.81 0.78 0.71 0.73 0.76 0.87 0.91 0.87
Threonine 0.80 0.81 0.83 1.24 0.78 0.80 0.94 0.92 0.86
Valine 0.92 0.86 0.83 1.05 0.82 0.88 0.95 1.02 0.96
Total E 7.34 7.02 7.14 7.68 7.01 7.15 8.09 8.06 7.69
Nonessential amino acids (NE)
Aspartic Acid 1.74 1.80 1.77 1.52 1.63 1.67 1.87 1.85 1.77
Serine 0.72 0.74 0.73 0.8 0.71 0.72 0.86 0.81 0.77
Glutamic acid 2.46 2.57 2.61 2.3 2.58 2.63 2.98 2.85 2.71
Proline 0.41 0.60 0.66 0.61 0.52 0.69 0.67 0.69 0.66
Glycine 0.81 0.04 0.07 0.1 0.07 0.03 0.07 0.04 0.03
Alanine 1.15 1.13 1.10 1.36 1.02 1.10 1.23 1.24 1.19
Cystine 0.03 0.83 0.92 0.78 0.72 0.89 0.88 0.91 0.88
Tyrosine 0.63 0.61 0.63 0.78 0.61 0.64 0.75 0.71 0.71
Arginine 1.06 1.02 1.04 1.08 1.04 1.12 1.27 1.20 1.11
Total NE 9.00 9.33 9.53 9.33 8.89 9.48 10.6 10.3 9.82
Total amino acid 16.3 16.3 19.1 17.0 15.9 16.6 18.7 18.4 17.5
E/NE ratio 0.82 0.75 0.75 0.82 0.79 0.75 0.76 0.78 0.78
Table 5. Seasonal variation in mineral content (g/100 g) of the muscle of mandarin fish Siniperca scherzeri
Minerals Mar. Apr. May Jun. Jul. Aug. Sep. Oct. Nov.
Ca 35.2±1.68 13.6±1.79 13.5±0.62 16.2±0.05 16.3±4.81 14.6±1.20 16.7±0.04 23.9±3.23 14.00±2.45 P 230.4±0.62 308.4±0.45 200.9±8.21 218.5±6.05 201.3±2.00 181.1±7.77 177.7±1.46 294.1±21.7 200.1±0.26 Mg 23.9±0.56 22.2±0.24 27.1±0.34 36.0±0.79 38.1±0.04 32.8±0.47 32.6±0.47 34.9±2.33 23.7±0.29 Na 70.3±11.9 12.5±2.16 37.2±2.79 42.2±0.96 43.1±0.52 47.1±1.37 27.6±0.23 61.4±4.79 45.4±8.58 K 381.5±10.2 394.5±7.23 334.6±55.4 320.9±6.18 350.6±1.11 311.6±12.59 288.9±4.12 359.2±30.1 273.8±1.29 Fe 0.41±0.04 0.33±0.04 0.19±0.26 0.14±0.01 0.49±0.03 0.21±0.04 0.39±0.03 0.44±0.01 0.32±0.07 Zn 0.59±0.03 0.55±0.01 0.33±0.21 0.52±0.03 0.33±0.01 0.55±0.37 0.34±0.03 0.66±0.17 0.26±0.01
Cu 0.08±0.02 ND 0.02±0.03 ND ND ND ND 0.07±0.01 0.01±0.01
Se 0.06±0.03 0.04±0.03 0.08±0.03 0.00±0.00 0.08±0.01 0.08±0.01 0.07±0.01 0.15±0.04 ND S 230.4±10.6 616.6±10.8 469.6±204.4 498.±8.97 496.3±3.59 469.6±3.59 432.4±5.20 476±32.6 276.6±0.81 ND: not detected.
가
4
월에12.5 mg/100 g
으로감소하였다가이후서서히증가 하는경향이었다.
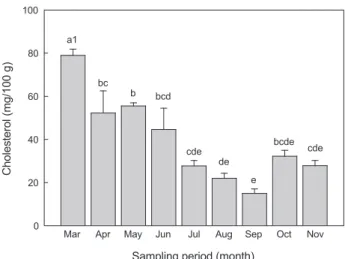
콜레스테롤 함량 변화
쏘가리의시기에따른콜레스테롤함량은
3
월에79 mg/100 g
으로가장높았으며,
이후9
월까지는감소하여15 mg/100 g
으로함량이가장낮았다. 10
월과11
월에각각32.2 mg/100 g, 27.9 mg/100 g
으로다시증가하였다(Fig. 1). Ha and Kang (1990)
은쏘가리의콜레스테롤함량이53.1 mg/ g
으로보고하 여,
본연구결과의4-5
월콜레스테롤함량과비슷하였다.
또한 내수면어류의평균함량은40.9 mg (11.7-249 mg/100 g)
이며,
쏘가리근육의콜레스테롤함량은30.3 mg/100 g
으로보고한 결과와비교하면(Jeong et al., 1998).
본연구결과의10
월및11
월의함량과유사하였다.
비타민 A, E, niacin 함량 변화
쏘가리의지용성비타민
A
와E
함량은시기에따라상당한차 이가있었다(Table 6).
비타민A
는5
월에3.20 μg/100 g, 7
월3.57 μg/100 g, 11
월과12
월에각각3.86, 17.1 μg/100 g
함량이 었으며,
기타시기에는검출되지않았다.
또한비타민E
는3-4
월및6
월에는검출되지않았으며, 5
월에0.21 mg/100 g
이었다 가7
월-11
월까지는0.29-0.69 mg/100 g
으로나타났다. Jeong et al. (1998)
에따르면쏘가리근육의비타민E
인α-tocopherol
함량이0.1 mg/100 g
이라고밝혔으나본연구결과와는다소차 이가있었다.
지용성비타민함량은조지방함량과상관성이높 은것으로알려져있는데(Jeong et al., 1998),
본결과에서는5
월과12
월에조지방함량이높았으며,
조지방함량이가장높 은12
월에비타민E
함량이가장높았다.
앞선연구에따르면산천어근육에서비타민
A
는검출되지않았고,
비타민E
가0.2 mg/100 g
으로나타났으며(Oh et al., 2008),
자연산뱀장어의 비타민A
함량은100 mg/100 g (
건중량)
함유하는것으로보고 하였다(Cho et al., 2006).
또한자연산뱀장어비타민E
함량은4-7 mg/100 g (
건중량)
으로알려져있으며,
일본산양식뱀장어(Anguilla japonica)
의근육내함량은21-37 mg/100 g (
건중량)
로나타났다(Furuta et al., 2009).
쏘가리의
niacin
함량을조사한결과,
시기별로함량의차이 는미미하였으나7
월까지조금씩감소하여2.51 mg/100 g
으 로가장낮았으며,
다시증가하여11
월에는3.51 mg/100 g
이 었다(Table 6).
따라서시기별에따른쏘가리근육의영양학적성분을살펴 보면
,
산란과동면직전에조지방,
조단백질및불포화지방산조 성비가높았을뿐만아니라,
양질의아미노산으로구성된단백 질공급원으로확인되었다.
또한미네랄함량은마그네슘과철 함량은산란에의하여시기별에따른유의적인차이가있었으 며,
지용성비타민함량은동면직전인11
월에상당히높았다.
Niacin
함량은산란시기에다소낮아졌다가동면직전까지증가하였다
.
이상의결과를살펴보면,
쏘가리영양성분변화는산란 과동면에의하여영향을받고있으며,
이러한연구결과는산란 시기어획금지등의자원관리를위한기초자료로의활용과시 기에따른영양성분제시를통한섭취권장시기등에대한홍보 자료로활용이가능할것으로판단된다.
사 사
이 논문은
2016
년 국립수산과학원 수산과학연구사업(R2016060)
의지원으로수행된연구이며,
연구비지원에감사 드립니다.
Table 6. Seasonal variation in vitamin A, E and niacin content of the muscle of mandarin fish Siniperca scherzeri
Month Vitamin A
(μi/100 g) Vitamin E
(mg/100 g) Niacin (mg/100 g)
Mar. ND ND 2.56±0.02 1cd2
Apr. ND ND 2.92±0.21 bc
May 3.20±1.07 0.21±0.01 2.85±0.03 bcd
Jun. ND ND 2.58±0.17 cd
Jul. 3.57±1.13 0.42±0.06 2.51±0.15 d
Aug. ND 0.63±0.06 2.99±0.10 b
Sep. ND 0.26±0.02 2.97±0.26 b
Oct. 3.86±1.77 0.35±0.04 3.23±0.16 ab Nov. 17.1±3.63 0.69±0.01 3.51±0.16a
1Mean±standard deviation. 2Different superscripts within a same column are significantly different by Duncan's multiple range at P<0.05.
Sampling period (month)
Cholesterol (mg/100 g)
0 20 40 60 80 100
Mar Apr May Jun Jul Aug Sep Oct Nov bcde cde e a1
bc b bcd
cde de
Fig. 1. Seasonal variation in cholesterol content (g/100 g) of the muscle of mandarin fish Siniperca scherzeri. 1Different super- scripts on the bar are significantly different by Duncan's multiple range at P<0.05.
References
AOAC. 1995. Official Methods of Analysis. 16th Ed. Associa- tion of Official Analytical Chemist, Arlington, VA, U.S.A.
Baek SH, Yoon JD, Kim JH, Park SH, Lee JW, Jang MH, Kim SK and Byeon MS. 2015. Evaluation of the movement pat- tern of Siniperca scherzeri using the radio telemetry in the middle part of the Geum-river where wiers were construct- ed recently. Korean J Ecol Environ 48, 77-85. http://dx.doi.
org/10.11614/KSL.2015.48.2.077.
Bligh, EG and Dyer WJ. 1959. A rapid method for total lipid extraction and purification. Can J Biochem Physiol 37, 911- Cho YJ, Jung HJ, Kim YC, Oh SM, Son MJ, Kim SM and Shim 917.
KB. 2006. Optimal process of eel hot-water for proper ed- ible volume. J Fish Mar Sci Edu 18, 374-378.
Choi JH, Ro JI and Pyeun JH. 1984. Studies on lipids in fresh- water fishes 3. Distribution of lipid components in various tissues of eel, Anguilla japonica. Bull Korean Fish Soc 17, 477-484.
Chu W, Li W, Wang K, Liu L, Leng X and Zhang J. 2013. Com- parative studies on muscle cellularity and flesh quality of two mandarin fish species, Siniperca chuatsi and Siniperca
scherzeri. J Food Agric Environ 11, 1600-1605.
FAO (Food and Agriculture Organization). 1957. Protein Re- quirements. FAO Nutritional Studies 16.
Furuta H, Ishida T, Suzuki T, Unuma T, Kurokawa T, Sugita T and Yamamoto T. 2009. Vitamin content and quality of eggs produced by broodstock injected with vitamins C and E dur- ing ratified maturation in Japanese eel Anguilla japonica.
Aquaculture 289, 334-339.
Gye HJ, Shim KB, Lim CW, Song MY, Kim DH, Kim BK and Cho YJ. 2015. Nutritional assessment and mineral content of wild and cultured catfish Silurus asotus. J Fish Marine Sci Edu 27, 1364-1368. http://dx.doi.org/10.13000/
JFMSE.2015.27.5.1364.
Ha BS and Kang DS. 1990. Studies on the lipid aquatic prod- ucts (part 5), Comparison of flesh lipid composition of some fresh water fishes, mandarin fish, Korean Perch, Cornet fish and cat fish. J Korean Soc Food Nutr 19, 291-300.
Jeong BY, Choi BD and Lee JS. 1998. Proximate composition, cholesterol and α-tocopherol content in 72 species of Ko- rean fish. J Korean Fish Soc 31, 160-167.
Kang SJ, Choi BD and Jeong WG. 1992. Comparison of amino acid profiles and lipids of two strains of common carp, Cyp
rinus carpio. J Aqua 5, 167-175.
Kim JD and Kang KY. 1993. Coloured fishes of Korea. Acad- emy publishing company, Seoul, Korea, 477pp.
Korea Statistical Information Service (KOSIS). 2015.
Year of fishery products. Retrieved from http://kosis.
kr/statisticsList/statisticsList_01List.jsp?vwcd=MT_
ZTITLE&parentId=F#SubCont on Oct. 20.
Kim KS and Lee EH. 1986. Food components of wild and cul- tured fresh water fishes. Korean J Fish Aquat Sci 19, 195- 211.
Rural Development Administration (RDA). 2011. Korean Stan- dard Food Composition Tables, 8th revision. RDA, Suwon, Korea, 572.
Kwak BM, Lee KW, Ahn JH and Kong UY. 2004. Simultane- ous Determination of Vitamin A and E in Infant Formula by Rapid Extraction and HPLC with Photodiode Array Detec- tion. J Korea Food Sci Technol 36,189-195.
Lee WO, Jang SI, Lee JY and Song SJ. 1997. Comparison of morophological and chromosomal charateristics and cross breeding of the two types Korean mandarin fish, Siniperca
scherzeri. Kor J Ichthyol 9, 228-234.
Lee YA, Lee BM, Choi KC, Park YP and Bang IC. 2005. Early gonadogenesis and sex differentiation of the mandarin fish
Siniperca scherzeri. J Aquaculture 18, 76-80.
Lee JH, SK Ku, KD Park and HS Lee. 2002. An immunohisto- chemical study on the endocrine cells in the gastrointestinal tract of the Mandarin fish (Siniperca scherzeri). Korean J Veterinary Res 42, 289-297.
MFDS (Ministry of Food and Drug Safety). 2015. Food Code.
Sejong, Korea.
Oh HT, Kim SH, Yoo SJ, Choi HJ, Chung MJ and Ham SS.
2008. Component analysis of masou salmon (Oncorhyn
chus masou). J Korean Soc Food Sci Nutr 37, 886-890.
Park IW, Hong JS, Lee KK, Kim MK, Kim JB and Kang KH.
1995. Histological observation on the seasonal changes of distribution of muscle components in hernant fish. Korean J Ichthyol 7, 187-194.
Park SY and Kim HR. 1996. Changes of food components and lipid peroxides in rainbow trout with growth. J Korean Soc Food Sci Nutr 25, 928-931.
Steel RGD and Torrie JH. 1980. Principle and procedure of statistics; a biometrical approach (2nd ed.). MacGraw-Hill Book Company, New York, U.S.A.
Yang ST and Lee EH. 1983. Taste compounds of fresh-water fishes-6. Taste compounds of Korean catfish meat. Korean J Fish Aquat Sci 16, 202-210.