R E S E A R C H Open Access
The effect of orthognathic surgery on the lip lines while smiling in skeletal class III patients with facial asymmetry
Sang-Hoon Kang
1, Moon-Key Kim
1, Sang-In An
2and Ji-Yeon Lee
2*Abstract
Background: The aim of this study was to examine the relationship between improvements in lip asymmetry at rest and while smiling after orthognathic surgery in patients with skeletal class III malocclusion.
Methods: This study included 21 patients with skeletal class III malocclusion and facial asymmetry. We used preoperative and postoperative CT data and photographs to measure the vertical distance of the lips when smiling. The photographs were calibrated based on these distances and the CT image. We compared preoperative and postoperative results with the t test and correlations between measurements at rest and when smiling by regression analyses.
Results: There were significant correlations between the postoperative changes in canting of the mouth corners at rest, canting of the canines, canting of the first molars, the slope of the line connecting the canines, and the slope of the line connecting first molars. The magnitude of the postoperative lip line improvement while smiling was not significantly correlated with changes in the canting and slopes of the canines, molars, and lip lines at rest.
Conclusions: It remains difficult to predict lip line changes while smiling compared with at rest after orthognathic surgery in patients with mandibular prognathism, accompanied by facial asymmetry.
Keywords: Facial asymmetry, Orthognathic surgery, Lip cant, Smile
Background
Patients with craniofacial asymmetry frequently also have lip line asymmetry [1]. Asymmetry leads to canted lips due to a difference in oral commissure. It is of inter- est to both patients and surgeons whether lip asymmetry can be corrected through orthognathic surgery. It has been reported that the improvement in lip canting can be proportional to the jaw displacement correction [1 –3].
However, lip lines, which are important for the patient ’s esthetic satisfaction, are affected by several factors such as the properties of soft tissues and the patient ’s muscular ac- tivity [4]. Thus, it is difficult to accurately predict the changes that will occur postoperatively. Unfortunately, there has been little research in this area, especially in lip asymmetry while smiling [4, 5]. Lip asymmetry when
smiling does not usually occur in connection with cranio- facial asymmetry [5].
Therefore, the present study examined the relationship between improvements in lip asymmetry at rest and when smiling after orthognathic surgery in patients with skeletal class III malocclusion and menton deviation.
Methods
Our institutional review board approved this retrospective study. The subjects were patients with mandibular prog- nathism accompanied by facial asymmetry. More specific- ally, the subjects comprised patients with skeletal class III malocclusion, a menton displaced laterally more than 2 mm, and no maxillary retrusion. All of the patients underwent bimaxillary orthognathic surgery, namely a Le Fort I maxillary osteotomy and mandibular vertical ramus osteotomy. Patients were only included if they finished preoperative orthodontic treatment, underwent orthog- nathic surgery, had preoperative and postoperative CT
* Correspondence:[email protected]
2Department of Orthodontics, National Health Insurance Service Ilsan Hospital, 100 Ilsan-ro, Ilsan-donggu, Goyang, Gyeonggi-do 410-719, Republic of Korea
Full list of author information is available at the end of the article
© 2016 Kang et al. Open Access This article is distributed under the terms of the Creative Commons Attribution 4.0 International License (http://creativecommons.org/licenses/by/4.0/), which permits unrestricted use, distribution, and reproduction in any medium, provided you give appropriate credit to the original author(s) and the source, provide a link to the Creative Commons license, and indicate if changes were made.
data, and had clinical photographs of themselves smiling that were taken after the surgery, and postoperative ortho- dontic treatments had been concluded. Twenty-one pa- tients met the above criteria and were included.
Reference planes for measurements on CT images
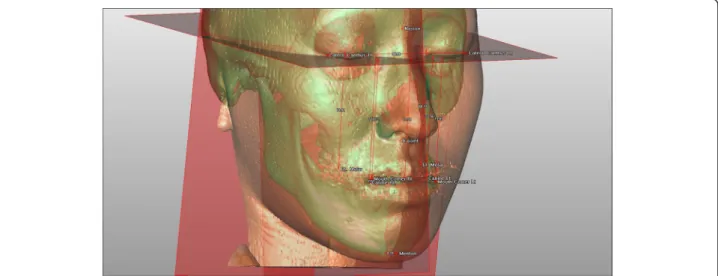
We collected the preoperative and postoperative CT data, and 3D images were reconstructed using SIM- PLANT® software ver. 14.0 (Materialise Dental, Leuven, Belgium). Then, we used the constructed 3D images and three surface images to measure error. The errors were measured as follows. First, we set reference planes in the cranial area of the data. Then, we measured each point on the reconstructed mandible and on the surgical simu- lation and compared their distances. We constructed three reference planes: the Frankfort horizontal (FH), midsagittal, and coronal. The FH plane was used to measure vertical error. The FH plane crossed the center of the orbitale―the infraorbital margins―and the two portions of both external auditory canals. The plane that runs parallel to the FH plane and crossed the center of the lateral canthus was set as the intercanthus horizontal plane. The midsagittal plane was used to measure lateral error and was perpendicular to the FH plane and crossed the nasion and internal occipital crest. Finally, we used the coronal plane to measure anteroposterior error. It ran perpendicular to the FH plane and midsagit- tal plane and crossed the nasion. The shortest distances from each of these three planes were named the vertical dis- tance, lateral distance, and anteroposterior distance (Fig. 1).
Setting reference points and measurements in CT images
We measured the vertical distances from the left and right canines, molars, and mouth corners to the inter- canthus horizontal plane. The differences in the heights of the left and right canines, molars, and mouth corners
were defined as canting. The angles between the lines that connect the left and right canines, molars, mouth corners and the horizontal plane were defined as canine, molar, and mouth corner angles. The distances from the coronal plane to point A and point B were measured as the horizontal distance A and horizontal distance B, re- spectively. The distance from the midsagittal plane to the menton was set as the menton deviation. We mea- sured each of these distances on the preoperative and postoperative CT data. The measurement points and measurement methods are shown in Table 1.
Measurements of lip lines while smiling
We used the preoperative and postoperative photo- graphs of the patients while smiling to measure the dif- ference in the vertical distance of the lips. At first, the observer adjusted the whole size of photographs accord- ing to the distant reference of CT. The photographs were collected using V-Ceph ver. 6.0 (OSSTEM IM- PLANT Co., Seoul, Republic of Korea) software. The same program was used to measure the patients’ right and left lateral canthus distances (lateral intercanthus distance). The preoperative photograph was adjusted based on these distances and the lateral intercanthus dis- tance that was measured on the preoperative CT image (Fig. 2a). At second, using the firstly revised picture, we measured the vertical distance from the line (lateral intercanthus line) that connects the right and left lateral canthus to the edge of the maxillary central incisors in V-Ceph. We also measured the vertical distance from the edge of the maxillary central incisors to the inter- canthus horizontal plane on the preoperative CT. Then finally, we altered the vertical size of the smile picture (the firstly revised picture) that was adjusted using the intercanthus distance to have the same vertical distance from the lateral intercanthus line to the central incisors
Fig. 1 Reference planes, points, and measurements in three-dimensional CT images
as those vertical distance from the intercanthus hori- zontal plane to the central incisors measured on the preoperative CT data (Fig. 2b). The alteration of the photograph was completed in the state of the same value of the lateral intercanthus distance and the vertical distance from incisor to the lateral inter- canthus line.
We measured the vertical distance of the lips during smiling, which is the shortest distance from the lateral intercanthus line to the mouth corner. The difference between the right and left vertical distances was defined as canting. The angle between the line that connects the left and right mouth corners and the lateral intercanthus line was defined as the slope angle while smiling. We
Table 1 Descriptions of measurementsName Descriptions
Point A (mm) Distance to point A from the coronal plane Point B (mm) Distance to point B from the coronal plane
Menton deviation (mm) Distance to the menton point from the midsagittal plane
Lateral intercanthus (mm) Distance between the right lateral canthus point and left lateral canthus point Right canine (mm) Distance to the right canine cusp from the intercanthus horizontal plane Left canine (mm) Distance to the left canine cusp from the intercanthus horizontal plane
Right molar (mm) Distance to the right first molar alveolar bone from the intercanthus horizontal plane Left molar (mm) Distance to the left first molar alveolar bone from the intercanthus horizontal plane Right mouth corner (mm) Distance to the right mouth commissure from the intercanthus horizontal plane Left mouth corner (mm) Distance to the left mouth commissure from the intercanthus horizontal plane
Molar canting (mm) Absolute value of the height difference between the right first molar point and left first molar point Canine canting (mm) Absolute value of the height difference between the right canine point and left canine point Mouth corner canting (mm) Absolute value of the height difference between the right mouth corner and left mouth corner
Canine line (°) Absolute value of the angle between the line connecting both canines and the intercanthus horizontal plane Molar line (°) Absolute value of the angle between the line connecting both first molars and the intercanthus horizontal plane Mouth corner line (°) Absolute value of the angle between the line connecting both mouth corners and the intercanthus horizontal plane Smiling right mouth corner
(mm)
Distance to the right mouth commissure from the intercanthus horizontal plane, when smiling
Smiling left mouth corner (mm) Distance to the left mouth commissure from the intercanthus horizontal plane, when smiling Smiling mouth corner canting
(mm)
Absolute value of the height difference between the right mouth corner and left mouth corner, when smiling
Smiling mouth corner line (°) Absolute value of the angle between the line connecting both mouth corners and the intercanthus horizontal plane, when smiling
Fig. 2 Calibration of a clinical picture of a patient’s smile according to the 3D CT image (e.g., preoperative image). a 2D photograph; b 3D CT image.
At first, the lateral intercanthus distance (white α) in the smile picture matched that (white α’) in the 3D CT image. The vertical ratio of the photograph was modified by adjusting the vertical distance (black β) from the lateral intercanthus line to the anterior tooth in the smile picture to match that (black β’) in the 3D CT image. The vertical distance of the lips during smiling, which is the shortest distance (blue line) from the lateral intercanthus line (red line) to the mouth corner in the photograph
acquired preoperative and postoperative data by editing the preoperative and postoperative smile pictures via the same procedure. We also calculated the magnitude of change after surgery.
Measurement of error induced by the photo editing process
We randomly selected ten patients from the sample of 21 subjects. Their preoperative pictures of mouths at rest were modified using the same calibrating procedure used for the smiling pictures. The revised pictures were used to measure the vertical distances of the lips at rest.
We used the V-Ceph ver. 6.0 (OSSTEM IMPLANT Co.) software to measure the right and left lateral canthus distances of the patients ’ lips at rest. Then, we adjusted the lateral intercanthus distance of the photograph to that measured on the preoperative CT data.
Using the revised picture, we measured the vertical distance from the line that connects the left and right lateral canthus to the right mouth corner. We also mea- sured the vertical distance from the lateral canthus plane to the right mouth corner on the preoperative CT data.
Then, we modified the vertical ratio of the resting pic- ture that was adjusted using the lateral intercanthus dis- tance to match the distance from the intercanthus line to the right mouth corner of the picture and the pre- operative CT. After these modifications, the lateral inter- canthus distance and distance from the lateral intercanthus line to the central incisors were the same as those measured on the preoperative CT data. Then, using the revised picture, we measured the vertical dis- tance from the lateral intercanthus line to the right mouth corner. We also measured the vertical distance from the intercanthus horizontal plane to the right mouth corner on the CT image and defined the absolute values of this difference in distance as the error of the clinical photographs. One time per patient, one observer measured the distance in the image of the patients.
Intraoperator error
We used the ten randomly selected patients for measur- ing errors for clinical photo adjustment. To measure the intraoperator error, one observer measured the vertical distance from the intercanthus line to the right mouth corner in these pictures and measured the errors in the reference points during each trial one time per patient.
The intraoperative error during CT image measure- ments was measured using preoperative CT images of the same ten patients. The intraoperative error during CT image measurements was defined as the difference in the distances from the intercanthus horizontal plane to the right mouth corner when repeatedly measured in ten patients.
Statistical analysis
We compared preoperative and postoperative results by Wilcoxon signed-rank test. The correlations among pre- operative and postoperative canting of the canines, cant- ing of the molars, slope of the canines, slope of the molars, canting of the lips at rest, and slope of the lips at rest were examined by regression analyses. Similarly, the correlations among preoperative and postoperative canting of the canines, canting of the molars, slope of the canines, slope of the molars, and canting and slope angle of the lips while smiling were analyzed by regres- sion analyses. The statistical significances of the results were verified using the IBM SPSS statistics 21 (IBM Corp., Armonk, NY, USA) program. The level of signifi- cance was set at 0.05.
Results
There were 21 subjects, 11 females and 10 males in this study. The mean age (mean ± standard deviation (SD)) was 22.0 ± 5.0 years. The average period of time from the surgery to the completion of the postoperative orthodontic treatments, photographs, and CT scans (mean ± SD) was 19.0 ± 10.2 months. After the surgery, the mandibular position of the patients was displaced to the posterior and the horizontal distance from the cor- onal plane to point B was reduced from a mean of 91.22 mm before surgery to a mean of 82.41 mm after surgery (P = <.001). The lateral displacement of the men- ton was also reduced from a mean of 4.54 mm before surgery to a mean of 1.50 mm after surgery (P = .001).
The mean vertical distances at the left and right first molars before surgery were 56.82 and 56.71 mm, respect- ively, and they were reduced to 54.06 and 54.54 mm, re- spectively, after surgery. The mean canting of the canines was 1.06 mm (range, 0.12 to 3.85 mm) before surgery and (range, 0.01 to 2.99 mm) after surgery. The mean canting of the molar areas was 1.40 mm (range, 0.30 to 3.67 mm) before surgery and 1.36 mm (range, 0.18 to 3.86 mm) after surgery, but the difference was not significant. The canting of the mouth corners at rest was reduced from 1.54 mm (range, 0.19 to 5.58 mm) before surgery to 0.94 mm (range, 0.08 to 2.54 mm) after surgery (P = .048). The canting of the mouth corners while smiling was increased from 1.09 mm (range, 0.09 to 4.45 mm) before surgery to 1.30 mm (range, 0.04 to 3.78 mm) after surgery.
The angle of the line that connects the first molars was slightly reduced from 1.44° before surgery to 1.40°
after surgery, but the difference was not significant.
Similarly, the angle of the line that connects the canines was slightly reduced from 1.75° before surgery to 1.71°
after surgery, but the difference was not significant. The
angle of the line connecting the mouth corners at rest
was also reduced from 0.70° before surgery to 0.56° after
surgery. Finally, the angle of the line connecting the
mouth corners while smiling was increased from 1.19°
before surgery to 1.42° after surgery (Table 2). The mean difference in canting of the canines and first molars was about 1.4 mm. The mean difference in canting of the lips while smiling was about 1.2 mm. The mean differences in the angles of the lines that connect the canines and first molars were 2.3° and 1.4°, respectively. The mean differences in the angles of the lips at rest and while smiling were 0.6° and 1.4°, respectively (Table 2).
There was a significant correlation between the magni- tudes of the postoperative changes in the canting of the mouth corners at rest and in the canting of the canines (P = .009). Similarly, there was also a significant correl- ation between the magnitudes of the postoperative changes in the canting of the mouth corners at rest and in the canting of the first molars (P = .023). In addition, there was a significant correlation between the extent of the postoperative change in the canting of the mouth corners at rest and the change in the slope of the line that connects both canines (P = .010). Similarly, there was a significant correlation between the magnitude of the postoperative change in the canting of the mouth corners at rest and the change in the slope of the line that connects both first molars (P = .017) (Table 3).
However, there was no significant correlation between the changes in the slope of the line that connects the
mouth corners at rest and the lines that connect the ca- nines and connect the molars. Similarly, there was no significant correlation between the change in the slope of the line that connects the mouth corners at rest and the postoperative changes in canting of the canines and the molars (Table 4). The magnitude of the postopera- tive change in canting of the mouth corners when smil- ing was not significantly correlated with the extent of the postoperative changes in the canting and the slopes of the canines, molars, and lips at rest (Table 5). Simi- larly, the magnitude of the postoperative change in the slope angles of the mouth corners while smiling was not significantly correlated with the change in the canting and the slopes of the canines, molars, and lips at rest (Table 6).
The intraoperator error for the clinical pictures, which was measured by comparing the vertical distance measurements of the mouth corners, was 0.17 ± 0.11 mm (mean ± SD). The intraoperator error for the CT data, which was measured by comparing the vertical distance measurements of the mouth cor- ners, was 0.27 ± 0.16 mm (mean ± SD). The error induced by photo adjustment, which was measured by comparing the values of the canting of the lips at rest on the CT and clinical pictures, was 0.63 ± 0.53 mm (mean ± SD).
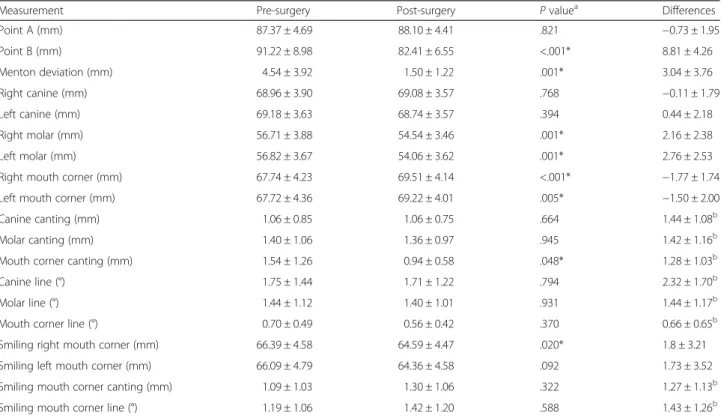
Table 2 Measurement results pre-, post-surgery, and differences (mean ± SD)
Measurement Pre-surgery Post-surgery P valuea Differences
Point A (mm) 87.37 ± 4.69 88.10 ± 4.41 .821 −0.73 ± 1.95
Point B (mm) 91.22 ± 8.98 82.41 ± 6.55 <.001* 8.81 ± 4.26
Menton deviation (mm) 4.54 ± 3.92 1.50 ± 1.22 .001* 3.04 ± 3.76
Right canine (mm) 68.96 ± 3.90 69.08 ± 3.57 .768 −0.11 ± 1.79
Left canine (mm) 69.18 ± 3.63 68.74 ± 3.57 .394 0.44 ± 2.18
Right molar (mm) 56.71 ± 3.88 54.54 ± 3.46 .001* 2.16 ± 2.38
Left molar (mm) 56.82 ± 3.67 54.06 ± 3.62 .001* 2.76 ± 2.53
Right mouth corner (mm) 67.74 ± 4.23 69.51 ± 4.14 <.001* −1.77 ± 1.74
Left mouth corner (mm) 67.72 ± 4.36 69.22 ± 4.01 .005* −1.50 ± 2.00
Canine canting (mm) 1.06 ± 0.85 1.06 ± 0.75 .664 1.44 ± 1.08b
Molar canting (mm) 1.40 ± 1.06 1.36 ± 0.97 .945 1.42 ± 1.16b
Mouth corner canting (mm) 1.54 ± 1.26 0.94 ± 0.58 .048* 1.28 ± 1.03b
Canine line (°) 1.75 ± 1.44 1.71 ± 1.22 .794 2.32 ± 1.70b
Molar line (°) 1.44 ± 1.12 1.40 ± 1.01 .931 1.44 ± 1.17b
Mouth corner line (°) 0.70 ± 0.49 0.56 ± 0.42 .370 0.66 ± 0.65b
Smiling right mouth corner (mm) 66.39 ± 4.58 64.59 ± 4.47 .020* 1.8 ± 3.21
Smiling left mouth corner (mm) 66.09 ± 4.79 64.36 ± 4.58 .092 1.73 ± 3.52
Smiling mouth corner canting (mm) 1.09 ± 1.03 1.30 ± 1.06 .322 1.27 ± 1.13b
Smiling mouth corner line (°) 1.19 ± 1.06 1.42 ± 1.20 .588 1.43 ± 1.26b
Differences change between the preoperative state and postoperative result (preoperative value-postoperative value), SD standard deviation
*P < .05
aSignificance according to the Wilcoxon signed-rank test
bAbsolute value of difference
Discussion
As mentioned in the “Results” section, the postoperative differences in the canting and slope angles of the mouth corners while smiling were not significantly correlated with the postoperative differences in the canting and the slopes of the canines, molars, and lip line at rest. How- ever, there was a significant correlation between the postoperative difference in canting of the mouth corners at rest and the change in the slope of the line that con- nects the canines.
A previous study that used soft tissue scanners and CT data reported there was a significant relationship be- tween the degree of vertical positional change of the jaws and that of the lips after orthognathic surgery in patients with mandibular prognathism and facial asym- metry [2]. Similar results were also found in the present study. After orthognathic surgery in the canines and first molars, the degree of vertical positional changes of the jaw and lips were significantly correlated. However, after the same surgery, the degree of vertical positional change of the jaw was not significantly correlated with that of the lips while smiling.
The results of the present study show that orthognathic surgery results in different degrees of improvement of lip asymmetry while smiling and at rest. Benson and Laskin reported that lip canting while smiling may be different from the occlusal level in subjects without clinical facial asymmetry [5]. In addition, another study reported that the magnitude of facial expressions, including maximum smiling, were not significantly changed after orthognathic
surgery for patients with facial asymmetry [4]. The pos- ition of the muscles may be changed through orthognathic surgery, but it is difficult to accurately predict the direc- tion of this change [4, 5]. Lip asymmetry while smiling may result from activities of the zygomaticus major muscle [6]. Furthermore, muscle activity while smiling may be affected by psychological factors [7]. Therefore, an evaluation of the sizes and positions of facial muscles and an electromyography may be required for more accurate prediction of the results from orthognathic surgeries [6].
Thus, in agreement with the current study, previous re- ports suggested that lip asymmetry when smiling may not coincide with lip asymmetry at rest and may not be im- proved by orthognathic surgery.
The present study employed clinical photographs to assess lip line canting while smiling, which is one of the limitations. Smiling is not a static phenomenon. Predict- ability may be unclear in assessing the smile, as the pre- cise anatomic location of many of their points could be significantly altered on the basis of muscle tone related to smiling and factors such as response to light (photo- graphic flash), time of day, etc. We calibrated the length of the clinical photos based on our CT data by adjusting the distance ratio of the photo in accordance with the CT data. This process may have produced errors. The absolute value of the mean error that occurred during the calibrating process was 0.63 mm. There also may have been an error while measuring the lips during smil- ing from clinical photographs. Also, calibration method adjusted for the degree of relative magnification but
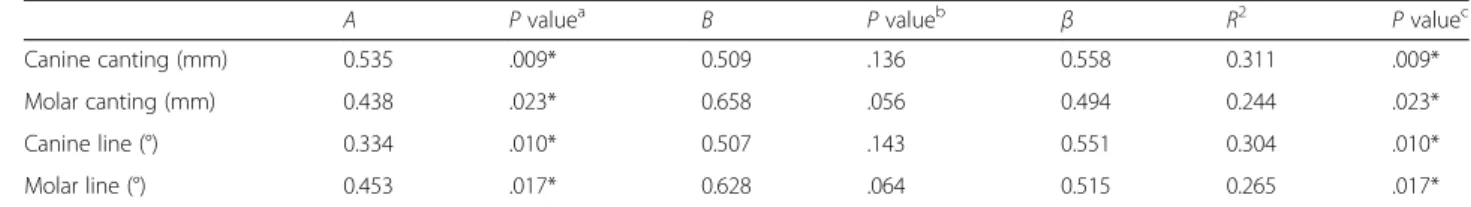
Table 3 Regression analysis of mouth corner canting (mm) according to the changes in the canine and molar areasA P valuea B P valueb β R2 P valuec
Canine canting (mm) 0.535 .009* 0.509 .136 0.558 0.311 .009*
Molar canting (mm) 0.438 .023* 0.658 .056 0.494 0.244 .023*
Canine line (°) 0.334 .010* 0.507 .143 0.551 0.304 .010*
Molar line (°) 0.453 .017* 0.628 .064 0.515 0.265 .017*
A non-standardized regression coefficient, B constant,β standardized regression coefficient, R2coefficient of determination
*P < .05
aSignificance of non-standardized regression coefficient
bSignificance of constant
cSignificance of regression analysis
Table 4 Regression analysis of the mouth corner line (°) according to the changes in the canine and molar areas
A P valuea B P valueb β R2 P valuec
Canine canting (mm) −0.128 .358 0.850 .002* −0.211 0.045 .358
Molar canting (mm) −0.125 .330 0.844 .002* −0.224 0.050 .330
Canine line (°) −0.081 .359 0.853 .002* −0.211 0.045 .359
Molar line (°) −0.133 .295 0.858 .001* −0.240 0.058 .295
A non-standardized regression coefficient, B constant,β standardized regression coefficient, R2coefficient of determination
*P < .05
aSignificance of non-standardized regression coefficient
bSignificance of constant
cSignificance of regression analysis
would not necessarily adjust for dynamic changes related to muscle tone.
We conducted analysis on a mixture of images; one was 3D data and the others were 2D photographs. Meas- uring lip smile from 2D photographs is inaccurate and does not represent the 3D nature of this facial expres- sion. Standardization is difficult in defining for facial ex- pression before and after surgery; this may be essential to provide the corrected measurements. Canting of the lip corners will depend on the magnitude and extent of the smile; this has to be standardized, and evidence should be provided regarding the reproducibility of this facial expression. The authors agree that this may be a crucial factor in this study; without standardization of fa- cial expressions, it would be almost impossible to meas- ure dynamic soft tissue changes and relate them to the performed surgery.
To overcome these limitations of using clinical photo- graphs for measurements, researchers may use facial scan- ners to acquire 3D images of the facial soft tissues or use two cameras to form a 3D image of the face [2, 4]. That being said, 3D images of faces have been used to verify the changes in soft tissues and the facial skeleton related to orthognathic surgeries [8, 9]. Additionally, postoperative swelling, particularly in the midface and perioral regions, could substantially affect the magnitude of soft tissue
movements with smiling, as well as the surface features on a 2D photograph. In the current study, the average period of time from the surgery to the completion of the postoperative orthodontic treatments, photographs, and CT scans (mean ± SD) was 19.0 ± 10.2 months.
This study only involved the cases of patients with mandibular prognathism accompanied by facial asym- metry. For patients with maxillary or mandibular hypo- plasia, orthognathic surgeries may significantly improve the magnitude of their facial expressions [2, 4, 10, 11].
We showed a negative result of study in a sample of 21 patients. We should have demonstrated quantitatively that our results are truly related to non-significance of the postulated associations, rather than a sample size issue. Further studies will examine the displacement of the jaw in orthognathic surgeries, including the pitch, roll, and yaw, as well as the changes of lip lines when smiling when the direction of lip canting changes after various surgeries [12]. We expect these studies to pro- vide valuable knowledge for predicting the changes, in- duced by orthognathic surgery, in lip lines while smiling.
The mean value of lip canting was less than 2 mm, which was another limitation of this study. The mean lip canting value was also reduced from 1.54 mm before surgery to 0.94 mm after surgery. In addition, there were no large differences in the lip slopes before and after
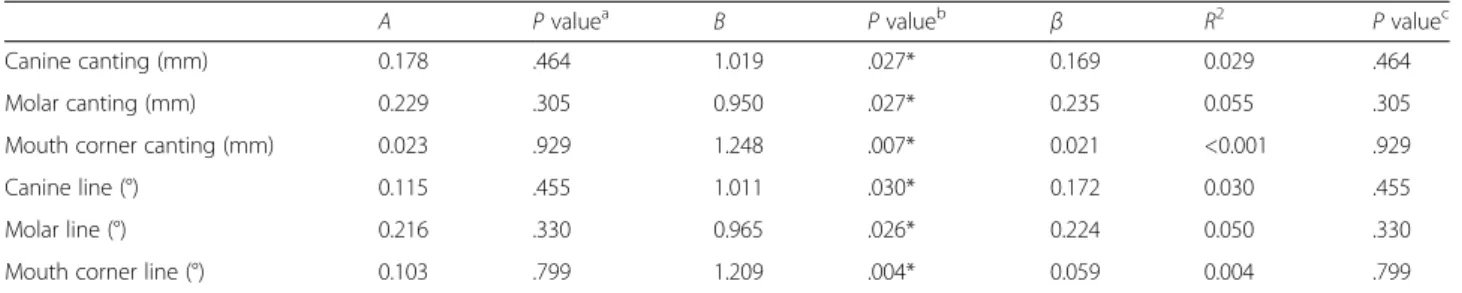
Table 5 Regression analysis of mouth corner canting (mm) when smiling according to the changes in the canine and molar areasA P valuea B P valueb β R2 P valuec
Canine canting (mm) 0.178 .464 1.019 .027* 0.169 0.029 .464
Molar canting (mm) 0.229 .305 0.950 .027* 0.235 0.055 .305
Mouth corner canting (mm) 0.023 .929 1.248 .007* 0.021 <0.001 .929
Canine line (°) 0.115 .455 1.011 .030* 0.172 0.030 .455
Molar line (°) 0.216 .330 0.965 .026* 0.224 0.050 .330
Mouth corner line (°) 0.103 .799 1.209 .004* 0.059 0.004 .799
A non-standardized regression coefficient, B constant,β standardized regression coefficient, R2coefficient of determination
*P < .05
aSignificance of non-standardized regression coefficient
bSignificance of constant
cSignificance of regression analysis
Table 6 Regression analysis of the mouth corner line (°) when smiling according to the changes in the canine and molar areas
A P valuea B P valueb β R2 P valuec
Canine canting (mm) 0.091 .736 1.303 .014* 0.078 0.006 .736
Molar canting (mm) 0.277 .263 1.040 .439 .256 0.065 .263
Mouth corner canting (mm) −0.099 .727 1.563 .003* −0.081 0.007 .727
Canine line (°) 0.064 .709 1.287 .015* 0.087 0.007 .709
Molar line (°) 0.262 .286 1.057 .027* 0.244 0.060 .286
Mouth corner line (°) 0.075 .867 1.386 .003* 0.039 0.002 .867
A non-standardized regression coefficient, B constant,β standardized regression coefficient, R2coefficient of determination
*P < .05
aSignificance of non-standardized regression coefficient
bSignificance of constant
cSignificance of regression analysis
surgery (0.70° before surgery and 0.56° after surgery) and the slopes were also less than 1°, which was another limitation of this study. The threshold for the recogni- tion of an occlusal cant was suggested to be 4° in a 2D frontal plane study [13, 14]. Most surgeons would agree that an occlusal cant of <3°–4° is likely not significant enough to pose a noticeable problem for a lay observer [13]. As such, it seems that the degree of lip asymmetry in the frontal plane among this cohort was relatively small at the level of occlusal plane. The manifest change at the level of the chin was more substantial but may dif- ferentially affect the lower lip soft tissues relative to the upper lip, influencing smiling in a less predictable way [15]. The present study did not clinically recognize oc- clusal cant or lip asymmetry; rather, it examined the cor- relation between lip asymmetry at rest and when smiling after orthognathic surgery. Further studies will be re- quired to examine patients with more severe lip canting using various 3D imaging methods for clinical recogni- tion of lip asymmetry [16–18].
The mean intraoperator error for the CT images was 0.27 mm, which was larger than that for the clinical pic- tures (0.17 mm). This is presumed to be due to a change of the horizontal plane, which was induced by an accu- mulation of intraoperator errors while setting anatomical structures required for the reference horizontal planes in the 3D CT images. The results of this study indicated that the magnitudes of the postoperative changes in the canting and the slope of the mouth corners at rest were significantly correlated with the changes in the canting and slopes of the canines and the molars. However, the magnitude of the postoperative improvement of the lip lines when smiling was not significantly correlated with the changes in the canting and slopes of the canines, molars, and lip lines at rest. Hence, it is still difficult to predict the changes in lip lines while smiling after an orthognathic surgery in patients with mandibular prog- nathism accompanied by facial asymmetry.
Conclusions
In conclusion, the magnitude of the postoperative lip line improvement while smiling was not significantly correlated with changes in the canting and slopes of the canines, molars, and lip lines at rest. It remains difficult to predict lip line changes while smiling after orthog- nathic surgery in patients with mandibular prognathism, accompanied by facial asymmetry.
Ethics statement/confirmation of patient’s permission
Ethical approval was provided by the Institutional Re- view Board of the NHIS Ilsan Hospital.
Competing interests
The authors declare that they have no competing interests.
Authors’ contributions
SHK and MKK participated in the surgery with simulation. SHK, MKK, and JYL were responsible for the conception and design of the study, and SIA was involved in the acquisition of data and translation of the manuscript. JYL was responsible for drafting the article and/or critical revision. All authors read and approved the final manuscript.
Author details
1Department of Oral and Maxillofacial Surgery, National Health Insurance Service Ilsan Hospital, 100 Ilsan-ro, Ilsan-donggu, Goyang, Gyeonggi-do 410-719, Republic of Korea.2Department of Orthodontics, National Health Insurance Service Ilsan Hospital, 100 Ilsan-ro, Ilsan-donggu, Goyang, Gyeonggi-do 410-719, Republic of Korea.
Received: 4 January 2016 Accepted: 16 March 2016
References
1. Kim YH, Jeon J, Rhee JT, Hong J (2010) Change of lip cant after bimaxillary orthognathic surgery. J Oral Maxillofac Surg 68(5):1106–1111. doi:10.1016/j.
joms.2009.07.030
2. Ko JM, Choi JY, Baek SH (2015) Evaluation of Lip Cant Change by 2-Jaw Surgery in Class III Asymmetry Cases Using Three-Dimensional Facial Scan in Conjunction With Computed Tomographic Images. J Craniofac Surg 26(4):
e283–288. doi:10.1097/scs.0000000000001555
3. Balaji SM (2010) Change of lip and occlusal cant after simultaneous maxillary and mandibular distraction osteogenesis in hemifacial microsomia.
J Maxillofac Oral Surg 9(4):344–349. doi:10.1007/s12663-010-0157-x 4. Al-Hiyali A, Ayoub A, Ju X, Almuzian M, Al-Anezi T (2015) The Impact of
Orthognathic Surgery on Facial Expressions. J Oral Maxillofac Surg. doi:10.
1016/j.joms.2015.05.008
5. Benson KJ, Laskin DM (2001) Upper lip asymmetry in adults during smiling.
J Oral Maxillofac Surg 59(4):396–398. doi:10.1053/joms.2001.21874 6. Cho JH, Kim EJ, Kim BC, Cho KH, Lee KH, Hwang HS (2007) Correlations of
frontal lip-line canting with craniofacial morphology and muscular activity.
Am J Orthod Dentofacial Orthop 132(3):278.e277–214. doi:10.1016/j.ajodo.
2007.01.015
7. Epstein LH (1990) Perception of activity in the Zygomaticus major and Corrugator supercilii muscle regions. Psychophysiology 27(1):68–72 8. Mishima K, Yamada T, Matsumura T, Moritani N (2011) Analysis of lip motion
using principal component analyses. J Craniomaxillofac Surg 39(4):232–236.
doi:10.1016/j.jcms.2010.04.006
9. Katsumata A, Fujishita M, Maeda M, Ariji Y, Ariji E, Langlais RP (2005) 3D-CT evaluation of facial asymmetry. Oral Surg Oral Med Oral Pathol Oral Radiol Endod 99(2):212–220. doi:10.1016/j.tripleo.2004.06.072
10. Hajeer MY, Ayoub AF, Millett DT (2004) Three-dimensional assessment of facial soft-tissue asymmetry before and after orthognathic surgery. Br J Oral Maxillofac Surgery 42(5):396–404. doi:10.1016/j.bjoms.2004.05.006 11. Fujita T, Shirakura M, Koh M, Itoh G, Hayashi H, Tanne K (2013) Changes in
the lip-line in asymmetrical cases treated with isolated mandibular surgery.
J Orthod 40(4):313–317. doi:10.1179/1465313313y.0000000056
12. Shimomatsu K, Nozoe E, Ishihata K, Okawachi T, Nakamura N (2012) Three- dimensional analyses of facial soft tissue configuration of Japanese females with jaw deformity–a trial of polygonal view of facial soft tissue deformity in orthognathic patients. J Craniomaxillofac Surg 40(7):559–567. doi:10.1016/
j.jcms.2011.10.009
13. Padwa BL, Kaiser MO, Kaban LB (1997) Occlusal cant in the frontal plane as a reflection of facial asymmetry. J Oral Maxillofac Surg 55(8):811–816, discussion 817
14. Susarla SM, Dodson TB, Kaban LB (2008) Measurement and interpretation of a maxillary occlusal cant in the frontal plane. J Oral Maxillofac Surg 66(12):
2498–2502. doi:10.1016/j.joms.2008.06.072
15. Hwang HS, Min YS, Lee SC, Sun MK, Lim HS (2009) Change of lip-line cant after 1-jaw orthognathic surgery in patients with mandibular asymmetry.
Am J Orthod Dentofacial Orthop 136(4):564–569. doi:10.1016/j.ajodo.2007.
10.060
16. Shujaat S, Khambay BS, Ju X, Devine JC, McMahon JD, Wales C, Ayoub AF (2014) The clinical application of three-dimensional motion capture (4D): a novel approach to quantify the dynamics of facial animations. Int J Oral Maxillofac Surg 43(7):907–916. doi:10.1016/j.ijom.2014.01.010
17. Nahm KY, Kim Y, Choi YS, Lee J, Kim SH, Nelson G (2014) Accurate registration of cone-beam computed tomography scans to 3-dimensional facial photographs. Am J Orthod Dentofacial Orthop 145(2):256–264. doi:10.
1016/j.ajodo.2013.10.018
18. Galantucci LM, Percoco G, Lavecchia F, Di Gioia E (2013) Noninvasive computerized scanning method for the correlation between the facial soft and hard tissues for an integrated three-dimensional anthropometry and cephalometry. J Craniofac Surg 24(3):797–804. doi:10.1097/SCS.
0b013e31828dcc81
Submit your manuscript to a journal and benefi t from:
7 Convenient online submission 7 Rigorous peer review
7 Immediate publication on acceptance 7 Open access: articles freely available online 7 High visibility within the fi eld
7 Retaining the copyright to your article
Submit your next manuscript at 7 springeropen.com