J Electr Eng Technol.2018; 13(6): 2421-2424 http://doi.org/10.5370/JEET.2018.13.6.2421
2421 Copyright ⓒ The Korean Institute of Electrical Engineers
This is an Open-Access article distributed under the terms of the Creative Commons Attribution Non-Commercial License (http://creativecommons.org/ licenses/by-nc/3.0/) which permits unrestricted non-commercial use, distribution, and reproduction in any medium, provided the original work is properly cited.
Measurement of a Threshold Initiation Carrier Density for a Reduction
in Gas Breakdown Voltage
Hyunho Park*,** and Youngmin Kim
†Abstract
– A direct measurement of an initiation carrier injection for a low voltage discharge is presented. A self-sustained pulsed discharge is utilized to characterize electrical responses of a glow discharge for varying amounts of injected initiation carriers. It is clearly demonstrated that the initiation carrier injection affects the ignition time and the breakdown voltage of the primary discharge. An abrupt reduction in the breakdown voltage for a 300 μm gap pin-plate discharge is observed when a threshold carrier density of 3×1011 cm−3 is injected and the breakdown voltage continues to decrease to 250 V with increasing the initiation carrier injection beyond the threshold density.Keywords:
Afterglow, Atmospheric plasma, threshold density, DBD.1. Introduction
Reducing a breakdown voltage for atmospheric plasma generation has been a topic of much research interest for several applications, such as plasma actuation for aerodynamics and plasma medicine [1,2]. Injecting seed plasma prior to a primary discharge has been known as an effective means to reduce the breakdown voltage. Impact ionization with sufficient initiation carriers results in an avalanche breakdown at a much lower voltage than one required for Townsend avalanche. Various techniques for the initiation carrier injection have been reported, such as UV, electrical, thermal techniques [3,4,5] and the effect of the initiation carriers on an atmospheric discharge has been extensively studied [6,7]. The methods used for injecting the initiation carriers frequently rely on the diffusion of the afterglow, but measurement of the amounts of the afterglows which actually participated in the discharge has been hardly done due to complexity of ionic diffusion in the afterglow [7]. Identification of a threshold carrier density for a reduction in a breakdown voltage is very important to deliver stable atmospheric plasma generation at a low voltage. A few researchers [4,8] have reported the measurement of the emission intensity decay to deduce a temporal electron density in the afterglow, but since local isolation of the emission from a millimeter scale discharge is extremely hard to do, accurate measurement of diffusion induced afterglow over space has not been reported.
In this work, we propose a novel method of measuring initiation carrier density by utilizing afterglow over time in a pulsed discharge instead of measuring the afterglow over space as earlier works [4,8]. The initiation carriers are
directly injected into the collisional pathway of the primary discharge using a self-sustained pulsed discharge and the amount of the injected initiation carriers is modulated by adjusting a duty ratio of the pulsed discharge. The results reveal existence of a threshold initiation carrier density required for a substantial reduction in the breakdown voltage and suggest the threshold densities of initiation carriers for various electrode gaps.
2. Experiments
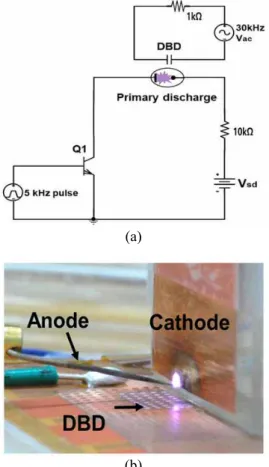
The experimental setup and a bias circuit for plasma generation are shown in Fig. 1. A tungsten probe and a 25 μm thick copper tape on a glass substrate were used as anode and cathode, respectively. Separate electrodes are located at 5 mm below the anode and cathode for dielectric barrier discharge (DBD), which provide initiation carriers prior to a primary discharge. The DBD was generated by an 800 V voltage source with a frequency of 30 kHz under argon pressure of 460 Torr. Electrical characteristics and device fabrication for DBD were presented in our previous work [9]. In the presence of the DBD current, the pulsed discharge was generated at 450 V or less across the gap of 300 μm between the anode and the cathode by switching the bipolar junction transistor (BJT) in the bias circuit.
The pulsed discharge sustained even after turning off the DBD when the duty ratio of the pulsed voltage was properly adjusted. However, without DBD, the pulsed discharge was not ignited even with a voltage source of 1.1 kV. In this work, DBD was used only for ignition of the pulsed discharge and all electrical responses were measured after turning off DBD.
Pulsed discharge currents were measured using an oscilloscope (Agilent MS07104) (Fig. 2). Fig. 2 exhibits that the shorter off-time initiates the subsequent discharge faster when a pulsed voltage is applied. Dependence of † Corresponding Author: School of Electrical and Electronic Engineering,
Hong-ik University, Korea. ([email protected])
* School of Electrical and Electronic Engineering, Hong-ik University, Korea. ([email protected])
** DB Hitek, Korea. ([email protected]) Received: March 8, 2018; Accepted: May 10, 2018
ISSN(Print) 1975-0102 ISSN(Online) 2093-7423
Measurement of a Threshold Initiation Carrier Density for a Reduction in Gas Breakdown Voltage
2422 │ J Electr Eng Technol.2018; 13(6): 2421-2324
transient response on the off-time will be further understood later. The discharge current was controlled by a ballast resistor and the measurement of a relatively constant discharge voltage between the anode and the cathode for varying the steady-state discharge currents implies the
formation of a glow discharge. Note that due to the transient delay of the bipolar (Fairchild KSC2752), a switching delay of 4 μs was observed at the discharge cut-off and this delay was taken into account for calculating the actual post-discharge times in this study.
3. Results and Discussion
To investigate the correlation between the post-discharge time and the transient response of the discharge, we have measured the voltage-current characteristics of the discharge as a function of the post-discharge time. Fig. 3 shows a plot of the temporal responses of the device voltage versus the discharge current for varying post-discharge times. The device voltage continues to rise prior to breakdown and then abruptly reduces at breakdown, which results in a rapid increase in the discharge current. As the post-discharge time increases, the avalanche process takes a longer time to occur, which leads to a higher breakdown voltage. The results indicate that the impact ionization with fewer residual ions would take a longer time to reach sufficient avalanche amplification. Shorter post-discharge times result in a lower breakdown voltage and a faster turn-on response time.
If argon ion bombardment at the cathode surface is the main source of secondary emission, the minimum time required for the positive feedback mechanism would be some fraction of the argon ion transit time (τ) from anode to cathode.
τ = L/υ = L /μE (1)
where L denotes the gap between anode and cathode. Also, υ represents the mean drift velocity of argon ions.
For this study, as L=300 μm and argon mobility μ = 4 cm2/V-S at 460 Torr [10] are used, the minimum transit time is calculated as 0.23 μs. Based on the measured turn-on times from 0.4 μs to 1 μs, a few transits across the gap (a)
(b)
Fig. 1. (a) Experimental setup with a bias circuit and (b) an
image of pulsed glow discharge. Pulsed glow discharge was generated between an anode and a cathode. Mesh electrodes were used for dielectric barrier discharge (DBD) with a separate AC voltage source to ignite the pulsed discharge
Fig. 2. Post discharge time modulation by BJT switching.
The pulsed discharge was generated by switching the BJT, which controlled the post discharge time and the corresponding discharge currents
Fig. 3. Temporal responses of voltage-current characteristics
for the pulsed discharge. The turn-on behavior appears to be affected by the previous post-discharge time
Hyunho Park and Youngmin Kim
http://www.jeet.or.kr │ 2423
may be expected to reach the avalanche breakdown, Also, the breakdown voltage was significantly reduced to 280 V for an off-time of 6 μs, which is remarkably small compared to one without initiation carriers. Once it breaks down, the device was kept at a constant voltage of 250 V regardless of the post-discharge time. Such discharge behavior suggests a secondary electron-induced discharge may dominate the sustaining discharge process. The post-discharge time beyond 16 μs was also measured, but the pulsed discharge could not sustain itself after the DBD was turned off and the breakdown did not occur with a voltage source of 1.1 kV, suggesting there is a minimum initiation carrier density required for the avalanche breakdown. The existence of a threshold carrier density for the discharge has been discussed in earlier works [3], but experimental measurement of the threshold carrier density has not been reported. In previously reported studies [3,4,8], afterglow diffusion was mainly employed for carrier injection to the collisional pathway, but estimation of the afterglows participating in the discharge became very difficult due to the ionic diffusion with electrostatic repulsion.
In this work, the self-sustaining pulsed discharge allows the use of the identical electrodes for both the initiation carrier generation and the primary discharge, directly locating most of residual afterglows in the collisional path of the primary discharge without relying on diffusion.
The residual afterglow density was estimated using a recombination model for the plasma. The residual ions and electrons in the post-discharge are known to undergo dissociative recombination [12]. The electron concentration after the discharge cut-off can be modeled using the equation below [8].
( )
o/ 1(
o)
e e e n t =n +an t (2) o en is the initial electron density at the discharge cut-off, t represents the time from the discharge cut-off (t=0) and
a is recombination coefficient of the electron.
Fig. 4 illustrates the calculated electron density decay
during post-discharge in argon at a pressure of 460 Torr. The initial electron density neo at post-discharge was calculated using a drift current model [5]. The model used a steady-state discharge current of 21 mA shown in Fig. 3 and an average cross section (1.6 mm2) of the current calculated from the measured area of the cathode glow.
The electron mobility used was 730 cm2/V·s [10] and the recombination coefficient (α) used was 1.8×10⁻⁷ cm3/s, which was obtained for the electron temperature of 3000 K [12]. The electron temperature of 3000 K was measured using the N2 emission spectrum obtained from SPECAIR as described in our previous work [11]. The calculated initial electron density was 1012 cm-3, but the residual electrons rapidly decrease after the discharge cut-off and over 70 % of the initial afterglows diminishes within 10 μs.
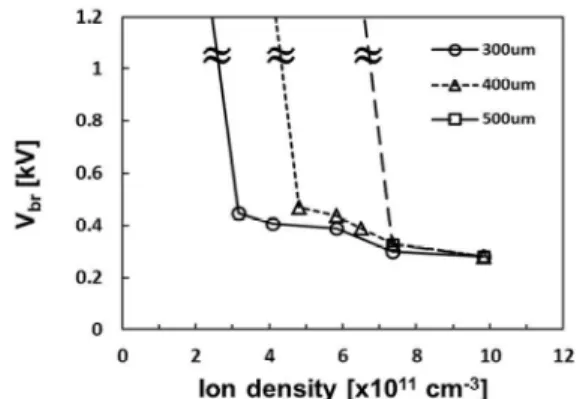
Based on the results given in Fig. 3 and Fig. 4, the dependence of the breakdown voltage on the initiation carrier density is obtained as shown in Fig. 5. The density of the initiation carriers is deduced from the electron decay model during the post-discharge (Fig. 4). The corresponding breakdown voltage is drawn as marked in Fig. 3. An abrupt reduction in the breakdown voltage is observed in the gap of 300 μm when the initiation carrier density becomes 3×1011 cm-3. For a carrier density smaller than 3×1011 cm-3, the breakdown does not occur, which behaves as a threshold density of the initiation carrier. Beyond the threshold density, the breakdown voltage continues to reduce for increasing initiation carrier densities. The breakdown voltage decreases to values as low as a discharge sustaining voltage of 250 V when the initiation carriers greater than 8×1011 cm-3 are provided.
The threshold initiation carrier density appears to increase for larger gap discharges. It is speculated that longer transit times of the ions likely cause a delay in the secondary emission, resulting in a slower avalanche breakdown and thus more initiation carriers are needed to trigger a positive feedback avalanche breakdown. The dependence of the threshold carrier density on the plasma conditions, such as
Fig. 4. Electron density decay after discharge cut-off in
argon. Initial electron density is calculated using a drift current model for the discharge current of 21 mA
Fig. 5. Dependence of breakdown voltage on the initiation
carrier density. An abrupt reduction in the breakdown voltage is observed when a carrier density of 3×1011 cm-3 is provided in the gap of 300 μm prior to the primary discharge
Measurement of a Threshold Initiation Carrier Density for a Reduction in Gas Breakdown Voltage
2424 │ J Electr Eng Technol.2018; 13(6): 2421-2324
pressure or ambient gas, is currently being studied and more characterization of the threshold carrier density will offer a guideline for an initiation carrier injection scheme for a low voltage plasma generation.
4. Conclusion
An accurate measurement of threshold initiation carrier density for lowering breakdown voltages is presented. By utilizing afterglows in a pulsed discharge as initiation carriers, direct measurement of the afterglow threshold density was achieved. A quantitative correlation study reveals that the glow discharge across a 300 μm gap occurs at a voltage less than one-third of the breakdown voltage required for discharge without initiation carriers if an initiation carrier density exceeds the threshold density of 3×1011 cm-3. In addition, the threshold initiation carrier density is found to increase for larger gap discharges to compensate for the higher recombination losses caused by longer transit times.
Acknowledgements
This work was supported by the National Research Foundation of Korea(NRF) grant funded by the Korean Government(MSIP) (Nos. 2012R1A1A2006537 and 2015 R1D1A1A01060213)
References
[1] C. Louste, G. Artana, E. Moreau, G. Touchard, “Sliding discharge in air at atmospheric pressure: electrical properties,” J. Electrostatics, vol. 63, pp. 615-620, June 2005.
[2] M. Laroussi, “Low-Temperature Plasmas for Medi-cine?,” IEEE Trans, Plasma Sci. vol. 37, issue 6, pp. 714-725, June 2009.
[3] X. Tian and P. Chu, “Experimental investigation of the electrical characteristics and initiation dynamics of pulsed high-voltage glow discharge,” J. Phys. D: Appl. Phys., vol. 34, no. 3, pp. 354-359, 2001. [4] S. Luo, C. M. Denning, and J. Scharer, “Laser-rf
creation and diagnostics of seeded atmospheric pressure air and nitrogen plasmas,” J. Appl. Phys. 104, 013301 (2008).
[5] L. Lee and Y. Kim, “Low-Voltage Atmospheric Plasma Generation by Utilizing Afterglow Initiation Carrier,” Ieee Transaction on Plasma Science, vol. 41, issue 1, pp. 155-158, Jan. 2013.
[6] N. Brenning, I. Axnäs, J. O. Nilsson, and J. Eninger, “High-Pressure Pulsed Avalanche Discharges: For-mulas for Required Preionization Density and Rate for Homogeneity,” IEEE Transaction on Plasma
Science, vol. 25, no. 1, pp. 83-88, February 1997. [7] J. I. Levatter and S. Lin, “Necessary conditions for
the homogeneous formation of pulsed avalanche discharges at high gas pressures,” Journal of Applied Physics 51, p. 210, 2008.
[8] R. Hugon, M. Fabry and G. Henrion, “The influence of the respective durations of the discharge and the afterglow on the reactivity of a DC pulsed plasma used for iron nitriding,” J. Phys. D: Appl. Phys, vol. 29, no. 3, pp. 761-768, March 1996.
[9] S. Hwang, H. Park and Y. Kim, “Low Voltage Atmospheric Plasma Generation using DBD Initiation Carrier Injection,” KIEE Trans, vol. 67, no. 1, pp. 82-86, January 2018.
[10] Y. P. Raizer, “Gas Discharge Physics,” Chap. 13 (Springer, Berlin, 1991).
[11] Y. Kim and J. Park, “Highly efficient initiation carrier injection for nonthermal atmospheric plasma generation,” J. Vac. Sci. Technol. B, vol. 33, no. 6, 062002-1, 2015.
[12] Y. Shiu and M.A. Biondi, “Dissociative recombination in argon: Dependence of the total rate coefficient and excited-state production on electron temperature,” Phys. Rev. A 17, pp. 868-872, 1978.
Hyunho Park He received the B.S.
and M.S. degrees from Hongik Univer-sity, Seoul, Korea, in 2009 and 2011, respectively. Since 2011, he has been working as a Device Reliability Analysis Engineer at DB Hitek. Currently, he is pursuing a Ph.D. degree in electronic and electrical engineering at Hongik University. His research interests include MEMS and plasma MEMS applications.
Youngmin Kim He received the B.S.
degree from Seoul National University, Seoul, Korea, in 1987 and the M.S. and Ph.D. degrees from the University of Texas, Austin, in 1990 and 1995, respectively, all in electrical engineering. From 1995 to 2002, he was with Texas Instruments, Dallas, TX, where he worked on deep submicron CMOS integration of 0.25-µm– 90-nm nodes. Since 2002, he has been with Hongik University, Seoul, where he is currently Professor in the School of Electronic and Electrical Engineering. His research interests include MEMS, Self-powered Sensors.