Detailed Lateral Flow Structure in a Square Sub-channel Geometry
Seok Kyu Chang,a Bok Deuk Kim,a Se Young Chun,a Won Pil Baek,a Young Don Choi,ba Korea Atomic Energy Research Institute, 105, Dukjin-Dong, Yusong-Ku, Daejon, 305-353, Republic of Korea skchang@kaeri.re.kr, bdkim@kaeri.re.kr, sychun@kaeri.re.kr, wpbaek@kaeri.re.kr
b Korea Univ., Mechanical Engineering Dept., 1, 5Ka, Anam-Dong, Sungbuk-Ku, Seoul, Korea, ydchoi@korea.ac.kr
1. Introduction
There are some attempts to design the mixing device of a spacer grid in a bundle array or verify its performance by using computational tools (CFD codes). These computational tools should be verified with various experimental data prior to the application. Up to now, the appropriate experimental data for comparison were still limited. There have been some investigations on this issue in recent years. Shen et al. [1] performed experiments of the cross flow mixing effect caused by spacer grids in a 4x4 rod array by using a Laser Doppler Velocimeter. Karoutas et al. [2] used the computational fluid dynamics (CFD) code, CFDS-FLOW3D to develop improved fuel designs for PWR cores. Langford et al. [3] employed a Particle Image Velocimetry (PIV) to measure the lateral velocity field in a 5x5 square-pitch rod bundle.
For getting more detailed information which is useful for verification of the CFD codes, enlarged sub-channel test loop was established. In a 5x5 rod bundle array with vaned spacer grid, detailed flow velocities were measured by using a laser Doppler velocimetry. The axial and lateral velocities and their turbulence properties were produced.
2. Experimental Apparatus
2.1 Experimental Facility
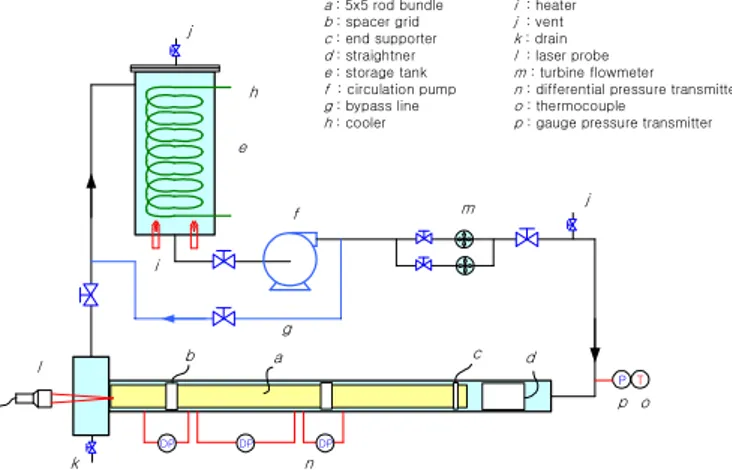
The experimental works have been conducted at the cold test loop in KAERI which can perform the hydraulic test at normal pressure and temperature conditions for a rod bundle array in water. The loop consists of a water storage tank, circulation pump and test section (Figure 1). Heater and cooler are contained in the water storage tank for maintaining the experimental temperature conditions during the test. The experimental loop conditions are monitored and controlled by electric signals from instruments likewise, thermocouples, pressure transmitters and flow-meters. During this experimental work, the loop temperature was maintained at 35 ºC and the system pressure was lower than 2.0 bar.
A 2-component laser Doppler velocimetry was used to measure the turbulent velocities in a rod bundle. It comprises Argon-ion laser source, optics and 2-D probe.
P T DP DP DP a b c d e f g h i j k j l m n o p a : 5x5 rod bundle b : spacer grid c : end supporter d : straightner e : storage tank f : circulation pump g : bypass line h : cooler i : heater j : vent k : drain l : laser probe m : turbine flowmeter n : differential pressure transmitter o : thermocouple
p : gauge pressure transmitter
Figure 1. Schematic diagram of the test loop
2.2 Test Section
Figure 2 shows the cross sectional configuration of the 5x5 rod bundle array. The duct size is 170x170mm which is 2.6 times larger than the real 5x5 bundle array size. The principal dimensions are rod dia., D=25.4mm, rod pitch, P=33.12mm, respectively. The dotted area is interesting region. The right upper figure describes the lateral velocity measuring points. These are 2,412 points and the measurement resolution is 0.75mm. The lower figure describes the axial velocity measuring paths. There are seven paths in a gap between two rows of rod (770 points).
0 5 10 15 20 25 30 35 0 10 20 30 40 50 60 70 80 X ( mm) Y ( m m )
Figure 2. LDV measurement locations (upper : lateral measuring points, lower : axial velocity measuring points) Transactions of the Korean Nuclear Society Autumn Meeting
Experiments were performed at the condition of the Re = 50,000 and the average velocity in the flow channel = 1.5 m/sec.
3. Experimental Results and Discussion
3.1 Lateral Velocity Vectors
There are many kinds of spacer grid according to the geometry of mixing device which causes the flow redistribution. In this work, two types of spacer grid were chosen for the flow mixing effects on within and inter sub-channel flow regions. One spacer grid is split type which has the dominant effect of transferring the flow into the neighbor sub-channels. The other is swirl type which has the dominant effect of swirling the flow within the sub-channel. Figure 3 shows some typical detailed velocity vectors of lateral flow. These velocity vectors are measured at the level of 4Dh (97.1mm) behind the location
of the spacer grid. Upper one shows the lateral velocity vectors generated by split type spacer grid. Main structure of the flow is simple splitting. Fluid from two sub-channel gaps is split into the other two sub-channel gaps. There are no distinct swirls within the sub-channels. Lower figure shows the lateral velocity vectors caused by swirl type spacer grid. Large swirl is generated by the vanes of the spacer grid.
Figure 3. Lateral velocity vectors at the level of 4 Dh behind the spacer grid (Upper : split type S/G, Lower : swirl type S/G)
3.2 Velocity Profiles
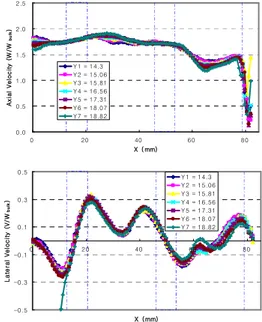
Figure 4 shows the axial and lateral velocity profiles in the rod gap for the case of the flow with the swirl type spacer grid. Data are measured at seven paths as shown in the figure 2. There are no large profile differences between paths. Axial profiles (upper figure) are almost flat because of the flow mixing caused by the spacer grid. Lower figure is the lateral velocity profiles. Velocity magnitudes exactly reflect the vane patterns of the spacer grid in the flow region.
0.0 0.5 1.0 1.5 2.0 2.5 0 20 40 60 80 X ( mm) A x ia l V e lo c it y ( W /W b u lk ) Y 1 = 14.3 Y 2 = 15.06 Y 3 = 15.81 Y 4 = 16.56 Y 5 = 17.31 Y 6 = 18.07 Y 7 = 18.82 -0.5 -0.3 -0.1 0.1 0.3 0.5 0 20 40 60 80 X ( mm) L a te ra l V e lo c it y ( V / W b u lk ) Y 1 = 14.3 Y 2 = 15.06 Y 3 = 15.81 Y 4 = 16.56 Y 5 = 17.31 Y 6 = 18.07 Y 7 = 18.82
Figure 4. Axial and lateral velocity profiles at the rod gap
4. Conclusion
Experimental system for the fine measurement of the sub-channel flow by adopting the enlarged test section and the LDV system was established. Detailed velocity vectors in sub-channels were measured for the typical spacer grid types. Turbulence characteristics will be investigated at various flow conditions for further work.
REFERENCES
[1] Shen, Y. F. Cao, Z. D. and Lu, Q. G., An Investigation of Crossflow Mixing Effect Caused by Grid Spacer with Mixing Blades in a Rod Bundle, Nucl. Eng. & Design, 125, pp.111-119, 1991
[2] Karoutas, Z., Gu, C. Y. and Scholin, B., 3-D Flow Analyses
for Design of Nuclear Fuel Spacer, Proceedings of the 7th Int.
Meeting on NURETH, Vol. 4, pp.3153-3174, 1995
[3] Langford, H. M., Armfield, M. V. and Beasley, D. E., Particle Image Velocimetry of Swirling Flow in a Subchannel of a Rod Bundle, Proceedings of the 2001 ASME Fluids Engineering Division Summer Meeting, New Orleans, May 29-June 1,