Comparison of Individual and Population Weighted Health Risks
Jongtae Jeong, a Tae Woon Kim, a and Jaejoo Haa Integrated Safety Assessment Division, Korea Atomic Energy Research Institute, [email protected]
1. Introduction
The comparative study of an accidental risk is very useful in increasing the public acceptance of nuclear energy. In general, the average individual risk is used in this kind of study. However, population distribution appears to be the major contributor to the variability in the site specific risk evaluation. Also, the distance of the population from the site affects the mean value of the health risks[1, 2]. Therefore, the individual and population weighted health risks resulting from the postulated severe accidents of nuclear power plants of three sites, i.e., Yonggwang, Ulchin, and Wolsong were estimated and compared.
2. Methods and Results
The health effects considered in this comparative study are early and cancer fatality risks. The health effects and resulting risks are calculated by using the MACCS2 code[3]. The nuclear power plants considered in this study are the YGN3&4, UCN3&4, and WS1 plants.
The source term profiles which were derived from the Final Probabilistic Safety Assessment of the plants[4, 5, 6] were used to evaluate the health consequences. The release fractions for the STC’s(Source Term Category) for the plants were used to calculate the early and cancer fatality risks. The core inventory data for fission products were derived from the ORIGEN2 calculations using the end-of-cycle inventory for the YGN3&4 and UCN3&4 plants and the mean channel dwelling time inventory for the WS1 plant for the conservative evaluation.
The site was selected as the center of a polar grid and the grid was divided into 16 equally spaced sectors with the outermost radius extending to 80 km. Each sector was divided further into 10 elements to reasonably account for the site specific population distribution.
Weather data, i.e., hourly wind speed, wind direction, and atmospheric stability taken at the neighboring site tower are assumed to be representative for both sites and used in the risk estimation.
Evacuation and relocation are considered as emergency response actions which are designed to reduce the radiation exposures, public health effects, and economic impacts from an accident. Individuals are assumed to evacuate to a safety zone, i.e., beyond 16 km from the site at a speed of 1.8 m/sec.
Other parameters that enter the computational process, such as the protection factors for an inhalation or skin exposure, resuspension, cloud and other shielding factors, and the specific input required for deriving the chronic effects, are assumed to be the default values recommended in the MACCS2 User's Guide[1].
The average individual risk is obtained by taking the sum of the risk values in all the sectors at a given distance and dividing it by the number of sectors. The average individual early fatality and the cancer fatality risk for the YGN3&4, UCN3&4, and WS1 plants are summarized in Table 1. All these risks are below the safety goal of USNRC.
Table 1. Risk Comparison for Three Sites (/RY)
YGN UCN WS
Early Fatality 1.01×10⁻⁸ 4.20×10⁻⁸ 1.45×10⁻⁸
Cancer Fatality 2.43×10⁻⁸ 7.65×10⁻⁸ 1.24×10⁻⁹
Among the STC’s of the plants, the STC-19 for the YGN3&4 and YCN 3&4 plants and STC-8 for the WS1 plant are the dominant STC’s for the early and cancer fatality risks. . According to the results of the Level-2 PSA for the plants, the dominant initiating events of each STC for the plants are the SGTR events. Therefore, appropriate action must be taken to reduce the occurrence probability of a SGTR event and the amount of radioactive materials released to the atmosphere for the plants. The complementary cumulative distribution function (CCDF) curves for the early and cancer fatalities for the plants are plotted in Figures 1 and 2. The early and cancer fatality risks of the WS1 plant are lower than those of the PWR plant in spite of the fact that the total population of the PHWR plant site is much larger than that of the YGN3&4 and UCN 3&4 plants. This is attributed the fact that the amount of radioactive materials that are released to the atmosphere resulting from the postulated severe accidents of the WS1 plants are smaller than those of the YGN3&4 and UCN 3&4 plants[7].
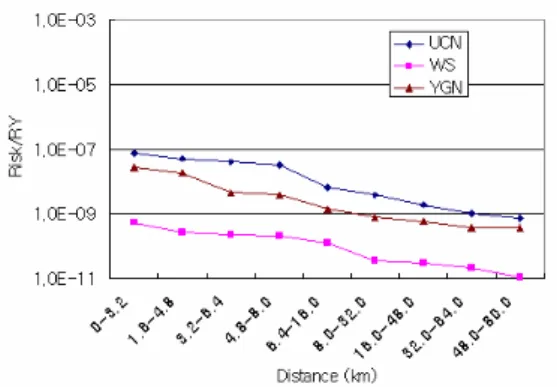
The population weighted health effect risk is obtained by calculating the cases of a health effect on a certain region and then dividing it by the total population in the region. It takes account of both the population distribution and the wind rose. The population weighted early and cancer fatalities as a function of the distance for the plants are plotted in Figures 3 and 4.
Transactions of the Korean Nuclear Society Autumn Meeting Busan, Korea, October 27-28, 2005
101 102 103 1E-10 1E-9 1E-8 1E-7 1E-6 1E-5 E xce edance P roba bilit y/ R Y Early Fatalities UCN3&4 WS1 YGN3&4
Figure 1. CCDF curves for early fatalities
1 10 100 1000 10000 1E-10 1E-9 1E-8 1E-7 1E-6 1E-5 E xc eedanc e P roba bilit y/ R y Cancer Fatalities UCN3&4 WS1 YGN3&4
Figure 2. CCDF curves for cancer fatalities
Figure 3. Population weighted early fatality risk
Figure 4. Population weighted cancer fatality risk
3. Conclusion
The average individual and population weighted early and cancer fatality risks resulting from the hypothetical severe accidents of YGN3&4, UCN3&4, and WS1 plants were estimated and compared. The overall early and cancer fatality risks for the plants are below the safety goal of the USNRC.
For the plants considered in this study, the average individual and population weighted health effect risk show similar trends. For all kinds of health effect risk, the values of health effect risks of the WS1 plants shows a minimum value because the amount of radioactive materials that are released to the atmosphere resulting from the postulated severe accidents of the WS1 plants are smaller than those of the YGN3&4 and UCN 3&4 plants.
The number of the total population and the population density has a significant impact on the health effect risk. Therefore, the population weighted risk can be an important factor in the plant siting stage.
The results of this study can be used as basic data for the development of a measure that can be used for the comparative study among the various electricity generation systems.
Acknowledgement
This project has been carried out under the Nuclear R&D Program by MOST.
REFERENCES
[1] D. R. Strip et al., “ Sandia Nuclear Power Plant Siting Study, ” SNL, 1981.
[2] M. Young, “Evaluation of Population Density and Distribution Criteria in Nuclear Power Plant Siting,” SAND93-0848, SNL, 1994.
[3] J. D. I. Chanin and M. L. Young, “Code Manual for MACCS2: Volume 1, User’s Guide,” 1997.
[4] C. K. Park et al., A study on Individual Plant Examination of Nuclear Power Plants (Containment Performance Analysis), 1994.
[5] “Ulchin Units 3&4 Final Probabilistic Safety Assessment Report," KEPCO, 1997.
[6] “Wolsong Unit 1 Final Probabilistic Safety Assessment Report," KHNP, 2003.
[7] Jongtae Jeong, et al., “An Assessment of Hypothetical Severe Accident Risks for KSNP and PHWR Plants in Korea,” KAERI/TR-2730/2004, 2004.