Volume 2013, Article ID 342648,8pages http://dx.doi.org/10.1155/2013/342648
Research Article
Time Course of the Development of Nonalcoholic Fatty Liver
Disease in the Otsuka Long-Evans Tokushima Fatty Rat
Yi-Sun Song,
1Cheng-Hu Fang,
2,3Byung-Im So,
1Jun-Young Park,
1Yonggu Lee,
2Jeong Hun Shin,
2Dae Won Jun,
2Hyuck Kim,
4and Kyung-Soo Kim
1,21Graduate School of Biomedical Science and Engineering, Hanyang University, Seoul 133-792, Republic of Korea
2Department of Internal Medicine, Hanyang University College of Medicine, 17 Haengdang-dong, Sungdong-ku,
Seoul 133-792, Republic of Korea
3Department of Internal Medicine, College of Medicine, Yanbian University, Yanji 133000, China
4Department of Thoracic and Cardiovascular Surgery, Hanyang University College of Medicine, Seoul 133-792, Republic of Korea
Correspondence should be addressed to Kyung-Soo Kim; [email protected] Received 7 January 2013; Revised 28 March 2013; Accepted 17 April 2013 Academic Editor: Fabio Marra
Copyright © 2013 Yi-Sun Song et al. This is an open access article distributed under the Creative Commons Attribution License, which permits unrestricted use, distribution, and reproduction in any medium, provided the original work is properly cited. Nonalcoholic fatty liver disease (NAFLD) is considered a hepatic manifestation of metabolic syndrome. In this study, we investigated histological and biochemical changes in NAFLD and the gene expression involving de novo lipogenesis in Otsuka Long-Evans Tokushima fatty (OLETF) rats. We used OLETF rats and Long-Evans Tokushima Otsuka (LETO) rats as animal models of NAFLD and as controls, respectively. Consistent observations were made at 4-week intervals up to 50 weeks of age, and all rats were fed ad libitum with standard food. Biochemical and histological changes were observed, and gene expression involved in de novo lipogenesis was measured using real-time polymerase chain reactions. As a results hepatic micro- and macrovesicular steatosis and hepatocyte ballooning were evident in the OLETF rats at 22–38 weeks of age but disappeared after 42 weeks; no fibrosis or collagen deposition was observed. Gene expression involved in de novo lipogenesis followed a pattern similar to that of the histological changes. In conclusion, in the absence of dietary manipulation, hepatic steatosis in OLETF rats is evident at 22–38 weeks and declines after 42 weeks. Therefore, OLETF rats at 22–38 weeks are recommended as animal models of hepatic steatosis.
1. Introduction
Nonalcoholic fatty liver disease (NAFLD) is presently well recognized as a hepatic manifestation of metabolic syndrome
[1]. NAFLD is strongly associated with obesity, type 2 diabetes
mellitus, and hyperlipidemia [2]. The spectrum of NAFLD
ranges from simple steatosis thorough nonalcoholic
steato-hepatitis (NASH) to cirrhosis [3]. Approximately 20%–30%
of NAFLD patients progress to NASH and to cirrhosis [4].
NAFLD is estimated to affect up to 30% of all adults in the
United States and up to 70% of obese individuals [5]. Day
and James have proposed a two-hit hypothesis to explain the progression of NAFLD. The first hit involves the deposition of triglycerides in hepatocytes (hepatic steatosis) and the second hit refers to the cellular events leading to hepatic
inflammation (NASH) [6].
Many NAFLD studies have used animal models such as the rat model of methionine and choline deficiency- (MCD-)
induced NASH [7], high fat diet-induced hepatic steatosis
[8], and fructose-induced NAFLD [9]. Mutant animals such
as db/db mice [10], ob/ob mice [11], and Otsuka Long-Evans
Tokushima fatty (OLETF) rats have also been used as models
of NAFLD [12].
The OLETF rat is a well-established model of metabolic syndrome, characterized by abdominal obesity, insulin
resistance, hypertension, and hyperlipidemia [13, 14]. The
cholecystokinin- (CCK-) 1 receptor is not made in OLETF
rats because of a genetic deletion [15,16], and this absence
of the CCK-1 receptor—one of the most abundant neuro-transmitter peptides in the brain—may lead to metabolic
syndrome because of a lack of satiety [17]. The OLETF rats
strain. A control strain, the LETO rat, which originated from the same colony, makes the CCK-A receptor and is diabetes
resistant [16]. One of the advantages of the OLETF rat is that
it develops NAFLD spontaneously in the absence of extreme
dietary manipulation [18]. In addition, its natural pattern of
progression closely resembles that observed in obese humans
[19].
In previous studies, OLETF rats at 32 weeks of age were used to investigate the effect of rosiglitazone on hepatic
steatosis [20]. Yeon et al. observed hepatic steatosis in
40-week-old OLETF rats, whereas 12- and 28-week olds did
not show histological changes [21]. Also, Seo et al. used the
OLETF rat at 12 weeks of age as a NAFLD model [22], and
Borengasser et al. similarly used 13-week-old OLETF rats
[23]. Guo et al. observed hepatic steatosis and vacuolization
in the OLETF rat at 16 weeks of age, and this gradually
worsened to 30 weeks of age [24]. For use as an animal model
of NASH, OLETF rats are fed an MCD diet for 8 weeks from
24 weeks of age [25]. The OLETF rat has been used as an
animal model for NAFLD in many experiments; however, the time course of histological and biochemical changes in OLETF rats has not been clearly defined. Determining the therapeutic effects of drugs is difficult because of a lack of information about the development of disease in this animal model.
The aim of this study was to establish the time course of the development of NAFLD in the OLETF rat model. We therefore investigated the histological and biochemical changes associated with NAFLD in OLETF rats up to 50 weeks of age, as well as expression of genes involved in de novo lipogenesis.
2. Materials and Methods
2.1. Animals. This study was performed in compliance with
the ARRIVE guidelines for research [26], and the Hanyang
University Institutional Animal Care and Use Committee approved all protocols. Four-week-old OLETF rats (𝑛 = 40) and control Long-Evans Tokushima Otsuka (LETO) rats (𝑛 = 5) were supplied by the Tokushima Research Institute, Otsuka Pharmaceutical Co. (Tokushima, Japan). All animals were provided with standard rodent chow ad libitum (20.14% protein, 13.12% moisture, 5.9% fat, and 5.02% fiber; Lab Rodent Chow; 38057; Purina Korea Inc., Republic of Korea). They were housed under conditions of controlled
temperature (23± 2∘C) and humidity (55± 5%) with a 12 h
artificial light/dark cycle in a specific pathogen-free facility of the Hanyang University Medical School Animal Experiment Center.
2.2. Experimental Protocols. The experiment was initiated
when the rats were 10 weeks of age. OLETF rats were killed for histological analysis at 4-week intervals up to 50 weeks of age, while LETO rats were killed only at 50 weeks of age. All rats were fasted for 12 h prior to being killed, and blood was collected from tail veins. Body weights were measured at 4-week intervals.
2.3. Biochemical Analysis. Serum was obtained from blood
by centrifugation and stored at −70∘C. Serum glucose,
total cholesterol (TC), triglyceride (TG), insulin, alanine aminotransferase (ALT), aspartate aminotransferase (AST), and free fatty acid (FFA) levels were measured using an
autoanalyzer (Olympus GmbH, Germany) [27, 28]. Serum
glucose, TC, and TG levels were measured at 4-week intervals up to 50 weeks of age, whereas serum insulin, ALT, AST, and FFA levels were measured only at 50 weeks of age. Insulin resistance was estimated by homeostasis model assessment of insulin resistance (HOMA-IR) using the following for-mula: HOMA-IR = fasting insulin (𝜇U/mL) × fasting plasma
glucose (mmol/l)/22.5 [29].
2.4. Histological Staining and Grading. Livers were fixed in
10% buffered formalin and embedded in paraffin. The severity of histological changes was assessed by hematoxylin and eosin (H&E) and Masson’s trichrome (MT) staining. Oil Red
O staining was performed as previously described [12]. Three
regions of digitized images of the Oil Red O-stained liver sections from each animal were selected at random from the individual sections and were quantified using the Leica
image analysis system [30, 31]. The stained sections were
photographed using a light microscope (Leica DM 4000B, Germany).
2.5. RNA Isolation. RNA was isolated from 40 mg samples
of liver tissue using Qiazol reagent (QIAgen, USA). RNA concentration was measured with a NanoDrop ND-2000 UV/Vis spectrophotometer (Thermo Fisher Scientific Inc., USA), and RNA purity was determined by measuring the ratio of absorbance at 260 and 280 nm, which ranged from 1.8 to 2.0.
2.6. Quantitative Real-Time Polymerase Chain Reaction (PCR). Total RNA was extracted from 20 mg samples of liver
tissue using Qiazol reagent (QIAgen, Valencia, CA) follow-ing the manufacturer’s instructions. Complementary DNA
(cDNA) was synthesized from 3𝜇g of RNA using Moloney
Murine Leukemia virus reverse transcriptase primed with oligo(dT) (Invitrogen, Carlsbad, USA). mRNA expression was quantified by real-time PCR (Roche, Basel, Switzerland) using a LightCycler FastStart DNA Master SYBR Green I kit (Roche Diagnostics, IN, USA). The following real-time PCR amplification protocol was used: incubation for 10 min
at 95∘C followed by 45 cycles of 10 s at 95∘C, 10 s at 60∘C,
and 8 s at 72∘C and a final dissociation curve step at 65∘C for
15 s. The crossing point (Cp) of each PCR was automatically determined by the LightCycler program. PCR reactions for each sample were run in duplicate. The specific primers for the target genes (sterol regulatory element-binding protein-(SREBP-) 1c, stearoyl-CoA- (SCD-) 1, carbohydrate response element-binding protein (chREBP), fatty acid synthase (FAS), and acetyl-CoA carboxylase (ACC)) and
glyceraldehyde-3-phosphate dehydrogenase (GAPDH) are listed in Table1. The
expression levels of target genes were normalized to those of GAPDH.
10 14 18 22 26 30 34 38 42 46 50 200 300 400 500 600 700 Time (weeks) ∗∗ ∗∗ ∗∗ ∗∗ ∗∗ ∗∗ ∗∗ ∗ ∗ B o d y w eig h t (g) (a) 10 14 18 22 26 30 34 38 42 46 50 50 100 150 200 250 300 350 Gl ucos e (m g/dL) Time (weeks) ∗∗ ∗∗∗∗ ∗∗ ∗∗ ∗∗ ∗∗ ∗∗∗∗ ∗∗ ∗∗ (b) 10 14 18 22 26 30 34 38 42 46 50 0 100 200 300 400 500 Time (weeks) ∗∗ ∗∗ ∗∗ ∗∗ ∗∗ ∗∗ ∗∗ ∗∗ ∗∗ ∗∗ ∗ T rig ly cer ide (m g/dL) (c) 10 14 18 22 26 30 34 38 42 46 50 50 100 150 200 250 300 350 400 Time (weeks) ∗∗∗∗ ∗∗ ∗∗ ∗∗ ∗∗ ∗∗ T o ta l c h o lest er o l (m g/dL) (d)
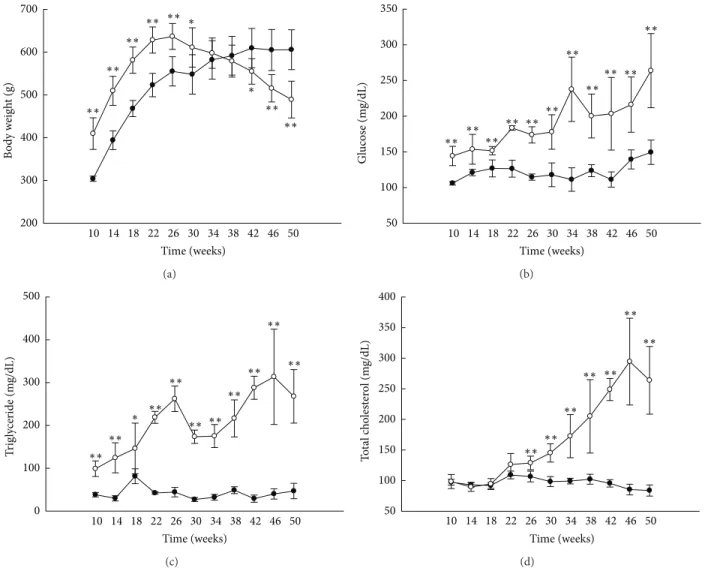
Figure 1: Animal characteristics and biochemical analyses. Body weights ((a),𝑛 = 6) and serum glucose ((b), 𝑛 = 5), triglyceride ((c), 𝑛 = 5), and total cholesterol ((d),𝑛 = 5) levels. White circles: OLETF rats; black circles: LETO rats. All data are expressed as means ± SD.∗𝑃 < 0.05,
∗∗𝑃 < 0.01 compared with LETO rats.
2.7. Statistical Analysis. All data are presented as means± SD,
except for the Oil Red O staining data obtained with the
image analysis system, which are presented as mean± SE.
Comparisons between groups were made using one-way analysis of variance followed by a post hoc Tukey’s test using Statistical Program for the Social Sciences (SPSS software version 17.0 (SPSS, Inc., USA)). Side-to-side comparisons within the same group were made using Student’s t-test for
paired data. Values of𝑃 < 0.05 were considered statistically
significant.
3. Results
3.1. Animal Characteristics and Biochemical Analysis. Body
weight was significantly higher in the OLETF rats than in the LETO rats until 30 weeks of age and fell below that of
the LETO rats by 42 weeks (Figure1(a)). Serum glucose and
TG levels were higher in the OLETF rats than in the LETO
rats at all ages (Figures1(b)and 1(c)), and TC levels were
higher in the OLETF rats than in the LETO rats after 26 weeks
(Figure1(d)). At 50 weeks, levels of AST and free fatty acid
were higher in the OLETF rats than in the LETO rats, but no significant differences were observed in insulin and ALT
levels (Table2). In the OLETF rats, levels of HOMA were
lower at 50 weeks of age than at 30 weeks of age (Table3).
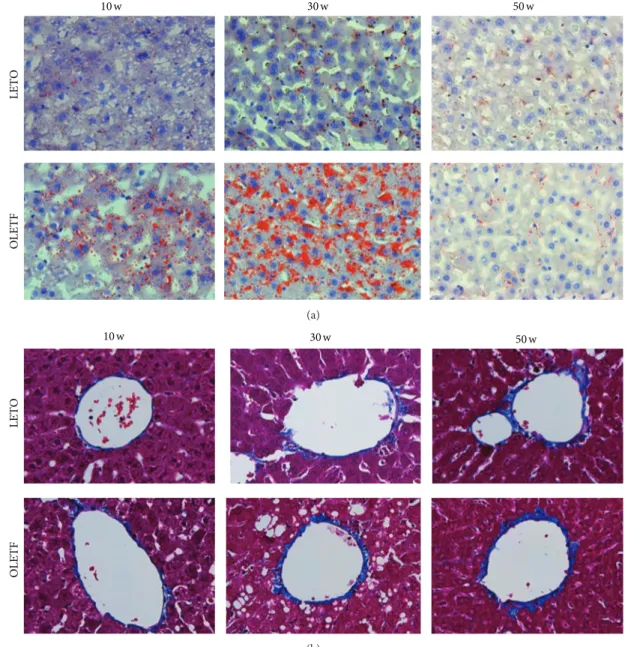
3.2. Liver Histology. The progression of NAFLD was
con-firmed in the liver tissue of OLETF rats by H&E (4-week intervals), Oil Red O, and MT staining (at 20-week inter-vals). Microvesicular steatosis was observed in OLETF rats at 18 weeks, and micro- and macrovesicular steatosis and hepatocyte ballooning became evident from 22–38 weeks of
age and declined after 42 weeks (Figure2). The area of lipid
droplets, as visualized by Oil Red O staining, was larger in the OLETF rats than in the LETO rats at 10 and 30 weeks of age, but there was no significant difference at 50 weeks
(Figure 3(a) and Table 4). In the OLETF rats, no fibrosis
OLETF-10 w OLETF-26 w OLETF-14 w OLETF-30 w OLETF-46 w OLETF-18 w OLETF-34 w OLETF-50 w OLETF-22 w OLETF-38 w LETO-50 w OLETF-42 w
Figure 2: Liver histology by hematoxylin and eosin (H&E) staining. Histological changes in liver tissue observed by H&E staining in OLETF rats at 4-week intervals up to 50 weeks of age (magnification,×200).
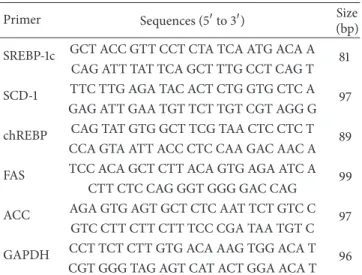
Table 1: Sequences of primers.
Primer Sequences (5to 3) Size (bp) SREBP-1c GCT ACC GTT CCT CTA TCA ATG ACA A 81
CAG ATT TAT TCA GCT TTG CCT CAG T SCD-1 TTC TTG AGA TAC ACT CTG GTG CTC A 97
GAG ATT GAA TGT TCT TGT CGT AGG G chREBP CAG TAT GTG GCT TCG TAA CTC CTC T 89
CCA GTA ATT ACC CTC CAA GAC AAC A FAS TCC ACA GCT CTT ACA GTG AGA ATC A 99
CTT CTC CAG GGT GGG GAC CAG
ACC AGA GTG AGT GCT CTC AAT TCT GTC C 97 GTC CTT CTT CTT TCC CGA TAA TGT C GAPDH CCT TCT CTT GTG ACA AAG TGG ACA T 96
CGT GGG TAG AGT CAT ACT GGA ACA T
SREBP: sterol regulatory element-binding protein; SCD: stearoyl-CoA; chREBP: carbohydrate response element-binding protein; FAS: fatty acid synthase; ACC: acetyl-CoA carboxylase; GAPDH: glyceraldehyde-3-phosphate dehydrogenase.
(i.e., encompassing terminal hepatic veins) by MT staining
(Figure3(b)).
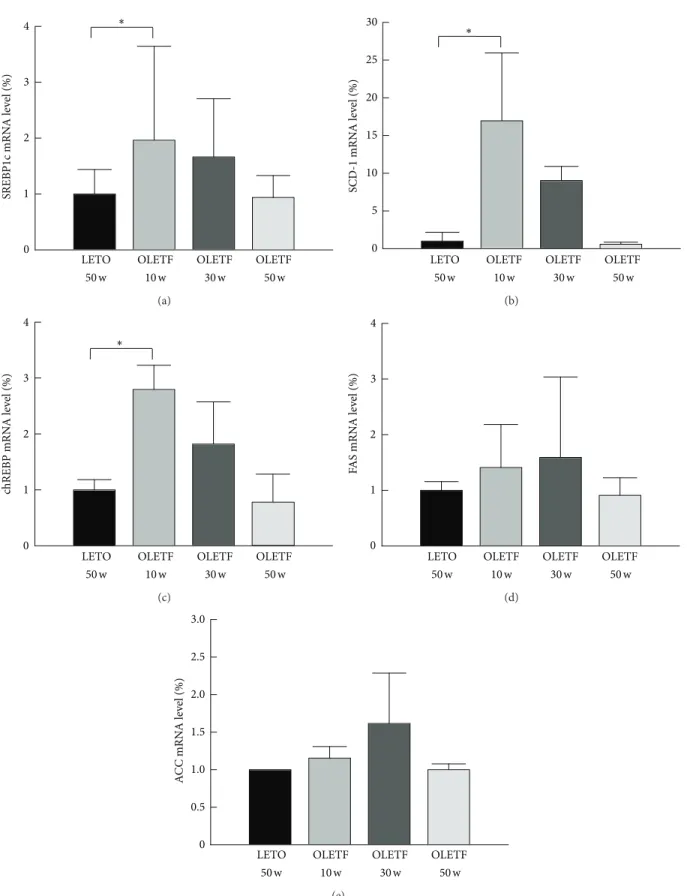
3.3. Expression of Genes Related to Lipogenesis. Levels of
SREBP-1c, SCD-1, chREBP, FAS, and ACC mRNA in the liver of rats were measured by real-time PCR (OLETF, at
20-week intervals; LETO, at 50 20-weeks of age) (Figure4). Levels
of SREBP-1c, SCD-1, and chREBP mRNA were higher at 10 weeks of age in the OLETF rats than in the LETO rats (Figures
Table 2: Biochemical analyses of serum obtained from the LETO and OLETF rats at 50 weeks of age.
LETO OLETF Insulin (uIU/mL) 6.16± 1.61 6.32± 0.39 Alanine aminotransferase (U/L) 44.20± 4.66 43.60± 9.02 Aspartate aminotransferase (U/L) 74.20± 14.34 122.20 ± 8.23∗∗ Free fatty acid (𝜇Eq/L) 712.00± 25.11 840.80 ± 83.05∗
OLETF: Otsuka Long-Evans Tokushima fatty rats; LETO: Long-Evans Tokushima rats. All data are expressed as means± SE.∗𝑃 < 0.05,∗∗𝑃 < 0.01 compared with LETO rats (𝑛 = 5).
Table 3: HOMA-IR level of the LETO and OLETF rats at 30 and 50 weeks of age.
30 weeks of age 50 weeks of ages LETO 14.74± 6.73 10.70± 2.46 OLETF 27.87± 5.60 15.20± 1.12∗
HOMA-IR: homeostasis model assessment of insulin resistance; HOMA-IR = fasting insulin (𝜇U/mL) × fasting plasma glucose (mmoL/L)/22.5. OLETF: Otsuka Long-Evans Tokushima fatty rats; LETO: Long-Evans Tokushima rats. All data are expressed as means± SE.∗𝑃 < 0.05 compared with at 30 weeks of age (𝑛 = 3–5).
4(a)–4(c)), but levels of FAS and ACC mRNA did not differ
significantly at any time point (Figures4(d)and4(e)).
4. Discussion
In this study, we examined the development with age of NAFLD in OLETF rats. We demonstrated that hepatic steatosis was evident in OLETF rats in the absence of
10 w 30 w 50 w LET O OL ET F (a) 10 w 30 w 50 w LET O OL ET F (b)
Figure 3: Liver histology. Representative images of Oil Red O (a) and Masson’s trichrome (MT) staining (b) of the livers at 10, 30, and 50 weeks of age (magnification,×400).
Table 4: Histological parameter.
Hepatic Oil Red O (% staining)
Age (week) LETO OLETF
10 0.17± 0.07 0.99± 0.36∗ 30 0.44± 0.09 17.61± 0.81∗∗ 50 0.24± 0.13 0.36± 0.13
OLETF: Otsuka Long-Evans Tokushima fatty rats; LETO: Long-Evans Tokushima rats. All data are expressed as means± SE.∗𝑃 < 0.05,∗∗𝑃 < 0.01 compared with LETO rats (𝑛 = 3).
dietary manipulation between 22 and 38 weeks of age and declined after 42 weeks. Fibrosis and collagen deposition in perivenular regions did not appear within 50 weeks. Further, the expression of genes related to de novo lipogenesis
increased at 10 and 30 weeks in OLETF rats and declined by 50 weeks.
OLETF rats spontaneously develop insulin resistance,
type 2 diabetes [32], metabolic syndrome [17], and hepatic
steatosis [21]. The OLETF rat is an established model of
NAFLD because it follows a pattern of development similar to that of the human disease and it occurs in the absence of
extreme dietary manipulation [19,33].
We found that OLETF rats had higher serum levels of glucose, triglyceride, and total cholesterol than LETO
rats (Figures 1(b) and 1(c)). However, their body weight
started declining at 30 weeks of age and, by 42 weeks, was
significantly lower than that of the LETO rats (Figure1(a)). In
previous studies, the body weight of OLETF rats also peaked
between 25 and 30 weeks [5, 34,35]. Hence, the decline in
LETO OLETF OLETF OLETF 0 1 2 3 4 SREBP1c mRN A le ve l (%) ∗ 50 w 10 w 30 w 50 w (a)
LETO OLETF OLETF OLETF
50 w 10 w 30 w 50 w 10 0 5 15 20 25 30 SCD-1 mRN A le ve l (%) ∗ (b)
LETO OLETF OLETF OLETF
50 w 10 w 30 w 50 w ch REBP mRN A le ve l (%) 0 1 2 3 4 ∗ (c)
LETO OLETF OLETF OLETF
50 w 10 w 30 w 50 w FA S mRN A le ve l (%) 0 1 2 3 4 (d)
LETO OLETF OLETF OLETF
50 w 10 w 30 w 50 w A C C mRN A le ve l (%) 0 0.5 1.0 1.5 2.0 2.5 3.0 (e)
Figure 4: Expression of genes related to lipogenesis. Levels of SREBP-1c, SCD-1, chREBP, FAS, and ACC mRNA in the liver at 10, 30, and 50 weeks of age. ((a)–(e)) Sterol regulatory element-binding protein (SREBP) 1c, stearoyl-CoA- (SCD-) 1, carbohydrate response element-binding protein (chREBP), fatty acid synthase (FAS), and acetyl-CoA carboxylase (ACC) mRNA levels, respectively. Mean values were obtained from livers of 3 separate animals. Polymerase chain reactions performed in duplicate. The transcript levels normalized relative to GAPDH expression. Data are expressed as means± SD.∗𝑃 < 0.05 compared with LETO rats.
rats. The HOMA scores of the OLETF rats were also lower at
50 weeks than at 30 weeks (Table3).
As expected, hepatic micro- and macrovesicular steatosis and hepatocyte ballooning were not observed in the OLETF rats before 14 weeks of age; they appeared at 18 weeks and were very evident between 22 and 38 weeks. Surprisingly,
however, they disappeared by 42 weeks (Figure2). The area
of lipid droplets also peaked at approximately 30 weeks of
age (Figure3(a)). In this study, hepatic steatosis in OLETF
rats peaked at approximately 30 weeks and disappeared by 42 weeks in conjunction with the reduction insulin resistance and SREBP-1c expression. Also, previous studies have demonstrated that insulin resistance is closely related to SREBP-1c levels, and the reduction of SREBP-1c levels could
contribute to the improvement of insulin resistance [36]. We
speculate that reduction of hepatic steatosis in OLETF rats is related to the decline in insulin resistance and SREBP-1c expression. However, further study is required to confirm these mechanisms.
Fibrosis and collagen deposition in the perivenular regions of the livers of OLETF rats did not increase over time
(Figure3(b)). This indicates that OLETF rats are not useful as
models of NASH in the absence of dietary manipulation. We showed that the expression of genes related to de novo lipogenesis in OLETF rats increased at 10 and 30 weeks of age and then declined by 50 weeks. Previous studies have shown
that hepatic lipogenesis increases in NAFLD [37]. Further,
inhibition of SREBP-1c, a master regulator of genes involving hepatic lipogenesis, reduces the expression of ACC, FAS, and
SCD-1 [38]. These findings may account for why
50-week-old OLETF rats are not appropriate models of NAFLD. To clarify the situation, however, studies of other pathways such as fatty acid oxidation in mitochondria and peroxisomes and fatty acid transport in OLETF rat during the development of NAFLD are needed.
This study has several limitations. First, the mechanism responsible for the reduction of hepatic steatosis after 42 weeks of age in the OLETF rats is unclear. Second, our study involved only a small number of animals. Finally, time course data of food intake in the OLETF rats is limited. However, we suppose that the body weight loss in the OLETF rats is not due to reduction of food intake, because previous studies have shown that the food intake of OLETF rat does not decline
until at least 38 weeks of age [39].
In summary, we have demonstrated that hepatic steatosis in OLETF rats in the absence of dietary manipulation increases from 22–38 weeks of age and declines after 42 weeks. We recommend the use of OLETF rats at 22–38 weeks of age as animal models of hepatic steatosis, but these rats are not useful as models of NASH in the absence of dietary manipulation. Our findings provide insight into the use of OLETF rats as models of NAFLD and define the optimal time for observing hepatic steatosis. We believe these data will contribute to the study of NAFLD using OLETF rats.
Abbreviations
NAFLD: Nonalcoholic fatty liver disease OLETF: Otsuka Long-Evans Tokushima fatty
LETO: Long-Evans Tokushima Otsuka
NASH: Nonalcoholic steatohepatitis
MCD: Methionine and choline deficiency
CCl4: Carbon tetrachloride
CCK: Cholecystokinin
SREBP: Sterol regulatory element-binding protein
SCD: Stearoyl-CoA
chREBP: Carbohydrate response element-binding protein
FAS: Fatty acid synthase
ACC: Acetyl-CoA carboxylase
TC: Total cholesterol
TG: Triglyceride
ALT: Alanine aminotransferase
AST: Aspartate aminotransferase
FFA: Free fatty acids
H&E: Hematoxylin and eosin
MT: Masson’s trichrome.
Conflict of Interests
The authors declare that they have no conflict of interests.
References
[1] G. Marchesini, M. Brizi, G. Blanchi et al., “Nonalcoholic fatty liver disease: a feature of the metabolic syndrome,” Diabetes, vol. 50, no. 8, pp. 1844–1850, 2001.
[2] P. Angulo, “Nonalcoholic fatty liver disease,” The New England
Journal of Medicine, vol. 346, no. 16, pp. 1221–1231, 2002.
[3] J. D. Browning, L. S. Szczepaniak, R. Dobbins et al., “Prevalence of hepatic steatosis in an urban population in the United States: impact of ethnicity,” Hepatology, vol. 40, no. 6, pp. 1387–1395, 2004.
[4] E. Albano, E. Mottaran, G. Occhino, E. Reale, and M. Vidali, “Review article: role of oxidative stress in the progression of non-alcoholic steatosis,” Alimentary Pharmacology and
Thera-peutics, vol. 22, supplement 2, pp. 71–73, 2005.
[5] R. S. Rector, J. P. Thyfault, R. T. Morris et al., “Daily exercise increases hepatic fatty acid oxidation and prevents steatosis in Otsuka Long-Evans Tokushima Fatty rats,” The American
Journal of Physiology, vol. 294, no. 3, pp. G619–G626, 2008.
[6] C. P. Day and O. F. W. James, “Steatohepatitis: a tale of two ‘hits’?” Gastroenterology, vol. 114, no. 4 I, pp. 842–845, 1998. [7] M. K. Chae, S. G. Park, S. O. Song et al., “Pentoxifylline
atten-uates methionine- and choline-deficient-diet-induced steato-hepatitis by suppressing TNF-𝛼 expression and endoplasmic reticulum stress,” Experimental Diabetes Research, vol. 2012, Article ID 762565, 8 pages, 2012.
[8] M. S. Gauthier, R. Favier, and J. M. Lavoie, “Time course of the development of non-alcoholic hepatic steatosis in response to high-fat diet-induced obesity in rats,” The British Journal of
Nutrition, vol. 95, no. 2, pp. 273–281, 2006.
[9] Z. Ackerman, M. Oron-Herman, M. Grozovski et al., “Fructose-induced fatty liver disease: hepatic effects of blood pressure and plasma triglyceride reduction,” Hypertension, vol. 45, no. 5, pp. 1012–1018, 2005.
[10] S. S. Choi and A. M. Diehl, “Hepatic triglyceride synthesis and nonalcoholic fatty liver disease,” Current Opinion in Lipidology, vol. 19, no. 3, pp. 295–300, 2008.
[11] I. Garc´ıa-Ruiz, C. Rodr´ıguez-Juan, T. D´ıaz-Sanjuan et al., “Uric acid and anti-TNF antibody improve mitochondrial dysfunc-tion in ob/ob mice,” Hepatology, vol. 44, no. 3, pp. 581–591, 2006. [12] T. S. Jung, S. K. Kim, H. J. Shin, B. T. Jeon, J. R. Hahm, and G. S. Roh, “𝛼-lipoic acid prevents non-alcoholic fatty liver disease in OLETF rats,” Liver International, vol. 32, no. 10, pp. 1565–1573, 2012.
[13] K. Kawano, T. Hirashima, S. Mori, Y. Saitoh, M. Kurosumi, and T. Natori, “Spontaneous long-term hyperglycemic rat with diabetic complications: Otsuka Long-Evans Tokushima Fatty (OLETF) strain,” Diabetes, vol. 41, no. 11, pp. 1422–1428, 1992. [14] K. Shima, M. Zhu, and A. Mizuno, “Pathoetiology and
preven-tion of NIDDM lessons from the OLETF rat,” Journal of Medical
Investigation, vol. 46, no. 3-4, pp. 121–129, 1999.
[15] E. Shoji, T. Okumura, S. Onodera, N. Takahashi, K. Harada, and Y. Kohgo, “Gastric emptying in OLETF rats not expressing CCK-A receptor gene,” Digestive Diseases and Sciences, vol. 42, no. 5, pp. 915–919, 1997.
[16] S. Nomoto, M. Miyake, M. Ohta, A. Funakoshi, and K. Miyas-aka, “Impaired learning and memory in OLETF rats without cholecystokinin (CCK)-A receptor,” Physiology and Behavior, vol. 66, no. 5, pp. 869–872, 1999.
[17] S. Takiguchi, Y. Takata, A. Funakoshi et al., “Disrupted chole-cystokinin type-A receptor (CCKAR) gene in OLETF rats,”
Gene, vol. 197, no. 1-2, pp. 169–175, 1997.
[18] S. Kurita, T. Takamura, T. Ota et al., “Olmesartan ameliorates a dietary rat model of non-alcoholic steatohepatitis through its pleiotropic effects,” European Journal of Pharmacology, vol. 588, no. 2-3, pp. 316–324, 2008.
[19] R. S. Rector, J. P. Thyfault, G. M. Uptergrove et al., “Mitochon-drial dysfunction precedes insulin resistance and hepatic steato-sis and contributes to the natural history of non-alcoholic fatty liver disease in an obese rodent model,” Journal of Hepatology, vol. 52, no. 5, pp. 727–736, 2010.
[20] S. J. Yang, J. M. Choi, S. W. Chae et al., “Activation of peroxisome proliferator-activated receptor𝛾 by rosiglitazone increases Sirt6 expression and ameliorates hepatic steatosis in rats,” PLoS ONE, vol. 6, no. 2, Article ID e17057, 2011.
[21] J. E. Yeon, K. M. Choi, S. H. Baik et al., “Reduced expression of peroxisome proliferator-activated receptor-𝛼 may have an important role in the development of non-alcoholic fatty liver disease,” Journal of Gastroenterology and Hepatology, vol. 19, no. 7, pp. 799–804, 2004.
[22] Y. S. Seo, J. H. Kim, N. Y. Jo et al., “PPAR agonists treatment is effective in a nonalcoholic fatty liver disease animal model by modulating fatty-acid metabolic enzymes,” Journal of
Gastroen-terology and Hepatology, vol. 23, no. 1, pp. 102–109, 2008.
[23] S. J. Borengasser, R. S. Rector, G. M. Uptergrove et al., “Exercise and omega-3 polyunsaturated fatty acid supplementation for the treatment of hepatic steatosis in hyperphagic OLETF rats,”
Journal of Nutrition and Metabolism, vol. 2012, Article ID
268680, 12 pages, 2012.
[24] Z. Guo, S. Bu, Y. Yu et al., “Diazoxide prevents abdominal adiposity and fatty liver in obese OLETF rats at prediabetic stage,” Journal of Diabetes and its Complications, vol. 22, no. 1, pp. 46–55, 2008.
[25] M. Uno, S. Kurita, H. Misu et al., “Tranilast, an antifibrogenic agent, ameliorates a dietary rat model of nonalcoholic steato-hepatitis,” Hepatology, vol. 48, no. 1, pp. 109–118, 2008. [26] C. Kilkenny, W. J. Browne, I. C. Cuthill, M. Emerson, and D. G.
Altman, “Improving bioscience research reporting: the arrive
guidelines for reporting animal research,” PLoS Biology, vol. 8, no. 6, Article ID e1000412, 2010.
[27] D. Blom, T. T. Yamin, M. F. Champy et al., “Altered lipoprotein metabolism in P2Y13 knockout mice,” Biochimica et Biophysica
Acta, vol. 1801, no. 12, pp. 1349–1360, 2010.
[28] Y. M. Fan, O. T. Raitakari, M. K¨ah¨onen et al., “Hepatic lipase promoter C-480T polymorphism is associated with serum lipids levels, but not subclinical atherosclerosis: the cardiovas-cular risk in young finns study,” Clinical Genetics, vol. 76, no. 1, pp. 46–53, 2009.
[29] D. R. Matthews, J. P. Hosker, A. S. Rudenski, B. A. Naylor, D. F. Treacher, and R. C. Turner, “Homeostasis model assessment: insulin resistance and 𝛽-cell function from fasting plasma glucose and insulin concentrations in man,” Diabetologia, vol. 28, no. 7, pp. 412–419, 1985.
[30] R. Out, M. Hoekstra, K. Habets et al., “Combined deletion of macrophage ABCA1 and ABCG1 leads to massive lipid accumulation in tissue macrophages and distinct atherosclero-sis at relatively low plasma cholesterol levels,” Arterioscleroatherosclero-sis,
Thrombosis, and Vascular Biology, vol. 28, no. 2, pp. 258–264,
2008.
[31] S. R. Rector, J. P. Thyfault, M. J. Laye et al., “Cessation of daily exercise dramatically alters precursors of hepatic steatosis in Otsuka Long-Evans Tokushima Fatty (OLETF) rats,” Journal of
Physiology, vol. 586, part 17, pp. 4241–4249, 2008.
[32] T. H. Moran and S. Bi, “Hyperphagia and obesity in OLETF rats lacking CCK-1 receptors,” Philosophical Transactions of the
Royal Society B, vol. 361, no. 1471, pp. 1211–1218, 2006.
[33] N. Kanemoto, H. Hishigaki, A. Miyakita et al., “Genetic dis-section of “OLETF”, a rat model for non-insulin-dependent diabetes mellitus,” Mammalian Genome, vol. 9, no. 6, pp. 419– 425, 1998.
[34] Y. K. Oh, K. W. Joo, J. W. Lee et al., “Altered renal sodium transporter expression in an animal model of type 2 diabetes mellitus,” Journal of Korean Medical Science, vol. 22, no. 6, pp. 1034–1041, 2007.
[35] K. Sakano, M. Takahashi, M. Mutoh et al., “Enhanced thyroid carcinogenicity of N-nitrosobis(2-oxopropyl)amine in Otsuka Long-Evans Tokushima Fatty rats, a model of type II diabetes mellitus,” Carcinogenesis, vol. 28, no. 10, pp. 2193–2198, 2007. [36] T. Matsuzaka, H. Shimano, N. Yahagi et al., “Crucial role of
a long-chain fatty acid elongase, Elovl6, in obesity-induced insulin resistance,” Nature Medicine, vol. 13, no. 10, pp. 1193– 1202, 2007.
[37] G. Musso, R. Gambino, and M. Cassader, “Recent insights into hepatic lipid metabolism in non-alcoholic fatty liver disease (NAFLD),” Progress in Lipid Research, vol. 48, no. 1, pp. 1–26, 2009.
[38] Y. W. Kim, Y. M. Kim, Y. M. Yang et al., “Inhibition of SREBP-1c-mediated hepatic steatosis and oxidative stress by sauchinone, an AMPK-activating lignan in Saururus chinensis,” Free Radical
Biology and Medicine, vol. 48, no. 4, pp. 567–578, 2010.
[39] Y. Han, Y. Joe, E. Seo et al., “The hyperleptinemia and ObRb expression in hyperphagic obese rats,” Biochemical and
Submit your manuscripts at
http://www.hindawi.com
Stem Cells
International
Hindawi Publishing Corporationhttp://www.hindawi.com Volume 2014
Hindawi Publishing Corporation
http://www.hindawi.com Volume 2014
INFLAMMATION
Hindawi Publishing Corporation
http://www.hindawi.com Volume 2014
Behavioural
Neurology
Endocrinology
International Journal of Hindawi Publishing Corporationhttp://www.hindawi.com Volume 2014
Hindawi Publishing Corporation
http://www.hindawi.com Volume 2014
Disease Markers
Hindawi Publishing Corporation
http://www.hindawi.com Volume 2014
BioMed
Research International
Oncology
Journal of Hindawi Publishing Corporationhttp://www.hindawi.com Volume 2014
Hindawi Publishing Corporation
http://www.hindawi.com Volume 2014
Oxidative Medicine and Cellular Longevity
Hindawi Publishing Corporation
http://www.hindawi.com Volume 2014
PPAR Research
The Scientific
World Journal
Hindawi Publishing Corporation
http://www.hindawi.com Volume 2014
Immunology Research
Hindawi Publishing Corporation
http://www.hindawi.com Volume 2014
Journal of
Obesity
Journal ofHindawi Publishing Corporation
http://www.hindawi.com Volume 2014
Hindawi Publishing Corporation
http://www.hindawi.com Volume 2014
Computational and Mathematical Methods in Medicine
Ophthalmology
Journal ofHindawi Publishing Corporation
http://www.hindawi.com Volume 2014
Diabetes Research
Journal ofHindawi Publishing Corporation
http://www.hindawi.com Volume 2014
Hindawi Publishing Corporation
http://www.hindawi.com Volume 2014 Research and Treatment
AIDS
Hindawi Publishing Corporation
http://www.hindawi.com Volume 2014
Gastroenterology Research and Practice
Hindawi Publishing Corporation
http://www.hindawi.com Volume 2014