Contents lists available atScienceDirect
Molecular Phylogenetics and Evolution
journal homepage:www.elsevier.com/locate/ympevUnraveling the intricate biodiversity of the benthic harpacticoid genus
Nannopus (Copepoda, Harpacticoida, Nannopodidae) in Korean waters
Vinod Vakati
a, Seong-il Eyun
b,⁎, Wonchoel Lee
a,⁎aDepartment of Life Science, College of Natural Sciences, Hanyang University, Seoul 04763, South Korea
bDepartment of Life Science, College of Natural Sciences, Chung-Ang University, Seoul 06974, South Korea
A R T I C L E I N F O Keywords: Cryptic species Integrative taxonomy Species complex Sympatry A B S T R A C T
Nannopus (Harpacticoida, Nannopodidae) species are abundant and widely distributed throughout the world across a variety of habitats. Nannopus is well known for high frequencies of misidentifications and thus may comprise several cryptic complexes and morphologically distinct species. Cryptic taxa are common in meiofauna communities. In this study, we aimed to identify Nannopus species using an integrative approach including molecular taxonomy. We adopted a non-destructive DNA extraction method so that morphological and mole-cular data could be obtained from the same specimen. We analyzed the molemole-cular diversity and distributions of Nannopus using a total of 190 individuals. We sequenced the 190 mtCOI, 53 mtCYTB, 25 18SrDNA, and 43 28SrDNA genes from 190 individuals. Several species delimitation approaches were applied, including un-corrected p-distances for mtCOI, mtCYTB, 18SrDNA, and 28SrDNA, and Automatic Barcode Gap Discovery and Bayesian implemented Poisson tree processes for mtCOI and mtCYTB data. The maximum likelihood and Bayesian approaches were used to examine the phylogenetic relationships among individuals using the com-bined set of all four genes. Our species delimitation and phylogenetic analyses indicated the presence of three cryptic and six morphologically distinct species. All species are sympatric and widely distributed across mudflats ranging from the Yellow Sea to the South Sea in Korea. The divergence patterns of the four genes were not congruent. A phylogenetic tree based on the concatenated dataset was the most robust, was congruent with morphology, and suggested two major clades. We considered the validity of reinstating the genus Ilyophilus (Lilljeborg, 1902) and ultimately concluded that including all congeners in Nannopus until the type species (N. palustris Brady, 1880) is re-described was the most prudent approach.
1. Introduction
Biological species are the fundamental unit of biodiversity (Mayr, 1963; Mishler and Brandon, 1987). Appropriate species delineation is an important aspect of studying the life history, population genetics, and ecology of marine organisms (Butlin et al., 2009; Wiens, 2007). However, the accuracy of species-level assessment is dependent on prior taxonomic knowledge. Marine benthic meiofaunal species are especially difficult to delineate due to their small body size and fragile integuments, which make it difficult to obtain large quantities of genomic DNA from single wild specimens (Sands et al., 2008). In ad-dition, PCR amplification of the genes that can be used in systematics and phylogenetics are not effective in meiofauna due to low con-centrations of DNA (Sands et al., 2008). Further, identifications of benthic harpacticoids are typically based on only a few diagnostic morphological characters. These characters are often present only in
adult specimens, making it nearly impossible to identify juvenile forms such as nauplii and copepodites (Calbet et al., 2001; Hirst and Bunker, 2003; Palmer and Brandt, 1981). Furthermore, morphological varia-tions among cryptic species are minor and unnoticeable (Beheregaray and Caccone, 2007). Therefore, the number of species is likely under-estimated. Cryptic species and population subdivision have been ob-served in several groups of benthic harpacticoids such as
Micro-arthridion littorale (Schizas et al., 2002), Cletocamptus deitersi (
Rocha-Olivares et al., 2001), Tigriopus californicus (Peterson et al., 2013and references therein), Tigriopus japonicus (Karanovic et al., 2018), and
Nannopus palustris (Garlitska et al., 2012).
Advances in molecular systematics with other approaches such as phylogeographic, population genetic, and coalescent analyses allows taxonomists and ecologists to assess species composition more precisely (Bickford et al., 2007; Blanco-Bercial et al., 2011; Braga et al., 1999; Bucklin and Frost, 2009; Eyun, 2017; Figueroa, 2011; Goetze, 2003;
https://doi.org/10.1016/j.ympev.2018.10.004
Received 20 June 2018; Received in revised form 17 September 2018; Accepted 3 October 2018 ⁎Corresponding authors.
E-mail addresses:[email protected](S.-i. Eyun),[email protected](W. Lee).
Available online 09 October 2018
1055-7903/ © 2018 The Authors. Published by Elsevier Inc. This is an open access article under the CC BY license (http://creativecommons.org/licenses/BY/4.0/).
Marrone et al., 2013; Marszalek et al., 2008; Taniguchi et al., 2004; Thum, 2004; Wyngaard et al., 2010). Such molecular approaches using DNA sequences of selected loci or complete genomes, single-nucleotide polymorphisms, microsatellites, and amplified fragment length poly-morphisms result in changes in our understanding of taxonomy and ecological adaptation (Tautz et al., 2003; Eyun, 2017; Eyun et al., 2017). Many investigations in invertebrates rely solely on the “barcode” portion of the mitochondrial cytochrome oxidase C subunit I gene or the nuclear internal transcribed spacer 2 to delineate species (Baek et al., 2016; Di Capua et al., 2017; Hebert et al., 2003b; Sabia et al., 2017). Although single gene barcoding approaches are often effective (Bucklin et al., 2010a; Bucklin et al., 2010b; Hebert et al., 2003a,b; Schindel and Miller, 2005), identifying species based on single loci is not always possible (Kozol et al., 2012). It has increasingly been re-cognized that accurate species delineation in copepods requires multi-locus approaches. In these, two or more independent markers from the same individuals and from both mitochondrial and nuclear regions are considered. Such markers include the mitochondrial cytochrome oxi-dase C subunit I gene (mtCOI), mitochondrial cytochrome b (mtCYTB), 12SrDNA, 16SrDNA, nuclear H3, 18SrDNA, 28SrDNA, and internal transcribed spacer 2 (ITS2) (Blanco-Bercial et al., 2011; Braga et al., 1999; Cornils and Blanco-Bercial, 2013; Figueroa, 2011; Hirai et al., 2013; Huys et al., 2007; Jørgensen et al., 2010; Marrone et al., 2013; Marszalek et al., 2008; Thum, 2004; Thum and Harrison, 2009; von Reumont et al., 2012; Wyngaard et al., 2010).
Easton and Thistle (2014) and Cornils (2015)described new DNA extraction protocols allowing biologists to use the same specimen for morphological and molecular studies. These approaches are more ne-cessary than ever due to several reports describing the subdivision of harpacticoid populations (morphologically similar morphs or cryptic taxa) with high dispersal rates (Avise, 1994; Burton and Lee, 1994; Garlitska et al., 2012; Karanovic et al., 2018; Palumbi, 1994; Rocha-Olivares et al., 2001; Street and Montagna, 1996; Willett and Ladner, 2009). Nannopus is well known for frequent misidentifications (Fiers and Kotwicki, 2013; Garlitska et al., 2012). The genus is widely dis-tributed in tropical and warm-temperature habitats in both hemi-spheres, but it is also found in temperate and arctic regions (see dis-tribution map in Garlitska et al., 2012). Staton et al. (2005) demonstrated the existence of sympatric cryptic species of this genus in South Carolina, USA. Later,Garlitska et al. (2012)showed that N. pa-lustris is composed of several cryptic and distinct species based on mi-tochondrial cytochrome b and nuclear 28SrDNA. Fiers and Kotwicki (2013)found that populations of N. palustris appear to be composed of several species using morphological data. Due to widespread species distributions (Karanovic et al., 2018) and the presence of sympatric species (Garlitska et al., 2012; Staton et al., 2005), identifications of
Nannopus species using classical approaches can no longer be con-sidered accurate. In the present study, we aimed to identify Nannopus species obtained from 15 intertidal mudflats across the West Coast (Yellow Sea) to South Coast (South Sea) in Korea during the years 2013, 2015, and 2016 using an integrative approach. We aimed to (i) identify Nannopus species in Korea using non-destructive DNA extraction methods, (ii) compare cryptic species and morphologically distinct species using mitochondrial and nuclear genes, (iii) determine genetic distances and divergence patterns among mitochondrial and nuclear genes, (iv) evaluate phylogenetic relationships based on single genes, concatenated dataset, and morphological characters, and (v) examine the distributions of these species and determine their overlapping ha-bitats.
2. Materials and methods 2.1. Sampling
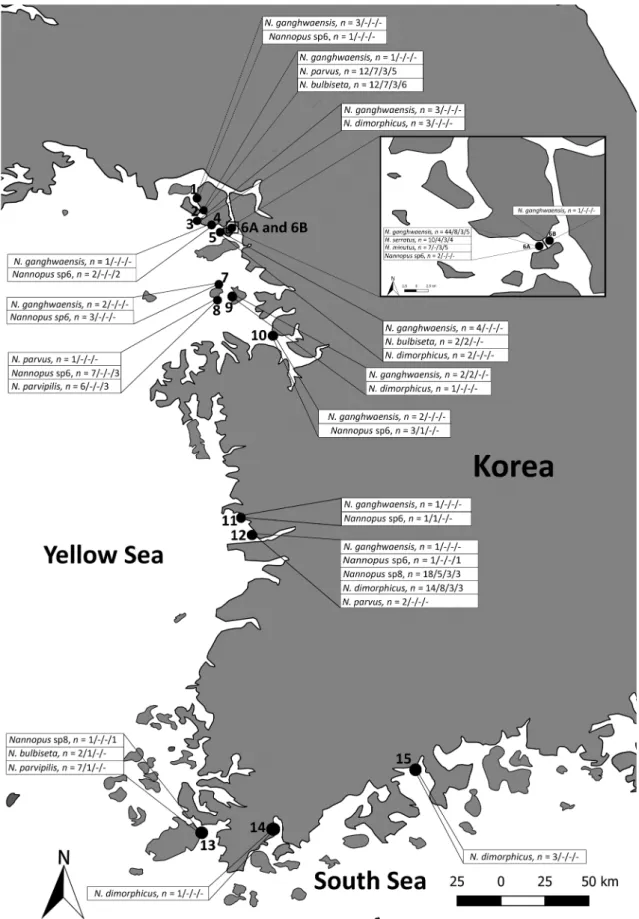
Sediment samples were collected from 15 intertidal mudflats along the west (Yellow Sea) and south coasts of Korea in 2013, 2015, and 2016 (Table 1;Fig. 1). The top 4–7 cm of sediment was sampled at each station. The initial extractions of meiofauna from sediment samples were performed immediately at the sampling sites by decantation (Pfannkuche and Thiel, 1988) and fixed with 99% ethanol. All samples were brought directly to the laboratory and washed with fresh water over a 38 μm mesh size sieve to separate the fine sediment. We ex-tracted copepods by differential flotation with Ludox (Burgess, 2001). Copepods were sorted from the extracted organisms under a dissecting microscope (Olympus SZX12). All maps were obtained from the Quantum GIS Geographic Information System.
2.2. DNA extraction and amplification
Copepod specimens were transferred into distilled water for 15–20 min and washed to remove ethanol. Each whole specimen was transferred into 10–15 μl lysis buffer, prepared as described inWilliams et al. (1992). Tubes with 2X single worm lysis buffer and whole spe-cimen were placed in a PCR-thermo cycler (Takara, Japan) operated with the following settings: 65 °C 16 min, 95 °C 20 min, and 15 °C for 3 min. After this step, the PCR tubes were placed in a freezer (−20 °C) for 10–20 min, and the extracts were thawed at room temperature without disturbing the specimens. The total lysis buffer with genomic DNA was carefully transferred to new PCR tubes without animals using 2.0–20.0 μl micropipettes under a stereo microscope. Then the PCR tubes with specimens and without lysis buffer were filled with 70 or 99% ethanol for morphological identifications and descriptions after Table 1
Sampling stations and distribution of the nine species of genus Nannopus.
Station Number Sampling Localities Latitude/Longitude Species
1 Naega-myeon, Ganghwa-gun, Korea 37°41′50.3″N/126°23′12.9″E N. ganghwaensis and Nannopus sp6 2 Yangdo-myeon, Ganghwa-gun, Korea 37°40′08.4″N/126°24′20.9″E N. ganghwaensis, N. parvus, and N. bulbiseta
3 Hwado-myeon, Ganghwa-gun, Korea
Hwado-myeon, Ganghwa-gun, Korea 37°37′45.8″N/126°22′27.3″E N. ganghwaensis and N. dimorphicus
4 37°35′35.7″N/126°27′20.1″E N. ganghwaensis and Nannopus sp6
5 Gilsang-myeon, Ganghwa-gun, Korea 37°35′06.9″N/126°30′32.3″E N. ganghwaensis, N. bulbiseta, and N. dimorphicus 6a Gilsang-myeon, Ganghwa-gun, Korea 37°35′55.9″N/126°30′49.2″E N. ganghwaensis, N. serratus, N. minutus, and Nannopus sp6
6b Gilsang-myeon, Ganghwa-gun, Korea 37°35′55.9″N/126°30′49.2″E N. ganghwaensis
7 Sipripo beach, Ongjin-gun, Korea 37°16′53.5″N/126°28′58.6″E N. ganghwaensis and Nannopus sp6 8 Yeongheung-myeon, Ongjin-gun, Korea 37°14′16.6″N/126°28′16.8″E N. parvus, N. parvipilis, and Nannopus sp6 9 Yeongheung-myeon, Ongjin-gun, Korea 37°14′44.2″N/126°31′32.4″E N. ganghwaensis and N. dimorphicus 10 Seosin-myeon, Hwaseong-si, Gyeonggi-do, Korea 37°07′15.5″N/126°41′03.5″E N. ganghwaensis and Nannopus sp6 11 Biin-myeon, Seocheon-gun, Chungcheongnam-do, Korea 36°08′07.1″N/126°34′46.9″E N. ganghwaensis and Nannopus sp6 12 Janghang-eup, Seocheon-gun, Chungcheongnam-do,
Korea 36°01′45.2″N/126°39′56.0″E N. ganghwaensis, N. parvus, N. dimorphicus, Nannopus sp6, andNannopus sp8 13 Gogun-myeon, Jindo-gun, Jeollanam-do, Korea 34°30′00.8″N/126°22′23.3″E N. bulbiseta, N. parvipilis, and Nannopus sp8
14 Doam-myeon, Gangjin-gun, Jeollanam-do, Korea 34°31′36.5″N/126°45′43.6″E N. dimorphicus
Fig. 1. Distribution and sampling sites of nine Nannopus species in Korean waters. The numbers represent the number of fragments of mtCOI/mtCYTB/18SrDNA/ 28SrDNA amplified from each site. The sampling sites of 15 localities are shown and the black line between Station 6a and 6b represents a man-made road with no gap or slits for water entry from either side.
Table 2 Primer sequences and PCR thermal settings used for molecular phylogenetic analysis. Gene (primer type) Source Primer Primer sequence PCR thermal profile Product size Species amplified mtCOI (universal primers) Folmer et al. (1994) LCO1490 GGTCAACAAATCATAAAGATATTGG 94 °C: 5 min; 40 a× (94 °C: 60 s, 46 °C: 120 s, 72 °C: 180 s); 72 °C: 10 min 660 bp N. ganghwaensis and N. serratus HCO2198 TAAACTTCAGGGTGACCAAAAAATCA Geller et al. (2013) jgLCO1490 TITCIACIAAYCAYAARGAYATTGG 94 °C: 4 min; 40 a× (94 °C: 60 s, 48 °C: 50 s, 72 °C: 60 s); 72 °C: 8 min 660 bp N. parvus, N. bulbiseta, N. dimorphicus ,N. parvipilis , Nannopus sp6, and Nannopus sp8 jgHCO2198 TAIACYTCIGGRTGICCRAARAAYCA Designed by Y.-H. Lee (KIOST b) MaxilloF CWAAYCATAAAGAYATTG 94 °C: 5 min; 45 a× (94 °C: 30 s, 42 °C: 120 s, 72 °C: 60 s); 72 °C: 10 min 660 bp N. minutus MaxilloR ACTTCAGGRTGNCCAAAR mtCOI (internal or nested primers) Present study GanF TTTATTAGCGGGCAGGTGAGC 94 °C: 4 min; 40 a× (94 °C: 30 s, 54 °C: 45 s, 72 °C: 60 s); 72 °C: 7 min 580 bp N. ganghwaensis ,Nannopus sp6, and Nannopus sp8 GanR AAGGTGCTGGTACAACACAGG SerF GGACAGGGTTAAGCGTACTTATT 94 °C: 2 min; 35 a× (94 °C: 30 s, 51 °C: 40 s, 72 °C: 60 s); 72 °C: 7 min 540 bp N. serratus and N. parvipilis SerR CTGGTATTGAGGTTACGGTCTG MinF TGGGCAGGAATAATTGGGACTG 94 °C: 4 min; 40 a× (94 °C: 40 s, 53 °C: 50 s, 72 °C: 60 s); 72 °C: 7 min 605 bp N. minutus MinR GGTGCTGGTATAATACAGGGT ParF GGACTGATCGGAACAGCTTTGA 94 °C: 4 min; 40 a× (94 °C: 35 s, 52 °C: 45 s, 72 °C: 60 s); 72 °C: 7 min 584 bp N. parvus ParR CCCTCCTCTTGTTTCATAA BulF CTTGAGCAGGTCTTGTAGGAAC 94 °C: 4 min; 40 a× (94 °C: 45 s, 52 °C: 45 s, 72 °C: 60 s); 72 °C: 8 min 546 bp N. bulbiseta BulR TCGGTGAGCAGCATAGTGATAG DimF AGCTTGGGCGGGAATAATTG 94 °C: 4 min; 40 a× (94 °C: 45 s, 51 °C: 45 s, 72 °C: 60 s); 72 °C: 7 min 610 bp N. dimorphicus DimR AAGTGCTGGTAGAGAACAGG mtCYTB (universal primers) Easton and Thistle (2014) cb415H GCYTTYTTAGGYTATGTNYTNCCYTGRGG 98 °C: 3 min; 12 a× (98 °C: 35 s, 53 °C: 35 s, 72 °C: 60 s); 36 a× (98 °C: 35 s, 58 °C: 35 s, 72 °C: 60 s) 72 °C: 7 min 500 bp N. ganghwaensis ,N. minutus ,N. parvus, N. serratus ,N. bulbiseta, N. parvipilis ,N. dimorphicus ,Nannopus sp6, and Nannopus sp8 cb922H GCHAYNACNCCYCCYAAYTTATTWGG mtCYTB (universal internal or nested primers) Easton and Thistle (2014) cb424h GGYTATGTNYTNCCYTGRGGDCARAT 94 °C: 4 min; 40 a× (94 °C: 45 s, 53 °C: 45 s, 72 °C: 60 s); 72 °C: 7 min 475 bp N. ganghwaensis, N. serratus ,N. minutus ,N. parvus, N. dimorphicus, Nannopus sp6, and Nannopus sp8 cb897h GGDAYDGMHCGYAAAATDGCRTANGC Merritt et al. (1998) UCYTB151F TGTGGRGCNACYGTWATYACTAA 94 °C: 3 min; 35 a× (94 °C: 30 s, 53 °C: 35 s, 72 °C: 60 s); 72 °C: 7 min 430 bp N. bulbiseta ,N. parvipilis ,and Nannopus sp6 UCYTB270R AANAGGAARTAYCAYTCNGGYTG mtCYTB (internal or nested primers) Present study CybulF GGGCCACTGTAATCACAAAT 94 °C: 3 min; 35 a× (94 °C: 30 s, 50 °C: 35 s, 72 °C: 60 s); 72 °C: 7 min 370 bp N. bulbiseta CybulR ATATCACTCGGGCTGAATGTG 18SrDNA (universal primers) Yamaguchi (2003) 18SF1 TACCTGGTTGATCCTGCCAG 94 °C: 5 min; 40 a× (94 °C: 30 s, 50 °C: 30 s, 72 °C: 60 s); 72 °C: 7 min 1828 bp N. ganghwaensis ,N. minutus ,N. serratus ,N. parvus, N. bulbiseta ,N. dimorphicus ,N. parvipilis ,Nannopus sp6, and Nannopus sp8 18SR9 GATCCTTCCGCAGGTTCACCTAC 18SrDNA (universal internal primers) Yamaguchi (2003) 18SF2 CCTGAGAAACGGCTRCCACAT These primers were used for primer walking to sequence the 1828 bp 18SF3 GYGRTCAGATACCRCCSTAGTT 18SF4 GGTCTGTGATGCCCTYAGATGT 18SR6 TYTCTCRKGCTBCCTCTCC 18SR7 GYYARAACTAGGGCGGTATCTG 18SR8 ACATCTRAGGGCATCACAGACC 28SrDNA (universal primers) Ortman (2008) 28SF1a GCGGAGGAAAAGAAACTAAC 94 °C: 5 min; 40 a× (94 °C: 30 s, 52 °C: 30 s, 72 °C: 60 s); 72 °C: 7 min 860 bp N. ganghwaensis ,N. minutus ,N. parvus, N. serratus ,N. bulbiseta, N. dimorphicus ,N. parvipilis ,Nannopus sp6, and Nannopus sp8 28R1a GCATAGTTTCACCATCTTTCGGG Hillis and Dixon (1991) 28Sdd GTCTTGAAACACGGACGAAGGAGTCT 94 °C: 5 min; 40 a× (94 °C: 30 s, 60 °C: 30 s, 72 °C: 60 s); 72 °C: 7 min 637 bp 28Sff GGTGAGTTGTTACACACTCCTTAGTCGGAT (continued on next page )
genetic analysis. The specimens used for morphological descriptions were submitted to the National Institute of Biological Resources (NIBR) with their respective taxonomic papers (Supplementary Table S1). The remaining specimens are preserved at the Biodiversity Lab of Hanyang University (Supplementary Table S1). The un-purified total genomic DNA was kept at less than −70 °C for long-term storage. Four gene loci that are widely used in harpacticoid systematics and phylogeny were sequenced: the mitochondrial cytochrome oxidase C subunit I (mtCOI) and mitochondrial cytochrome b (mtCYTB) genes (Burton and Lee, 1994; Easton et al., 2010; Garlitska et al., 2012; Karanovic et al., 2014; Rocha-Olivares et al., 2001) and nuclear 18SrDNA and 28SrDNA frag-ments (Burton et al., 2005; Easton et al., 2010; Garlitska et al., 2012). All gene fragments were amplified with PCR premix (Bioneer Co., Daejon, Korea), using 2–4 μl of DNA. The mtCOI was first amplified with three different universal primer sets according to the amplification efficiency of the species (Table 2); later, a second PCR reaction was carried out in fresh PCR premix containing 2–3 μl of the first PCR product as the template, using species-specific internal primers (see Table 2). The mtCYTB gene was amplified with primers described in Easton and Thistle (2014); a second PCR reaction was carried out in fresh PCR premix containing 2–3 μl of the first PCR product as the template. A nested primer pair was used as described inEaston and Thistle (2014), UCYTB151F and UCYTB270R (Merritt et al., 1998), and new internal primer pairs were also used as nested PCR primers for certain species (seeTable 2). Nuclear 18SrDNA was amplified with 18SF1 and 18SR9 primers only (Yamaguchi, 2003). Nuclear 28SrDNA was amplified as two fragments with 28SF1a/R1a (Ortman, 2008) and 28Sdd/ff (Hillis and Dixon, 1991) primer sets, which yielded 1310 bp of contiguous sequences. In addition, we obtained 3370 bp contiguous sequences of 28SrDNA with two sets of primers, 3060 bp with 28SF1a (Ortman, 2008)/28xx (Hillis and Dixon, 1991) primers and 310 bp with newly designed 28SGanF1/R1 primers (Table 2). Successful amplifica-tions were confirmed by electrophoresis on 1% agarose gel. If targeted gene fragment was present, gel with targeted DNA was excised with a sterile knife and purified for sequencing reactions either by the Qiagen Gel extraction kit or LaboPassTM Gel Extraction Kit. All gene fragments were sequenced on ABI3730XL sequencers in two different companies (Macrogene, Korea and CosmoGenetech, Korea) using the same set of primers. 18SrDNA and 28SrDNA were sequenced by primer walking with additional internal primers (seeTable 2for more details). 2.3. Molecular data analysis (species delimitation and phylogeny)
Each sequence was checked for quality of signal and sites with possible low resolution and corrected by comparing forward and re-verse strands. Nuclear 18SrDNA and 28SrDNA contigs were assembled in GeneStudio (ver. 2.2.0.0; http://genestudio.com). The consensus sequences were verified by conducting searches using BLAST (NCBI) (Altschul et al., 1990) to confirm the sequences as copepods. All alignments were manually checked and corrected where necessary. Fragments of all specimens were checked one-by-one in ORF finder to confirm the presence of an open reading frame (https://www.ncbi.nlm. nih.gov/orffinder/). All sequences were aligned using ClustalW (Thompson et al., 1994) implemented in MEGA (ver. 7.0.26) (Kumar et al., 2016) with default settings. Further, alignments were translated into protein using ClustalW to confirm the presence of an open reading frame, ambiguities, or insertions-deletions i.e., indications of non-functional copies of mtCOI and mtCYTB. We performed analyses of single genes and of the concatenated dataset using the following alignment: mtCOI, mtCYTB, 18SrDNA, and 28SrDNA fragments. The best fit-model of nucleotide substitution was assessed using jModelTesta (ver. 2.1.10) (Darriba et al., 2012), which incorporates the program PhyML (Guindon and Gascuel, 2003) (Table 3).
We adopted several different approaches to delimit potential species (either cryptic or morphologically distinct). First, genetic distances among trimmed sequences of four genes were calculated with the
Table 2 (continued ) Gene (primer type) Source Primer Primer sequence PCR thermal profile Product size Species amplified 28SrDNA (universal primers) Ortman (2008) 28SF1a GCGGAGGAAAAGAAACTAAC 94 °C: 4 min; 40 a× (94 °C: 45 s, 58 °C: 40 s, 72 °C: 90 s); 72 °C: 7 min 3060 bp N. ganghwaensis , N. minutus , N. serratus , N. parvus, N. bulbiseta, N. dimorphicus , N. parvipilis , Nannopus sp6, and Nannopus sp8 Hillis and Dixon (1991) 28Sxx GTGAATTCTGCTTCACAATGATAGGAAGAGCC Litvaitis et al. (1994) D3A GACCCGTCTTGAAACACGGA These primers were used for primer walking to sequence the 3060 bp. Ki et al. (2011) Cop-F250 AGTCGAGTTGTTTGGGAGTACAGC Ortman (2008) 28SR1 GCATAGTTTCACCATCTTTCGGG 28SrDNA Present study 28SIntF1 GTGCAGATCTTGGTGGTAGTAG 28SIntF12 GACGCGCATGAATGGATTAAC 28SIntR1 CCTCAGAGCCAATCCTTATC 28SIntR2 CACTTAAGCAAGCCACACTTCTC 28SIntR3 CCCAAGGCTTCTAATCATTCGC 28SIntR4 GCTACTACCACCAAGATCTGCAC 28SIntR5 CGCTTGGACGAATCTCTTCAC 28SIntR6 CATCGATCAACGACCAACTCA 28SIntR7 ATGGACCAGATTCCCTTTCG 28SrDNA Present study 28SGanF1 GTCGGCCTATCGATCCTCTTTA 94 °C: 4 min; 40 a× (94 °C: 20 s, 52 °C: 30 s, 72 °C: 50 s); 72 °C: 7 min 310 bp 28SGanR1 GACCTACTAAACAAGAACAGTCG aNumbers of cycles. bKorea Institute of Ocean Science & Technology, Korea.
uncorrected p-distance option in MEGA (ver. 7.0.26). Distances were calculated between all specimens (data not presented) and using the between group mean and within group mean for all clades inferred by Bayesian and maximum likelihood phylogenetic analyses.
The automatic barcode gap discovery (ABGD) method was also applied using 190 mtCOI sequences of nine Nannopus species and 53 mtCYTB sequences of eight Nannopus species. The ABGD approach clusters sequences into hypothetical species based on differences be-tween intra- and interspecific distance (i.e., barcoding gap) (Puillandre et al., 2012). The simple distance option was used, and we tested X values (relative width of the barcoding gap) with 1.5 and a maximum P value (the prior maximum divergence of intraspecific diversity) of 0.1 using the online ABGD server (http://wwwabi.snv.jussieu.fr/public/ abgd/abgdweb.html).
To assess species number in the present dataset, we used the re-sulting phylogenetic tree from PhyML as input for the Bayesian im-plemented Poisson tree processes (bPTP) model for species delimita-tion. This process was conducted using the bPTP web server (Zhang et al., 2013). For this purpose, all sequences were collapsed to haplo-types. A total of 98 mtCOI haplotypes and 35 mtCYTB haplotypes of individual species were analyzed. The bootstrap values were calculated using 1000 replicates (Felsenstein, 1985) and the complete deletion option for single genes in MEGA (ver. 7.0.26) (Kumar et al., 2016). The concatenated dataset under the likelihood criterion was estimated using ML bootstrap in RAxML-HPC2-XSEDE (ver. 8.2.10) (Stamatakis, 2014) with 1000 bootstrap iterations on the CIPRES portal (Miller et al., 2010). Bayesian inference trees for all datasets were constructed using MrBayes (ver. 3.2.6) (Ronquist et al., 2012). The gaps at the edges (mtCOI, mtCYTB, 18SrDNA, and 28SrDNA) and indels (18SrDNA and 28SrDNA) were manually trimmed for all datasets. In the concatenated dataset, the missing characters were coded as “?” for N. minutus mtCYTB sequences due to failure of PCR amplification even after sev-eral attempts. This could be the result of primer inefficiency while binding to the targeted site due to high divergence or polymorphism. Previous studies suggest that missing data are not problematic in Bayesian analyses and that incomplete taxa can be accurately placed as long as the overall numbers of characters are large (Wiens, 2003; Wiens and Moen, 2008). RAxML treats missing data specifically for species with missing sequences and does not discard the whole gene informa-tion for all species. The sequences of Tigriopus californicus were obtained from NCBI and used as an outgroup (mtCOI and mtCYTB: DQ913891, 18SrDNA: AY599492, and 28SrDNA: AF363324). The size of the D3 region of 28SrDNA ranging between 296 and 300 bp in populations of
N. palustris sensu Garlitska et al. (2012). The same D3 region was
chosen from the Korean species and aligned with N. palustris sensu Garlitska et al. (2012). Further, mtCYTB sequences among the popu-lations of N. palustris sensuGarlitska et al. (2012)ranged between 266 and 351 bp and were aligned with Korean species. Indels were not trimmed. Sequence variability was calculated with the complete dele-tion opdele-tion using the simple p-distance opdele-tion in MEGA (ver. 7.0.26). All trees were rooted with T. californicus as an outgroup. The maximum likelihood analysis of the concatenated dataset in RAxML, single gene datasets in MEGA, and Bayesian analyses of both single gene and concatenated datasets in MrBayes were constructed with 50% majority rule consensus. The final results of BI and ML in MrBayes and RAxML were retrieved in FigTree (ver. 1.4.3) (http://tree.bio.ed.ac.uk/ software/figtree). ABGD and bPTP analyses were performed without using outgroup sequences.
3. Results
3.1. Summary of sequencing data
A total of 190 Nannopus specimens of different individual samples (190 for mtCOI, 53 for mtCYTB, 25 for 18SrDNA, and 43 for 28SrDNA) was sequenced (Supplementary Table S1), and these four genes were
amplified using samples from the same individuals (Supplementary Table S1). Mitochondrial protein-coding genes had no indels in the alignments and no stop codons within the reading frame, indicating that all fragments analyzed were functional.
3.2. Individual gene sequences and concatenated dataset
Five independent Bayesian analyses (mtCOI, mtCYTB, 18SrDNA, 28SrDNA, and concatenated dataset) with five million generations were conducted in MrBayes. The final standard deviation of split frequencies was below 0.01 (the average values for single genes: 0.001 and 0.008, concatenated dataset: 0.001). The potential scale reduction factor (PSRF) was 1.0 for all parameters (range for datasets: 1.000–1.008), suggesting that convergence had been reached in each single gene analysis.
The final alignment of the concatenated dataset consisted of 3300 bp (521 bp for mtCOI, 392 bp for mtCYTB, 1758 bp for 18SrDNA, 629 bp for 28SrDNA). We examined a total of 25 sequences belonging to nine species of Nannopus and T. californicus. The phylogenetic ana-lyses of the concatenated data set in ML and BI of all nine Nannopus species are retained as monophyletic (Fig. 2,Supplementary Fig. A1). ML analyses of the same alignments supported nine highly divergent clades, as in the BI tree (Fig. 2,Supplementary Fig. A1). All clades were supported with moderate to strong bootstrap values (BP > 76%), in-dicating the presence of nine divergent lineages (Fig. 2). The moderate bootstrap values at the basal nodes among clade-A species are mainly due to the presence of highly conserved nucleotides in 18SrDNA and 28SrDNA regions. The topology of the BI tree was the same as that of the ML tree, and the Bayesian posterior probability values of all clades were above 0.89 (Supplementary Fig. A1). The BI and ML trees each consist of two groups, the first group further divided into two clades (clade-A and clade-B inFig. 2). Clade-A consists of N. ganghwaensis, Nannopus sp6, Nannopus sp8, and N. dimorphicus and clade-B contains only N. minutus (Fig. 2). The second group was further split into two clades (clade-C and clade-D inFig. 2). Clade-C consists of N. serratus and N. parvipilis, while clade-D consists of N. parvus and N. bulbiseta (Fig. 2). Among all species, N. ganghwaensis, Nannopus sp6, and
Nan-nopus sp8 formed a cryptic complex (Fig. 2).
3.3. Single gene datasets
The length of the mtCOI fragments ranged between 527 and 666 bp, and the final alignment was 521 bp in the analyses after deleting the gaps presented in outgroup species. Trees from ML and BI had the same topologies. The topologies of BI and ML differed from the concatenated phylogeny regarding the position of clade-D species (Fig. 2). The ML and BI analyses grouped all sequences into nine divergent clades with strong bootstrap support (> 99%) and high posterior probability values (1.00) (Supplementary Fig. A2a and b). The basal nodes of the ML tree had moderate to strong bootstrap support (50 and 82%), and the pos-terior probability values of the BI tree were between 0.97 and 1.00 (Supplementary Fig. A2a and b).
The mtCYTB gene was PCR-amplified from only eight species as amplification was failed in N. minutus. The fragments of mtCYTB ranged in length from 392 to 461 bp, and the final alignment after trimming the ends on either side was 392 bp in the analyses. The trees from ML and BI were grouped into eight divergent clades (Supplementary Fig. A3a and b) with strong bootstrap supports (100%) and posterior probability values (> 0.99). The basal nodes of the ML tree were sup-ported with moderate to strong bootstrap values (44 and 98%), and the posterior probability values of the BI tree ranged between 0.73 and 1.00. The topology of the ML and BI trees conflicted with that of the concatenated phylogeny.
The low bootstrap values of some of the basal nodes in ML trees might be due to low phylogenetic signal from mitochondrial protein-coding genes or due to saturation at third codon positions (Karanovic
and Cooper, 2012; Karanovic and Kim, 2014; Kim et al., 2014). Another potential explanation is the presence of highly polymorphic sites within and among populations.
The fragments of 18SrDNA ranged in length from 1783 to 1828 bp, and the final alignment after excluding gaps was 1758 bp. The trees based on ML and BI analyses had the same topologies and were broadly divided into two major clades. The ML bootstrap support values for the two major clades were 99% and 100%, and the posterior probability values were both 1.00 (Supplementary Figs. A4 and A5). Among the major clades, only N. serratus and N. parvipilis were well supported as two distinct species with 93% bootstrap values, and the posterior probability value was 1.00. The 28SrDNA alignments for ML and BI were 629 bp. The ML tree was divided into two major clades with 50% and 99% bootstrap support (Supplementary Fig. A6). The topology of the Bayesian tree was the same as that of the ML phylogeny (Supplementary Figs. A6 and A7), with posterior probability values between 0.55 and 1.00. The topologies of single gene phylogenies did not correspond well with morphological characters, however the con-catenated dataset provides strong support for two major clades corre-sponding to morphology (Fig. 2). Among the individual gene trees, 18SrDNA and 28SrDNA are poorly resolved regarding the positions of clade-A, -B, and -D species. Nevertheless, including 18SrDNA and 28SrDNA in the concatenated phylogenetic analysis improved support values for several clades compared to single gene trees.
3.4. Molecular species delimitation
The ABGD method using 527 bp of mtCOI gene fragments formed a clear-cut barcode gap between 3 and 16% pairwise distances (Fig. 3A). The numbers of species varied with the use of different prior thresholds ranging from 0.0010 to 0.1000 prior intraspecific divergences (P) (Fig. 3B). The recursive partitioning at prior value of 0.1–0.2% sug-gested with 13 groups, and at prior value of 0.4% sugsug-gested with ten groups (Fig. 3B). The initial partitions were the majority and stable with only nine groups (Fig. 3B). These nine groups are congruent with the results of BI, ML, and bPTP analyses.
ABGD using 392 bp of mtCYTB fragments also formed a clear-cut barcode gap between 4 and 20% pairwise distance (Fig. 3C). The re-cursive partition did not appear in the plot (Fig. 3D), and only eight groups formed by each initial partitions (Fig. 3D). These eight groups are also corresponded with the results of BI, ML, and bPTP analyses.
The bPTP analysis also suggested the presence of nine species based on 527 bp of mtCOI (Fig. 4A) and eight species based on 392 bp of mtCYTB (Fig. 4B). Both genes suggested the presence of three cryptic species. These results were in concordance with the clades derived through phylogenetic analyses (BI and ML). The mtCOI acceptance rate was 0.13902, merge: 49849, split: 50151, estimated number of species
9–13; mean: 9.67. The mtCYTB acceptance rate was 0.07832, merge: 49749, split: 50251, estimated number of species 8–12; mean: 8.37. 3.5. Molecular divergence
The average p-distances among mtCOI (521 bp) of nine Nannopus species were very high, ranging from 17.2% to 28.4% (Supplementary Table S2). Within clade-A, N. ganghwaensis, Nannopus sp6, and Nan-nopus sp8 form a cryptic complex, and their genetic distances ranged between 20.3 and 21.9% (Supplementary Table S2). The average in-traspecific divergences of all Nannopus specimens were between 0.2 and 2.5%. The average p-distances among mtCYTB (392 bp) of eight species varied between 21.2 and 37.8% (Supplementary Table S3). The values among the N. ganghwaensis cryptic complex varied between 21.2 and 25.7% (Supplementary Table S3). The overall average p-distance within species of all taxa varied between 0.5 and 2.3%.
In 18SrDNA (1758 bp), the first group species were almost identical, with average pairwise distances between 0.1 and 0.6% (Supplementary Table S4). Further, clade-D species (N. parvus and N. bulbiseta) were identical, with only 0.2% divergence (Supplementary Table S4). The average interspecific divergence of some species varied between 3.1 and 7.1%. The intraspecific divergence ranged between 0.1 and 0.7%. In 28SrDNA (629 bp), the pairwise divergences among N. ganghwaensis cryptic complexes were between 0.1 and 0.3% (Supplementary Table S5), whereas clade-D species had only 0.5% (Supplementary Table S5). The average interspecific divergence varied between 1.3 and 5.9%. The intraspecific divergence ranged between 0.1 and 0.3%.
4. Discussion
Previous re-investigations of populations of Nannopus palustris that were previously regarded as widely distributed single species have re-sulted in the discovery of several cryptic and distinct species (Garlitska et al., 2012).Fiers and Kotwicki (2013)postulated that populations of N. palustris comprise several different species using morphological data. Numerous reports of cryptic diversity in copepods (Chen and Hare, 2008; Garlitska et al., 2012; Hill et al., 2001; Øines and Heuch, 2005; Previšić et al., 2016; Rocha-Olivares et al., 2001) as well as previous discrepancies in characterizations of this genus (Fiers and Kotwicki, 2013; Garlitska et al., 2012), led us to investigate the distribution and identification of Nannopus species from Korea using integrative ap-proaches in the present study.
We made five important observations. First, we found that the N. ganghwaensis clade comprises at least two additional previously un-recognized and probably reproductively isolated cryptic species. Second, we accomplished correct pairing of males and females of cer-tain species by employing molecular phylogeny considering Table 3
Best fit models based on AIC, AICc, and BIC computed in jModelTesta(ver. 2.1.10.)
Criterion Genes
mtCOI mtCYTB 18SrDNA 28SrDNA
Model Weights Model Weights Model Weights Model Weights
AIC TVM + I + G 0.5359 TPM3uf + I + G 0.3927 GTR + I + G 0.1414 TIM1 + I + G 0.3490
AICc HKY + G 0.9543 HKY + I + G 0.4053 GTR + I + G 0.1207 TIM1 + I + G 0.2850
BIC TPM3uf + I + G 0.7212 HKY + I + G 0.6647 TrNef + I 0.4325 TPM + I + G 0.5923
a Eighty-eight candidate models were assessed on a fixed topology; maximum likelihood (ML) optimized, and best tree search with the nearest neighbour interchange (NNI) option using the Bayesian information criterion (BIC), the Akaike information criterion (AIC), and the corrected AIC (AICc). The most appropriate models were suggested by jModelTest. Among the three criteria, we considered the lowest weighted models for ML and Bayesian inference (BI) analysis. Since the transition model with unequal base frequency (TIM1) is not implemented in MrBayes (ver. 3.2.6) and MEGA (ver. 7.0.26), we replaced it with the general time reversible (GTR) model for 28SrDNA as described inLecocq et al. (2013). The proportions of invariable sites (I) and gamma-distributed rates (G) defined in jModelTest were suggested to be conserved in all models (Lecocq et al., 2013). Further, the transversion model, AG = CT, and unequal base freq (TVM) and AC = CG, AG = CT, AT = GT and unequal base freq (TPM3uf) substitution models are not implemented in either tool, so we replaced them with Hasegawa-Kishino-Yano + Gamma (HKY + G) for mtCOI and Hasegawa-Kishino-Hasegawa-Kishino-Yano + Invariable + Gamma (HKY + I + G) for mtCYTB.
morphology and type localities. Third, we observed conflicting diver-gence patterns among the mitochondrial and nuclear genes. Fourth, our results indicate that all species sympatrically coexist over a broad geographic range (> 500 km) across the west to south coasts of South Korea. Fifth, we compared phylogenetic relationships based on the concatenated dataset to the morphological data.
4.1. Cryptic or pseudocryptic diversity: N. ganghwaensis species complex Some of the most fascinating observations of this study are the high levels of genetic diversity among morphologically similar species in clade-A (Fig. 2) that are not correlated to geographic distance (Fig. 1). Within the framework of the traditional p-distance approach, the threshold values for mtCOI in copepods were set at cut-off values greater than 15% (Lefébure et al., 2006). The mean p-distance values among mtCOI sequences of clade-A species are markedly higher than this value (i.e. 20.3–21.9%,Supplementary Table S2). It is also inter-esting that these values are even higher than differences between highly morphologically distinct species in clade-D (Fig. 2): 21.2% (N. gang-hwaensis vs. Nannopus sp6), 21.8% (N. ganggang-hwaensis vs. Nannopus sp8), and 20.2% (Nannopus sp6 vs. Nannopus sp8), but only 17.2% (N. parvus vs. N. bulbiseta). This indicates that cryptic taxa exhibit extreme mor-phological conservation despite high genetic divergence. The p-distance values among mtCYTB sequences ranged between 21.2 and 25.7% (Supplementary Table S3), typical of distinct species, and such values are already considered to represent strong support for cryptic diversity in harpacticoids (Easton et al., 2010).
The p-distance values among 18SrDNA and 28SrDNA are relatively small, ranging between 0.0 and 0.5 (Supplementary Tables S4 and S5). The poor divergence in ribosomal DNA is not surprising in the context
of previous harpacticoid studies (Easton et al., 2010), as ribosomal DNA evolves very slowly compared to mitochondrial DNA (Avise, 2000; Burton et al., 2013). Therefore, recently-evolved cryptic species may not exhibit divergence in these regions. Despite low divergence among 18SrDNA and 28SrDNA, divergence patterns among mtCOI and mtCYTB suggests that these species might be reproductively isolated. As has been hypothesized for intertidal harpacticoids such as T. cali-fornicus, divergence in mitochondrial genes may co-evolve with nuclear divergence to maintain optimal fitness (Barreto et al., 2011; Burton et al., 2006; Pereira et al., 2016). If there is contact between different populations or closely related species, such cytonuclear in-compatibilities may represent post-zygotic reproductive isolation (Barreto et al., 2011; Pereira et al., 2016; Sunnucks et al., 2017). Few studies demonstrate that the divergence of mtCOI fragments between 0.175 and 0.365% (HKY corrected) among populations of T. californicus is consistent with reproductive discontinuities (Peterson et al., 2013). Hence, these cryptic species are highly distinct despite similar phylo-geographic patterns. Further, these cryptic taxa were also separated as distinct species in ABGD, bPTP, and phylogenetic analyses (ML and BI). 4.2. Correct pairing of sexes according to morphology and type localities
Some of the most intriguing observations in this study are the ele-vated levels of sexual dimorphism in harpacticoid taxa (Vakati and Lee, 2017), which make it very difficult to correctly assess dimorphism per species due to overlapping habitats. In brief, sexual dimorphism in the total number of outer spines on the second and third swimming legs is observed in N. dimorphicus and in the N. ganghwaensis cryptic complex, but not in N. minutus males. The discovery that these dimorphisms are found in N. dimorphicus but not N. minutus was only possible using Fig. 2. Phylogenetic tree inferred from 24 mtCOI, mtCYTB, 18SrDNA, and 28SrDNA fragments belonging to nine Nannopus species inferred from maximum like-lihood (RAxML-HPC2-XSEDE, ver. 8.2.10) and Bayesian inference (MrBayes, ver. 3.2.6). ML analysis based on GTR + G + I for all genes, BI based on partition analysis (mtCOI: 1–521, mtCYTB: 522–913, 18SrDNA: 914–2671, 28SrDNA: 2672–3300), each with fixed priors. The following parameters were given: nst = 2 (mtCOI and mtCYTB) or 6 (18SrDNA and 28SrDNA), rates = invgamma (mtCYTB, 18SrDNA, 28SrDNA) and gamma (mtCOI). Markov chain Monte Carlo (MCMC) was run with following parameters: ngen = 5 × 10⁶, nchain = 4, and samplefreq = 102. The sampling trees were performed every 5 × 10²generations; among the four chains, three were heated, and one was cold, with a temperature value of T = 0.10. The burn-in value was set at 0.25; thus, the first 25% of the generations were discarded and a > 50% posterior probability consensus tree was constructed from the remaining datasets. Tigriopus californicus was used as outgroup. Numbers at the nodes represent bootstrap values/posterior probabilities.
genetic data. This suggests that males and females of different species might be mismatched when morphology alone is used for species de-limitation.
We also observed that N. parvus caudal setae VI and VII are strongly pinnate in females, but are naked in males (Vakati and Lee, 2017: pp. 35–36, Figs. 26A–C, 27C; pp. 38, Fig. 29B–D). Further, N. bulbiseta fe-male caudal seta V has a very distant shape compared with fe-male caudal seta V (Vakati and Lee, 2017: pp. 43, 45, Figs. 33D, 35A–C; pp. 46 Fig. 36A–C). In addition, N. dimorphicus caudal seta V is heavily bulbous anteriorly in females, but is slender in males (Vakati and Lee, 2017: pp. 16–17, 19, Figs. 9A–B, 10C–D, 12A–C; pp. 20 Fig. 13A–D). However, females and males of each species belong to the same clades in mole-cular phylogenies. Biologists have long known that cryptic species may be overlooked when morphology alone is used for species delimitation (Cornils, 2015; Easton and Thistle, 2014; Leasi and Norenburg, 2014; Vodă et al., 2015). However, our findings indicate that even morpho-logically distinct species can be overlooked under certain circum-stances. We also found that N. ganghwaensis, Nannopus sp6, and Nan-nopus sp8 form a cryptic complex without morphological divergence. 4.3. Divergence patterns among mitochondrial and nuclear genes
A number of in-group evolutionary hypotheses may be put forward in the light of our results. Mitochondrial protein-coding genes are
known to evolve more rapidly than nuclear ribosomal genes (Avise, 2000; Burton et al., 2013). mtCOI and mtCYTB are more effective for identifying recently evolved species in crustaceans than other genes (Baek et al., 2016; Bucklin et al., 2011; Cornils and Held, 2014; Garlitska et al., 2012; Staton et al., 2005; Tang et al., 2012; Toon et al., 2009). mtCYTB is also hypothesized to have a high divergence rate compared to mtCOI in T. californicus (Burton et al., 2007). mtCYTB is considered a very good candidate for studying intraspecific variation, such as the population-genetic structure in harpacticoids (Schizas et al., 2002, 1999; Staton et al., 2005). However, our data suggest that the divergence rates of these genes might not be the same for every group and may sometimes be even more specific per species. For example, the divergence values of the N. ganghwaensis species complex for mtCYTB lie between 21.2 and 25.7% (Supplementary Table S3), and these va-lues are close to those of mtCOI (20.3–21.9%,Supplementary Table S2). This indicates that the species in this cryptic complex have the same divergence rates among the mtCOI and mtCYTB genes. N. parvus and N. bulbiseta exhibit 17.2% divergence in mtCOI and 29.4% in mtCYTB, indicating that mtCYTB has a high divergence rate. The divergence values among the sequences of mtCOI and mtCYTB between and within species in the present study were typical for intrageneric and in-traspecific variation (Easton et al., 2010; Garlitska et al., 2012; Karanovic and Kim, 2014; Karanovic et al., 2015a,b, 2014; Karanovic and McRae, 2013; Lefébure et al., 2006; Rocha-Olivares et al., 2001; Fig. 3. Barcode gap analysis of Nannopus species generated by automatic barcode gap discovery (Puillandre et al., 2012). Distributions of simple pairwise distances and between each pair of specimens for the mtCOI and mtCYTB genes, (A) histogram of distance with a clear cut barcode gap – mtCOI, (B) number of PSHs obtained for each prior intraspecific divergence of mtCOI, (C) histogram of distance with a clear-cut barcode gap – mtCYTB, (D) number of PSHs obtained for each prior intraspecific divergence of mtCYTB.
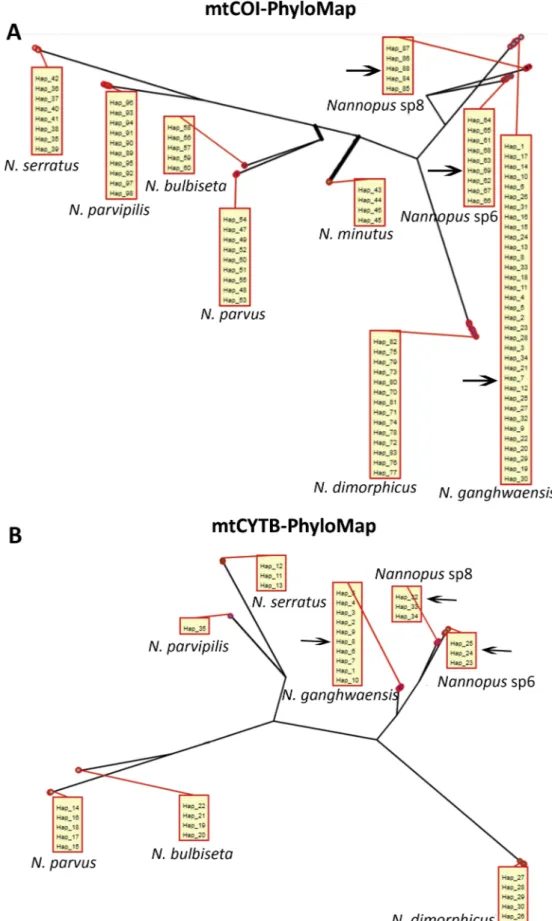
Fig. 4. PhyloMap visualization of bPTP results based on (A) mtCOI and (B) mtCYTB sequences. For (A), 46.94% of variance was explained by the first axis and 16.75% by the second axis. For (B), 61.69% of variance was explained by the first axis and 15.95% by the second axis. The thicker lines in both (A) and (B) indicate a longer branch length in the original species tree than in the PhyloMap plot. Boxes show only unique haplotypes of each species from all stations. The three cryptic species are marked with arrows.
Staton et al., 2005).
Due to slow evolutionary rates in 18SrDNA and 28SrDNA (Avise, 2000; Burton et al., 2013; Moriyama and Powell, 1997), recently evolved cryptic taxa might not exhibit any divergence at these loci (Tang et al., 2012). It is surprising that even morphologically highly distinct species (N. parvus and N. bulbiseta) exhibit poor divergence in 18SrDNA and 28SrDNA (Supplementary Tables S4 and S5). In contrast, some cryptic taxa of the genus Nannopus from South Carolina exhibit high genetic distances in the 28SrDNA-D3 region (Garlitska et al., 2012) (Supplementary Table S8). Interestingly, the distance matrix generated using the D3 region (296–300 bp) in 28SrDNA for popula-tions of N. palustris (Supplementary Table S6) and nine Korean species indicates that the divergence values among Korean species conflict between the D3 region and 629 bp fragment analysis (Supplementary Tables S5 and S8). The divergence values among clade-A and clade-B species were between 0.0 and 0.9% in the D3 region, but N. dimorphicus and N. minutus grouped closer together with 1.3% genetic distance from the N. ganghwaensis cryptic complex.
The divergence values also vary depending on the region and size of the region amplified within the genes, as observed in the D3 region among clade-A and B species. Therefore, species from the Black Sea and North Sea (i.e., geographically isolated) identified as single species by Garlitska et al. (2012)based on mtCYTB and 28SrDNA might appear to be different species if additional genes are analyzed. The BS and NS populations might possess enough divergence in mtCOI; it would be interesting to determine their mtCOI divergence in future studies. Based on these results, it is clear that relying on single genes to reveal species boundaries is difficult, and that proper species identification requires multigene analyses, as was previously suggested in several studies (Blanco-Bercial et al., 2011; Huys et al., 2007; Marrone et al., 2013; Thum and Harrison, 2009; von Reumont et al., 2012; Wyngaard et al., 2010).
Since morphological characters are not explicitly available for po-pulations of N. palustris, and both the 28SrDNA-D3 (296–300 bp) and mtCYTB (266–351 bp) regions are short and lacking sufficient phylo-genetic signal in both ML and BI trees (data not presented). Thus, these data were not included in the present phylogenetic analyses. However, the pairwise distances were calculated. The p-distance between popu-lations of N. palustris sensuGarlitska et al. (2012)and Korean species were between 30.6 and 43.8% in mtCYTB (Supplementary Table S7) and 2.5 and 7.8% in 28SrDNA-D3 regions (Supplementary Table S8). This indicates that these populations of N. palustris sensuGarlitska et al. (2012)are all genetically distinct from Korean species. On the other hand, analyses of the 11 key morphological characters noted in Garlitska et al. (2012)indicate that the populations are closely related to the first group in a concatenated phylogeny. However, multilocus phylogenetic analysis and complete morphological data are required to resolve this question.
4.4. Nannopus diversity in Korean waters
Yoo and Lee (1995) identified N. palustris from two localities in Korea, Youngjong Island (west coast) and Bongyoung (south coast), although their results disagree with those of the present study and cannot be confirmed due to a lack of specimens. On the basis of mtCOI phylogeny (Supplementary Fig. A2a and b), the N. ganghwaensis cryptic complex data clearly indicate that species are sympatric from ST1 to ST12 (Fig. 1;Supplementary Table S1). N. dimorphicus is distributed from ST3 to ST15 (Fig. 1;Supplementary Table S1). Based on the dis-tribution of N. dimorphicus, we may overlap their type localities and determine that the species of this genus are widely distributed from the northernmost west coast to the far southern coast. Although Fst and Mantel test results are not available to correlate genetic divergence with geographic distances, the observed population structure of these cryptic taxa probably does not fit the isolation-by-distance model. Gene-se-quence data for cryptic or pseudo-cryptic species is considered to be
strong when genetically distinct clades are found in sympatry rather than in allopatry, because sympatry implies that the accumulation of genetic differences is mostly due to reproductive barriers (Knowlton and Weigt, 1997). The sympatry of Nannopus species provides addi-tional support for our hypothesis that the N. ganghwaensis species complex should be recognized as three distinct species.
4.5. Phylogenetic relationships based on molecular data with regard to morphology
The resolution and support values for the concatenated dataset were better than those for single genes. Two groups were clearly separated with strong bootstrap support and posterior probability distributions (100 and 1.00). The monophyly of the two groups is supported by morphological characters. The first group (N. ganghwaensis, Nannopus sp6, Nannopus sp8, N. dimorphicus, and N. minutus) has four setae in the mandibular palp. The second group (N. serratus, N. parvipilis, N. parvus, and N. bulbiseta) has four setae in the fifth swimming leg exopod. The clade-A and clade-B within the first group are congruent with mor-phology. All four species within clade-A exhibit sexual dimorphism in the total number of spines on the third exopodal segment of the second and third swimming legs (three spines in females vs. four spines in males), whereas clade-B species do not have these characters (three spines in both sexes, secondary lose characters) and clade-B species also exhibit sexual dimorphism with two small integumental windows, lo-cated dorsolaterally on the left and right sides of the cephalothorax (present in females vs. absent in males) (Vakati et al., 2016; Vakati and Lee, 2017). The clade-C and clade-D within second group are also congruent with morphology, as both clade-C species with total three setae on the endopod of the fifth swimming leg, whereas in clade-D species, the second segment of antennule has unique setae (bulbous and pinnate). There is no sexual dimorphism in fifth swimming leg exopod articulation (fused to the baseoendopod in both sexes, secondary lost character) in clade-D species (N. parvus and N. bulbiseta).
Recently,Kim et al. (2017)hypothesized that the presence of one segmented endopod without distal apophysis in male (without sexual dimorphism) on the third swimming leg is a generic character of Nan-nopus, and that two segmented endopods with distal apophysis in male (with sexual dimorphism) on the third swimming leg is a generic character of Ilyophilus. They also suggested additional character states for separating Nannopus and Ilyophilus: rostrum with ventral setules (Nannopus) and dorsal setules (Ilyophilus), five mandibular setae (Nan-nopus) and four mandibular setae (Ilyophilus), sixth leg with two setae in males (Nannopus) and three setae in males (Ilyophilus). Hence,Kim et al. (2017)reinstated Ilyophilus as a valid genus. Further, they transferred several valid species from Nannopus to Ilyophilus. Finally, N. palustris and N. parvipilis were placed in Nannopus. According to Kim et al. (2017), all Korean Nannopus species should be placed in Ilyophilus ex-cept N. parvipilis. However, the position of N. parvipilis in the present phylogeny is within the second group, which also sharesKim et al. (2017)suggested Ilyophilus generic character in N. serratus, N. parvus, and N. bulbiseta as first group species (i.e. two segmented endopod and distal apophysis in males on third swimming leg, see Table S9). The remaining generic characters of Nannopus suggested by Kim et al. (2017)are broadly present within N. serratus, N. parvus, and N. bulbiseta (Vakati and Lee, 2017) (see Table S9). Although there are no molecular data for N. unisegmentatus, it is nearly morphologically identical to N. serratus, so we assume that genetically they would group into a single clade within the second group. This indicates that Ilyophilus characters suggested byKim et al. (2017)are shared within both major clades except in N. parvipilis, and Nannopus characters are broadly shared in the species also sharing Ilyophilus characters within second group (see Table S9). Therefore, the hypothesis of splitting Nannopus and Ilyophilus is not resolving. All these species required a revision with additional derived characters and molecular phylogeny for the proper generic hypothesis.
Despite the one segmented endopod without distal apophysis in males on the third swimming leg is an apomorphy, we estimate that the same pattern might also present in the other clade due to convergence, as harpacticoids are known to have convergent evolution with several characters. Since few species comprise the first group, perhaps such characterization cannot be explored in the first group at the moment. Further, only one species with one segmented endopod without distal apophysis in males on the third swimming leg is having molecular data. It is difficult to say that all species having this character would simply fall under the same clade to consider those all species belong to Nannopus. Therefore, an important question of where N. palustris should be placed in the phylogenetic tree becomes relevant.
Due to the lack of molecular data for N. palustris and remaining congeners (except for Korean species), we were unable to estimate their phylogenetic relationships in the present study. For example, N. didel-phis and N. procerus have four setae on the mandibular palp, as observed in our first group. However, relationships to the first group are difficult to evaluate, as the male genital apparatus in these two species is sym-metrically confluent and there are two spermatophores, whereas in the remaining congeners and the nine species examined in the present study, the male genital apparatus is asymmetrically confluent and there is only one spermatophore. There is a possibility that the male genital apparatus might support two major clades found using molecular data [first group: symmetrically confluent and two spermatophores (N. di-delphis and N. procerus) and second group: asymmetrically confluent and one spermatophore (remaining all congeners)]. On the other hand, the third exopodal segment of the fourth swimming leg has inner sub-distal pectinate setae, and this character could separate the genus into two major clades, probably N. palustris and N. scaldicola in one major clade and the remaining congeners in another major clade. However, these placements are speculative and molecular phylogenetics and re-descriptions of N. palustris based on topotypic materials are required before any attempt can be made to resolve the generic hypothesis. 4.6. Implications of molecular data for Nannopus and/or meiofauna diversity
Widespread sympatric speciation has been observed in several groups (Chen and Hare, 2008; Fenchel, 1975; Muangmai et al., 2015; Naughton et al., 2014; Schizas et al., 2002), indicating that it is wide-spread from macrofauna to microfauna including copepods and mi-croalgae. Nannopus is predominantly identified from intertidal zones all over the world. The coexistence of several species complexes of Nan-nopus in Korea, especially those in clade-A and clade-B, raises questions. When several species complexes (clade-A and clade-B) are sympatric over distances of at least 500 km, the previously identified populations of N. palustris from localities across the globe could be several different species.
Finally, the results of the present study and previous reports of sympatric speciation across several groups (Chen and Hare, 2008; Fenchel, 1975; Muangmai et al., 2015; Naughton et al., 2014; Schizas et al., 2002) indicate that species delimitation based on morphology lacks accuracy (often classifying two or more distinct species as a single species). At the same time, a single species can possibly be misidentified as two species, which could explain the N. parvus and N. bulbiseta. In order to effectively identify and describe copepod species, non-de-structive DNA extraction should be used as in the present study, by which we demonstrated the presence of clade-A, clade-B, and clade-D. Such approaches may minimize the misidentification of species and reveal true biodiversity.
5. Conclusions
Our work represents successful sequencing of benthic harpacticoid copepods (approximate sizes of specimens were between 350 and 850 μm), from 190 individuals for four genes (mtCOI, mtCYTB,
18SrDNA, and 28SrDNA). This study demonstrated the presence of three cryptic species (the N. ganghwaensis cryptic complex) sharing si-milar phylogeographic patterns. The other two morphologically distinct species that we identified could also be misinterpreted due to complex morphological evolution, and overlapping habitats (N. minutus and N. dimorphicus). A single species could be misidentified as two different species, as in N. parvus and N. bulbiseta. Furthermore, nuclear ribosomal DNA does not demonstrate divergence even among morphologically distinct taxa; thus, multigene analyses of both mitochondrial and nu-clear regions are necessary for accurate species delimitation. Based on the present species distribution and morphology (first group), popula-tions of N. palustris from all over the world probably represent several different species. The identification of strong derived characters and molecular phylogenetic analyses are necessary to determine the true phylogeny, while possibly splitting this genus into several taxa. The complex condition with this genus and distribution patterns such as those observed in the present study require non-destructive DNA ex-traction methods to identify species composition. Such methodologies are crucial to the assessment of harpacticoids and/or meiofauna di-versity. Further, the observed patterns of co-occurrence of subpopula-tions and cryptic species of Nannopus i.e., the N. ganghwaensis cryptic complex, raises interesting questions such as how these cryptic species, which are thought to require different ecological resources and exhibit geographic subdivisions, are sympatric. To address this question, mo-lecular phylogenetics and population genetics studies should be per-formed after intensive sampling in different habitats with respect to tidal heights, wave exposure, water currents, temperature, food sources, larval drifts, dispersal rates, salinity, and anthropogenic impact studies.
Acknowledgments
We would like to thank Jeongho Kim for assisting in the collection of sediments from type localities. We are very grateful to Dr. Terue Cristina Kihara, and her institute (DZMB, Germany) for permitting us to use the photo of confocal image for graphical abstract. This study was supported by a grant entitled “Discovery project of endemic species in Korea” from the National Institute of Biological Resources funded by the Ministry of Environment, Korea (NIBR 201601201), and a grant (2018R1D1A1B07050117) from Korea Research Foundation, and the BK21 Plus Program (Eco-Bio Fusion Research Team, 22A20130012352) funded by the Ministry of Education (MOE, Korea) to WL. This work was additionally supported by National Research Foundation of Korea Grant (2018R1C1B3001650) and the Chung-Ang University Research Grant in 2017 to SE.
Appendix A. Supplementary material
Supplementary data to this article can be found online athttps:// doi.org/10.1016/j.ympev.2018.10.004.
References
Altschul, S.F., Gish, W., Miller, W., Myers, E.W., Lipman, D.J., 1990. Basic local alignment search tool. J. Mol. Biol. 215, 403–410.
Avise, J.C., 1994. Molecular Markers, Natural History and Evolution. Springer, US, New York.
Avise, J.C., 2000. Phylogeography: The History and Formation of Species. Harvard University Press, Cambridge.
Baek, S.Y., Jang, K.H., Choi, E.H., Ryu, S.H., Kim, S.K., Lee, J.H., Lim, Y.J., Lee, J., Jun, J., Kwak, M., Lee, Y.-S., Hwang, J.-S., Venmathi Maran, B.A., Chang, C.Y., Kim, I.-H., Hwang, U.W., 2016. DNA barcoding of metazoan zooplankton copepods from South Korea. PLoS One 11, e0157307.
Barreto, F.S., Moy, G.W., Burton, R.S., 2011. Interpopulation patterns of divergence and selection across the transcriptome of the copepod Tigriopus californicus. Mol. Ecol. 20, 560–572.
Beheregaray, L.B., Caccone, A., 2007. Cryptic biodiversity in a changing world. J. Biol. 6 9 9.