Clinical Investigations
Respiration 2010;80:275–284 DOI: 10.1159/000283687
Association of Antigen-Stimulated Release of
Tumor Necrosis Factor-Alpha in Whole Blood
with Response to Chemotherapy in Patients with
Pulmonary Multidrug-Resistant Tuberculosis
Seok-Yong Eum
a
Ye-Jin Lee
a
Jin-Hong Min
b
Hyun-Kyung Kwak
a
Min-Sun Hong
a
Ji-Hye Kong
a
Soo-Hee Hwang
b
Seung-Kyu Park
b
Jason J. LeBlanc
d
Laura E. Via
d
Clifton E. Barry, III
d
Sang-Nae Cho
c
a Divisions of Immunopathology and Cellular Immunology, and of Molecular Microbiology, International Tuberculosis Research Center, b National Masan Tuberculosis Hospital, Masan , and c Department of Microbiology, Yonsei University College of Medicine, Seoul , Republic of Korea; d Tuberculosis Research Section, National Institute of Allergy and Infectious Diseases, National Institutes of Health, Bethesda, Md. , USA
levels were similar. During chemotherapy, the levels of all 4 cytokines increased. We evaluated these responses sepa-rately in patients that did and did not clear their sputum cul-ture at 2 and 6 months. At 2 months, decreases in both IFN- ␥ and IL-12 correlated strongly with a successful early response, while after 6 months of therapy, when half (7/14) of MDR-TB patients were still sputum culture positive, downregulation of TNF- ␣ was uniquely correlated with sputum conversion between the groups. Conclusion: Our findings suggest the possibility that the regulation of TNF- ␣ production in whole blood may be a more specific indicator of sputum conver-sion at 6 months than IFN- ␥ , IL-12 or IL-10 in MDR-TB pa-tients. Copyright © 2010 S. Karger AG, Basel
Introduction
Mycobacterium tuberculosis (Mtb) is the causative
agent of pulmonary tuberculosis (TB). Currently, there are two major problems facing the medical community Key Words
Chemotherapy ⴢ Interferon- ␥ ⴢ Interleukin-10 ⴢ Interleukin-12 ⴢ Multidrug-resistant tuberculosis ⴢ Mycobacterial clearance ⴢ Tuberculosis ⴢ Tumor necrosis factor- ␣
Abstract
Background: We have previously reported that TNF- ␣ levels correlate to total mycobacterial burden in tuberculosis (TB) patients. Objective: To characterize the dynamics of cyto-kine responses in TB patients during chemotherapy to iden-tify potential surrogate markers for effective treatment. Methods: Following induction by culture filtrate proteins in whole blood, production patterns of TNF- ␣ , IL-10, IFN- ␥ and IL-12 were measured in 23 non-multidrug-resistant (MDR)-TB and 16 MDR-TB patients and in 31 healthy controls. Rates of mycobacterial clearance from the sputum were then mea-sured and compared. Results: Prior to the initiation of che-motherapy, TNF- ␣ and IL-10 levels were significantly higher in TB patients than in healthy controls while IFN- ␥ and IL-12
Received: April 7, 2009
Accepted after revision: November 30, 2009 Published online: February 10, 2010
concerning the fight against Mtb. First, the increasing emergence of multidrug-resistant (MDR)-TB has ren-dered common therapies against the bacteria ineffective. Second, the current testing methodologies for the diag-nosis of TB are extremely slow. Because Mtb is a slow-growing organism, it can take up to 8 weeks for an accu-rate Mtb diagnosis to be made. As a result, there is an increasing need for both novel therapies and rapid diag-nostic methods.
After Mtb infection, healthy individuals develop a cel-lular immune response, which arrests the growth of the microorganism, preventing progression to clinical TB [1, 2] . However, susceptible individuals develop pulmonary TB. Upon inhalation of aerosolized Mtb, the pathogen is engulfed by macrophages. Once inside the phagosome, virulent Mtb inhibits the acidification of the compart-ment [3] . This inhibition allows the bacilli to reside with-in the macrophage, sequestered away from the bacteri-cidal and antigen-generating machinery of the cell. As a result, Mtb establishes a safe and long-term resting area for replication, which eventually results in cell lysis and bacterial spread.
Upon stimulation by a pathogen, macrophages engulf the offending particle, and upon its destruction, they present smaller peptide antigens on their surface. These antigens are then recognized by Th1 cells, which in turn
secrete various cytokines, including IFN- ␥ , IL-12 and
TNF- ␣ . These cytokines in turn activate resting
macro-phages, which trigger the immune response. In order to suppress the immune response once an infection has been cleared, and to prevent autoimmune responses to self-antigens, other cytokines downregulate the immune system. IL-10 activates B and Th2 cells while inhibiting Th1 cytokine production. Activated Th2 cells secrete
IL-4, which also inhibits Th1 cell activity and inactivates macrophages.
Previously, it has been reported that Mtb stimulation of peripheral blood mononuclear cells (PBMCs) isolated from TB patients resulted in a diminished production
and expression of Th1 cytokines, including IFN- ␥ and
IL-2 [4] . Additionally, this same report demonstrated that
after 9 months of drug therapy, IFN- ␥ levels were
mark-edly increased, coinciding with successful treatment. As a result, it has been suggested that different clinical states of Mtb can be correlated with cytokine profiles.
In an effort to reduce the amount of time required to accurately diagnose an Mtb infection, some attention is being focused on identifying biomarkers of Mtb infec-tions; examples include molecules that are secreted by the pathogen itself, or host factors derived from immune re-sponses. In this study, we build upon our previous
find-ings that TNF- ␣ , IFN- ␥ and IL-10 profiles are distinct in
non-MDR-TB versus MDR-TB patients [5] . Using spu-tum clearance as an indicator of positive responses to chemotherapies, we report that patients on anti-Mtb
che-motherapies have altered TNF- ␣ and IFN- ␥ levels that
correlate with favorable responses to the drugs. As a re-sult, we propose that these cytokines, particularly TNF-␣ , could serve as potential biomarkers for response to therapy.
Patients and Methods
Study Subjects
A total of 39 patients (35 men and 4 women) who were diag-nosed with active TB by clinical findings, radiological examina-tion and the demonstraexamina-tion of acid-fast bacilli (AFB) in their sputum at the National Masan TB Hospital (NMTH) were
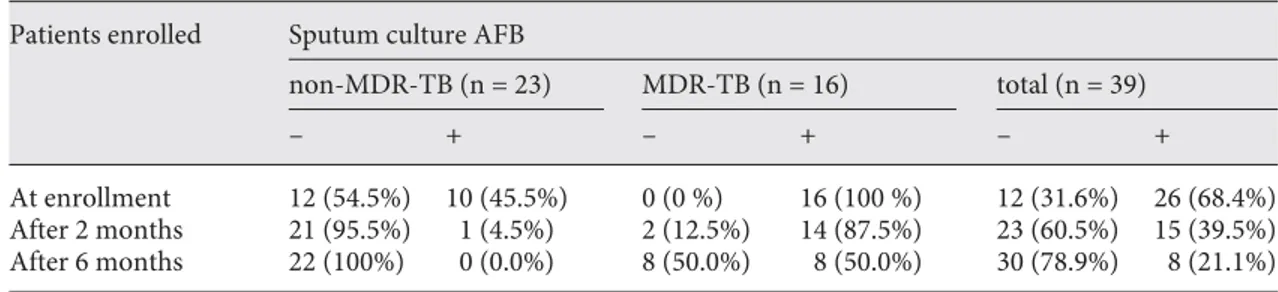
en-Table 1. Sputum culture AFB-negative conversion rate in non-MDR and MDR-TB patients along with
ther-apy
Patients enrolled Sputum culture AFB
non-MDR-TB (n = 23) MDR-TB (n = 16) total (n = 39)
– + – + – +
At enrollment 12 (54.5%) 10 (45.5%) 0 (0 %) 16 (100 %) 12 (31.6%) 26 (68.4%)
After 2 months 21 (95.5%) 1 (4.5%) 2 (12.5%) 14 (87.5%) 23 (60.5%) 15 (39.5%)
After 6 months 22 (100%) 0 (0.0%) 8 (50.0%) 8 (50.0%) 30 (78.9%) 8 (21.1%)
One of the 39 patients enrolled who was culture negative at enrollment and not responsive to therapy was omitted from the analysis.
rolled for this study ( table 1 ). Thirty-one bacillus Calmette-Guérin (BCG)-vaccinated, healthy individuals (15 men and 16 women) also participated as controls. The study protocol was approved by the NMTH Institutional Ethics Committee and written informed consent was obtained from each study sub-ject.
Sputum Culture and Drug Susceptibility Test
Sputum culture positivity for Mtb was confirmed both by BacT/Alert and conventional Ogawa media. Briefly, sputum spec-imens were decontaminated with N-acetyl- L -cysteine/4% NaOH and inoculated into BacT/Alert and Ogawa media. When the Oga-wa growth Oga-was detected as positive, a drug susceptibility test Oga-was carried out on Löwenstein-Jensen plates containing anti-TB drugs. The ‘absolute concentration method’ was used as previ-ously described [6, 7] . The critical concentration for isoniazid and rifampin was 0.2 and 40 g/ml, respectively. All inoculated slants were incubated at 37 ° C and growth was checked visually every week. The sputum culture staining for AFB was assessed at the time of admission, and 2 and 6 months after starting proper treat-ment.
Blood Collection and Cytokine Whole-Blood Assay
Blood samples were drawn into heparinized Vacutainers and processed within 2 h for the cytokine whole-blood assay [5, 8] . Blood was collected at the time of admission, and 2 and 6 months after the start of treatment prescribed by NMTH staff. Blood di-luted with RPMI-1640 (1: 10) containing penicillin-streptomycin (Gibco) and 10% fetal bovine serum was distributed into 96-well plates and cultured in triplicate in the presence of medium alone or with phytohemaggultinin (PHA) or lipopolysaccharide (LPS; Sigma-Aldrich, St. Louis, Mo., USA) or culture filtrate protein (CFP) at a final concentration of 10 g/ml. Cultures were main-tained in a 5% CO 2 atmosphere at 37 ° C. Cultured supernatants
were harvested 1, 3 and 6 days after culturing, and stored at –70 ° C until use. Cytokines were measured at day 1 for IL-12 and IL-10, day 3 for TNF- ␣ and day 6 for IFN- ␥ (optimal time points for each cytokine were determined by preliminary experiments, data not shown).
Measurement of Cytokines by ELISA
For cytokine analysis, two-site capture immunoassays with OptEIA monoclonal antibody sets (BD Pharmingen, Los Angeles, Calif., USA), streptavidin-horseradish peroxidase conjugate and recombinant cytokines as standards were used. Briefly, 96-well plates were coated with capture antibodies to each cytokine (IFN-␥ , IL-12, TNF- ␣ and IL-10) according to the manufacturer’s pro-tocol. The concentrations were given in the ELISA set instruc-tions as dilution factor, 1: 250. Plates were incubated overnight at 4 ° C and blocked at room temperature with 5% FBS in PBS for 1 h. The plates were washed three times. Samples were added and incubated for 2 h at room temperature. Working detector (detec-tion antibody + avidin-HRP reagent) was added to each well and the plate was incubated for 1 h at room temperature. After wash-ing 7 times, substrate solution (BD Pharmwash-ingen TMB substrate reagent set) was added to each sample. The plates were incubated for 30 min and the reaction was stopped by adding stop solution. The plates were read at 450 nm in an ELISA reader (OPTImax, Sunnyvale, Calif., USA). A standard curve was generated from the known concentration of the standard according to the method
provided in the kit. Cytokine levels were calculated from the stan-dard curve by computing absorbance values against the test con-centration. Detection limits of the cytokine kits used were as fol-lows: IFN- ␥ – 5 pg/ml; IL-12 – 7.5 pg/ml; TNF- ␣ – 15 pg/ml, and IL-10 – 7.5 pg/ml.
Statistical Analysis
The Mann-Whitney U test was used for data analysis between groups. Differences were considered significant when p ^ 0.05.
Results
Patient Description and Response to Chemotherapy
Thirty-nine subjects were enrolled in this study ( ta-ble 1 ). All subjects were examined for clinical symptoms and underwent standard radiographic assessment. The mean age of the patients was 49.4 8 2 years (range, 22–87 years). They included 14 newly diagnosed, 6 relapse, 7 chronic, 6 treatment failure, and 6 default cases as de-fined by the World Health Organization [9] . One case of pneumothorax was observed and 11 subjects had con-comitant diabetes mellitus, and 1 had hypertension. None of the patients were HIV positive. At the time of initial blood sampling, the patients had been started on chemo-therapy for ! 1 week. Thirty-one Microbacterium bovis BCG-vaccinated, healthy individuals (15 men and 16 women) also participated as controls, and their mean age was 34.6 8 1.5 years (range, 23–54 years). Of the 39 TB patients, 10 were culture-confirmed non-MDR-TB while 16 were culture-confirmed MDR-TB patients. Thirteen of the initial patients were sputum culture negative at the start of the therapy, and remained so throughout the 6-month study. Although they were culture negative, 12 of 13 of these patients experienced significant clinical im-provement with normal first-line chemotherapy during the course of this study while 1 patient did not. For that reason, this non-responsive patient was omitted from further analysis. In total, therefore, 38 patients were con-sidered to have diagnosed as TB and were included in subsequent analysis: 22 had drug-susceptible disease and 16 MDR disease.
Of the 10 sputum-positive drug-susceptible subjects, 9 had achieved sputum conversion after the first 2 months of therapy, and the last subject achieved sputum conver-sion after 6 months. In total, 100% of the non-MDR-TB subjects were sputum negative at the end of the therapy. Of the 16 MDR-TB subjects, only 2 subjects had achieved sputum conversion after 2 months. After 6 months of treatment, an additional 6 subjects (8 in total) had verted. In total, 50% of the MDR-TB patients had
con-verted to sputum negative by the conclusion of the study ( table 1 ).
Whole-Blood Cytokine Profiles during Chemotherapy
To explore whether changes in cytokine responses be-fore, during and after 6 months of drug therapy would provide a surrogate marker for sputum smear and cul-ture, we collected whole blood from healthy volunteers (n = 31) and our cohort of TB patients. This blood was stimulated with CFP from Mtb and 4 cytokines were
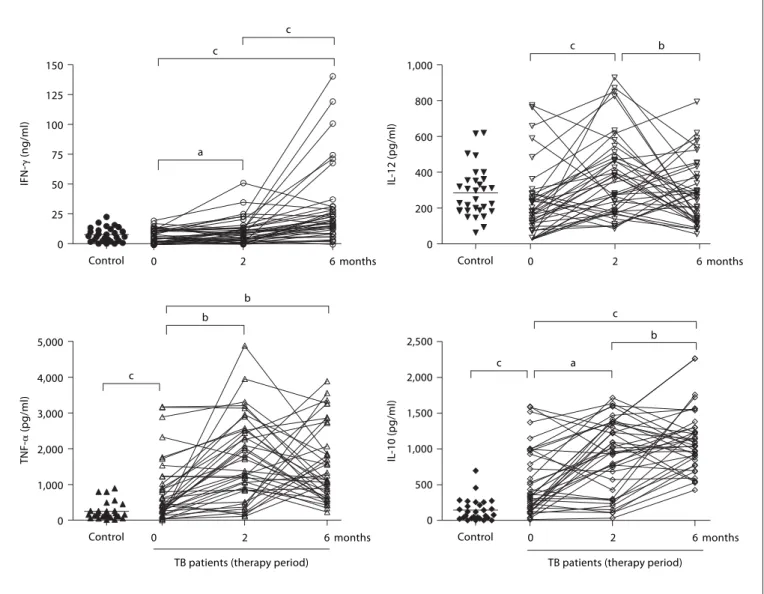
measured: IFN- ␥ , TNF- ␣ , IL-10 and IL-12 ( fig. 1 ).
At the start of treatment, there was no significant
dif-ference in the IFN- ␥ and IL-12 levels between TB patients
and healthy controls. IFN- ␥ levels increased with therapy
by 2 months (p ^ 0.05) and reached a plateau almost threefold higher compared to levels before treatment by 6 months of therapy. IL-12 levels similarly increased after 2 months of therapy (p ^ 0.01) but decreased to levels before therapy by 6 months ( fig. 1 ). In contrast,
signifi-cantly higher levels of TNF- ␣ and IL-10 were observed in
TB patients than healthy controls at the start of the treat-ment, and these cytokine levels also increased during 0 25 50 75 100 125 150 IFN-␥ (ng/ml)
Control 0 2 6 months Control 0 2 6 months
Control 0 2 6 months Control 0 2 6 months
a c c b b b c a c c c b 0 200 400 600 800 1,000 IL -12 (pg/ml) 0 1,000 2,000 3,000 4,000 5,000 TNF-␣ (pg/ml) 0 500 1,000 1,500 2,000 2,500 IL -10 (pg/ml)
TB patients (therapy period) TB patients (therapy period)
Fig. 1. Cytokine profiles and modulation by chemotherapy in whole blood from TB patients in comparison to
healthy controls. Whole blood was incubated with CFP (10 g/ml) for 1, 3 or 6 days and cytokine concentra-tions were assessed by ELISA. Each patient is represented by entry, and 2- and 6-month measurements (the mean of triplicate cultures after deducting the medium alone value). a p ^ 0.05, b p ^ 0.01 and c p ^ 0.001.
drug treatment ( fig. 1 ). In general, all 4 cytokines showed a complex dynamic response that appeared to fall into one of two general trends: either a transient increase at 2 months followed by a return to baseline levels at 6 months, or an increase at 2 months followed by a further increase at 6 months.
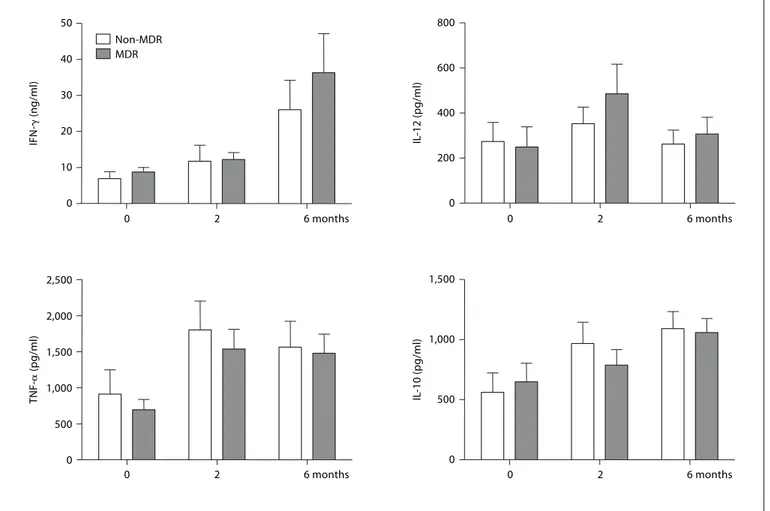
Cytokine Response Pattern Does Not Correlate with MDR Status But Is Mtb Specific
In an attempt to understand whether these two pat-terns of response were the result of previous treatment history or were specific to strains of Mtb that had drug resistance, we divided the patients into non-MDR- and MDR-TB groups and examined patterns of cytokine pro-duction between these groups, but no significant
differ-ences were observed ( fig. 2 ). Likewise, when comparing sputum culture-negative subjects that showed clinical improvement to sputum culture-positive patients, no dif-ferences in responses of cytokine profiles were observed (data not shown).
In order to verify that the cytokine responses seen were in fact specific to the Mtb antigens present in CFP, we stimulated the same blood samples with non-TB-re-lated mitogens to activate the aforementioned cytokines.
For these purposes, PHA was used to stimulate IFN- ␥
and IL-10, while LPS was used for TNF- ␣ and IL-12
stim-ulation ( fig. 3 ). No changes in IFN- ␥ levels were observed
between these groups during therapy. Similar results
were obtained with TNF- ␣ and IL-12 when comparing
CFP and mitogen stimulation. Interestingly, PHA-in-0 500 1,000 1,500 0 2 6 months 0 2 6 months 0 2 6 months 0 2 6 months 0 10 20 30 40 50 0 200 400 600 800 0 500 1,000 1,500 2,000 2,500 IFN-␥ (ng/ml) IL -12 (pg/ml) TNF-␣ (pg/ml) IL -10 (pg/ml) Non-MDR MDR
Fig. 2. Comparison of cytokine production and modulation by chemotherapy between non-MDR and MDR-TB
patients. Whole blood was incubated with CFP (10 g/ml) for 1, 3 or 6 days and cytokine concentrations were assessed by ELISA. Each value was calculated as the mean of triplicate cultures after deducting the medium alone value. Results are represented as means 8 SEM.
duced IL-10 production showed a reverse correlation with PHA induction ( fig. 3 ).
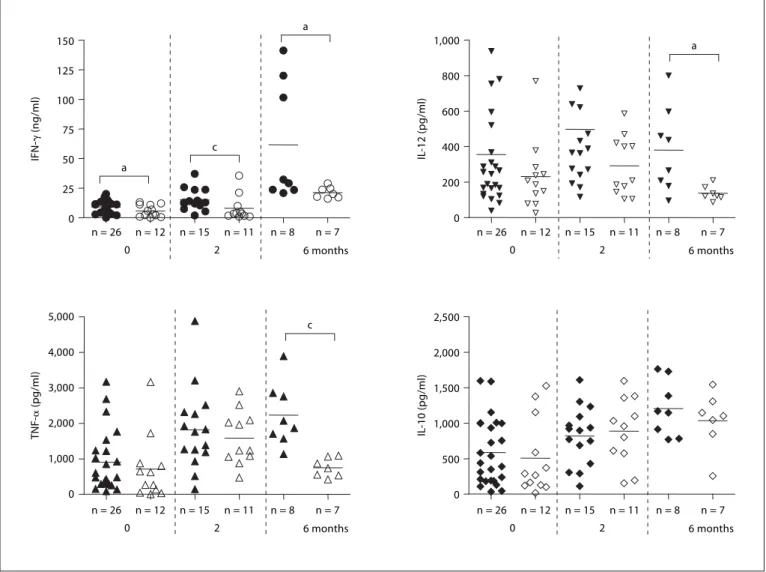
Effect of Sputum Clearance Rate on Cytokine Production Patterns
In an effort to see if the cytokine production patterns correlated with sputum conversion, we obtained sputum cultures from each subject at the time of blood drawing for cytokine assays and used these results to identify the sputum-positive or sputum-negative status at each time
point ( fig. 4 ). Prior to the start of therapy, IFN- ␥ levels
were overall lower in the 12 sputum culture-negative sub-jects compared to the culture-positive subsub-jects, a trend that continued when comparing groups of patients who had achieved a culture-negative status compared to those
who remained culture positive at each time point through-out the study. At the end of the treatment, those who re-mained culture positive had dramatically increased
amounts of IFN- ␥ compared to levels both before the
therapy and after 2 months even compared to those who
had converted at 6 months. A similar pattern to IFN- ␥
levels was seen with IL-12. Lower levels of IL-12 were re-leased in the patients who had converted to culture nega-tive than those who failed to at every time point. This result was statistically significant (p ! 0.05) after 6 months of therapy ( fig. 4 ).
TNF- ␣ and IL-10 showed somewhat different patterns
than IFN- ␥ and IL-12 in this cohort. Prior to therapy,
sputum-positive and sputum-negative subjects had
simi-lar levels of TNF- ␣ and IL-12. Although statistically
sim-0 10 20 30 40 IFN-␥ (ng/ml) Control 0 1,000 2,000 3,000 4,000 5,000 6,000 IL -12 (pg/ml) 0 3,000 6,000 9,000 12,000 15,000 TNF-␣ (pg/ml) 0 1,000 2,000 3,000 IL -10 (pg/ml)
TB patients (therapy period) TB patients (therapy period)
6 months 2
0 Control 0 2 6 months
Control 0 2 6 months Control 0 2 6 months
a c c c c c
Fig. 3. Cytokine profiles in whole blood after stimulation with PHA (IFN- ␥ and IL-10) or LPS (IL-12 and
TNF-␣ ) from TB patients and healthy controls. Each patient is represented by entry, and 2- and 6-month measure-ments (the mean of triplicate cultures after deducting medium alone value). a p ^ 0.05 and c p ^ 0.001.
ilar, both groups doubled their levels at 2 months.
How-ever, a dramatic change in TNF- ␣ was seen at 6 months,
when the sputum-negative population returned to cyto-kine levels before the therapy while remaining elevated in the sputum-positive population (p ! 0.001). Strikingly, IL-10, a cytokine which is involved in helping to turn off the immune response, was relatively unchanged by the presence or absence of Mtb in the sputum of subjects be-fore, during or after the therapy.
Discussion
Cytokine production patterns in TB patients are pre-sumed to vary according to the disease state, and we have
previously reported that TNF- ␣ was associated with
MDR-TB and mycobacterial load in sputum [5] . Howev-er, our previous study was cross-sectional, limiting our ability to evaluate these correlations as markers to poten-tially predict outcome. In this longitudinal study, we have extended this observation by comparing mycobacterial
0 200 400 600 800 1,000 0 1,000 2,000 3,000 4,000 5,000 0 500 1,000 1,500 2,000 2,500 n = 26 n = 12 0 n = 15 2 n = 8 n = 11 n = 7 6 months n = 26 n = 12 0 n = 15 2 n = 8 n = 11 n = 7 6 months n = 26 n = 12 0 n = 15 2 n = 8 n = 11 n = 7 6 months n = 26 n = 12 0 n = 15 2 n = 8 n = 11 n = 7 6 months 0 25 50 75 100 125 150 IFN-␥ (ng/ml) IL -12 (pg/ml) TNF-␣ (pg/ml) IL -10 (pg/ml) a a a c c
Fig. 4. Comparison of cytokine production patterns between
culture-positive (black) and -negative (empty) patients. Sputum cultures were performed at each time point and cytokine produc-tion was compared between culture-positive (black) and -negative (empty) patients. Only those patients who were sputum culture positive at the previous time point were reevaluated at the next
time point of therapy. Therefore, only 26 sputum-positive patients were evaluated at 2 months and only 15 sputum-positive patients were evaluated at 6 months. Each value was calculated as the mean of triplicate cultures after deducting medium alone value. a p ^
clearance during chemotherapy with TNF- ␣ levels pro-duced by stimulated whole blood in the same patients over time.
Prior to starting the therapy, TNF- ␣ and IL-10 levels
were significantly higher in TB patients than in healthy controls. These results are in agreement with other
pub-lished results for IL-10 [10, 11] and for TNF- ␣ [12–14] . In
contrast, IFN- ␥ and IL-12 levels were not different
be-tween healthy controls and TB patients. Many other
stud-ies report that the production of IFN- ␥ is depressed in TB
patients compared to healthy individuals [15–17] . How-ever, conflicting reports have demonstrated no
differenc-es in IFN- ␥ mRNA expression and the number of
IFN-␥ -producing cells between TB patients and healthy con-trols [18, 19] . This discrepancy may be explained by recent studies reporting that different disease states could
in-duce different IFN- ␥ responses [17, 20, 21] . In our patient
cohort, during anti-TB chemotherapy, the levels of IFN- ␥
increased significantly after 2 months and much more after 6 months in TB patients, consistent with other re-ports [4, 8] . IL-12 also increased after 2 months of thera-py, but after 6 months of therapy decreased again to levels
before therapy, whereas IFN- ␥ showed the highest
pro-duction levels at 6 months. Although IL-12 is known to
enhance IFN- ␥ production [2, 22] , this observation
sug-gests IFN- ␥ production is not dependent on IL-12
regula-tion, as already shown in another study [23, 24] . The de-crease in IL-12 production after 6 months of therapy may be related to the increase in the anti-inflammatory cyto-kine IL-10. IL-10 is known to be produced by macro-phages and T cells during Mtb infection and possesses macrophage-deactivating properties including downreg-ulating IL-12 production [25] . Because IL-10 acts as an
antagonist of TNF- ␣ and IFN- ␥ , it appears contradictory
that IFN- ␥ and TNF- ␣ would increase concomitantly
with IL-10. However, it is plausible to consider that IL-10 is functioning solely to downregulate the immune sys-tem. As drug treatment clears Mtb from the host, the
need for IFN- ␥ and TNF- ␣ production decreases, an
event regulated by IL-10. It is also in agreement with the drop in IL-12 to levels before the treatment, further indi-cating a reduction in the immune response.
IFN- ␥ is also involved in stimulating TNF- ␣ secretion
[26] . This study shows the induction of TNF- ␣ increased
as IFN- ␥ production increased during the course of
che-motherapy. Mitogen-induced cytokines showed different profiles from CFP-induced cytokines. No changes in levels
were observed in PHA-induced IFN- ␥ production with
therapy but LPS-induced IL-12 and TNF- ␣ production
levels correlated with those of CFP-induced levels. In
con-trast, PHA-induced IL-10 showed an inverse correlation with CFP-induced IL-10 production. The molecular and kinetic basis for this difference in response is not clear, however, successful therapy may have repressed the pro-duction of this immunosuppressive cytokine by non-spe-cific stimulation. Our findings suggest that chemotherapy may alter the specific cytokine production profiles.
In order to investigate if mycobacterial clearance in-duced by chemotherapy is mirrored by alterations in the cytokine response, serial sputum culture and cytokine measurements during therapy were examined. Almost all non-MDR-TB patients (9/10) who were initially spu-tum culture positive became spuspu-tum culture negative af-ter the first 2 months of therapy, whereas only 2 MDR-TB patients obtained sputum negativity. At this time point,
both IFN- ␥ and IL-12 production were decreased more
in sputum-negative patients than in sputum-positive pa-tients, indicating the normalization of the production of these 2 cytokines. However, no differences between
pa-tient groups were observed in TNF- ␣ and IL-10 levels. By
6 months after the therapy, 6 further MDR-TB patients
had become sputum culture negative, and IFN- ␥ and
IL-12 production also decreased in these sputum-negative patients compared to the persistently sputum-positive patients. Notably, IL-10 levels remained unchanged be-tween the two groups. However, there was a marked
re-duction in TNF- ␣ to levels similar to those seen in the
group of sputum-negative patients before the therapy.
These findings suggest the potential role of TNF- ␣ as a
marker for successful therapy in MDR-TB.
It has already been demonstrated that some MDR-TB
patients produce lower levels of TNF- ␣ but not IFN- ␥
compared with non-MDR-TB patients in PBMCs [27] or in whole blood [5] . Also, antigenic stimulation of periph-eral blood monocytes from MDR-TB induces different
trends of TNF- ␣ and IL-12 production compared to those
from non-MDR-TB patients [27] . The production of ni-tric oxide from peripheral blood monocytes was
de-pressed in MDR-TB patients and correlated with TNF- ␣
production [28] . Conversely, sputum TNF- ␣ levels
de-crease following initiation of treatment [29] and a positive correlation was observed between mycobacterial load
and TNF- ␣ levels in sputum by 12 weeks of treatment
[29] . While this may reflect variation in the patient popu-lations studied it is worth at least considering that this may reflect differential antigenicity of the TB strains that are more prone to develop into MDR disease. It is worth pointing out that at least one virulence factor of Beijing strains (the phenolic glycolipid) has been shown to have potent immunomodulatory properties [30] .
TNF- ␣ appears to be the most dynamic of the 4 cyto-kines investigated here, a finding that should support further evaluation of the response of this cytokine in TB
patients. Our results suggest CFP-induced TNF- ␣ levels
in whole blood are closely related to the clearance of Mtb in MDR-TB patients independent of IL-10 regulation and could be a useful indicator for monitoring response to therapy in MDR-TB patients. However, the sample size in the present study is too small to make a definitive conclu-sion and this hypothesis will have to be validated in larg-er patient cohorts. These studies also suggest the possibil-ity that an immune signature that correlates with sputum
conversion may exist that would provide an early indica-tor for discontinuation of therapy, a significant problem for MDR-TB where treatment courses often exceed 2 years.
Acknowledgments
This study was supported in part by the Division of Intramu-ral Research, National Institute of Allergy and Infectious Dis-eases, National Institutes of Health, Bethesda, Md., USA, and by a grant from the Brain Korea 21 Project for Medical Sciences in Yonsei University (S.-N.C.).
References
1 Blasi F, Tarsia P, Aliberti S: Strategic targets of essential host-pathogen interactions. Res-piration 2005; 72: 9–25.
2 Flynn JL, Chan J: Immunology of tuberculo-sis. Ann Rev Immunol 2001; 19: 93–129. 3 Vergne I, Chua J, Deretic V: Tuberculosis
toxin blocking phagosome maturation in-hibits a novel Ca 2+ /calmodulin-PI3K hVPS34
cascade. J Exp Med 2003; 198: 653–659. 4 Zhang M, Lin Y, Iyer DV, Gong J, Abrams JS,
Barnes PF: T-cell cytokine responses in hu-man infection with Mycobacterium tubercu-losis . Infect Immun 1995; 63: 3231–3234. 5 Eum SY, Jeon BY, Min JH, Kim SC, Cho SA,
Park SK, Cho SN: Tumor necrosis factor-alpha and interleukin-10 in whole blood is associated with disease progression in pul-monary multidrug-resistant tuberculosis patients. Respiration 2008; 76: 331–337. 6 Canetti G, Fox W, Khomenko A, Mahler HT,
Menon NK, Mitchison DA, Rist N, Smelev NA: Advances in techniques of testing myco-bacterial drug sensitivity, and the use of sen-sitivity tests in tuberculosis control pro-grammes. Bull World Health Organ 1969; 41: 21–43.
7 Heifets LB: Drug Susceptibility in the Che-motherapy of Mycobacterial Infections. Boca Raton, CRC, 1991, pp 89–121.
8 Hussain R, Talat N, Shahid F, Dawood G: Longitudinal tracking of cytokines after acute exposure to tuberculosis: association of distinct cytokine patterns with protection and disease development. Clin Vaccine Im-munol 2007; 14: 1578–1586.
9 World Health Organization, International Union against Tuberculosis and Lung Dis-ease, Royal Netherlands Tuberculosis Asso-ciation: Revised international definitions in tuberculosis control. Int J Tuberc Lung Dis 2001; 5: 213–215.
10 Torres M, Herrera T, Villareal H, Rich EA, Sada E: Cytokine profiles for peripheral blood lymphocytes from patients with active pulmonary tuberculosis and healthy house-hold contacts in response to the 30-kilodal-ton antigen of Mycobacterium tuberculosis . Infect Immun 1998; 66: 176–180.
11 Lee JS, Song CH, Kim CH, Kong SJ, Shon MH, Kim HJ, Park JK, Paik TH, Jo EK: Pro-files of IFN-gamma and its regulatory cyto-kines (IL-12, IL-18 and IL-10) in peripheral blood mononuclear cells from patients with multidrug-resistant tuberculosis. Clin Exp Immunol 2002; 128: 516–524.
12 Hirsch CS, Toossi Z, Othieno C, Johnson JL, Schwander SK, Robertson S, Wallis RS, Ed-monds K, Okwera A, Mugerwa R, Peters P, Ellner JJ: Depressed T-cell interferon- re-sponses in pulmonary tuberculosis: analysis of underlying mechanisms and modulation with therapy. J Infect Dis 1999; 180: 2069– 2073.
13 Ogawa T, Uchida H, Kusumoto Y, Mori Y, Yamamura Y, Hamada S: Increase in tumor necrosis factor alpha- and interleukin-6-se-creting cells in peripheral blood mononucle-ar cells from subjects with Mycobacterium tuberculosis . Infect Immun 1991; 59: 3021– 3025.
14 Kupeli E, Karnak D, Beder S, Kayacan O, Tutkak H: Diagnostic accuracy of cytokine levels (TNF- ␣ , IL-2 and IFN- ␥ ) in bron-choalveolar lavage fluid of smear-negative pulmonary tuberculosis patients. Respira-tion 2008; 75: 73–78.
15 Hussain R, Kaleem A, Shahid F, Dojki M, Jamil B, Mehmood H, Dawood G, Dockrell HM: Cytokine profiles using whole-blood assays can discriminate between tuberculo-sis patients and healthy endemic controls in a BCG-vaccinated population. J Immunol Methods 2002; 264: 95–108.
16 Sanchez FO, Rodriguez JI, Agudelo G, Gar-cia LF: Immune responsiveness and lympho-kine production in patients with tuberculo-sis and healthy controls. Infect Immun 1994; 62: 5673–5678.
17 Inokuchi N, Sugahara K, Soda H, Usui T, Hirakata Y, Fukushima K, Yamada Y, Kohno S, Kamihira S: Relationship between whole-blood interferon-gamma production and ex-tent of radiographic disease in patients with pulmonary tuberculosis. Diagn Microbiol Infect Dis 2003; 46: 109–114.
18 Johnson BJ, McMurray DN: Cytokine gene expression by cultures of human lympho-cytes with autologous Mycobacterium tuber-culosis -infected monocytes. Infect Immun 1994; 62: 1444–1450.
19 Surcel HM, Troye-Blomberg M, Paulie S, Andersson G, Moreno C, Pasvol G, Ivanyi J: Th1/Th2 profiles in tuberculosis, based on the proliferation and cytokine response of blood lymphocytes to mycobacterial anti-gens. Immunology 1994; 81: 171–176. 20 Ellner JJ, Hirsch CS, Whalen CC: Correlates
of protective immunity to Mycobacterium tuberculosis in humans. Clin Infect Dis 2000; 30:S279–S282.
21 Sodhi A, Gong J, Silva C, Qian D, Barnes PF: Clinical correlates of interferon- ␥ produc-tion in patients with tuberculosis. Clin Infect Dis 1997; 25: 617–620.
22 Cooper AM, Magram J, Ferrante J, Orme IM: Interleukin 12 (IL-12) is crucial to the development of protective immunity in mice intravenously infected with Mycobacterium tuberculosis . J Exp Med 1997; 186: 39–45.
23 Sahiratmadja E, Alisjahbana B, de Boer T, Adnan I, Maya A, Danusantoso H, Nelwan RHH, Marzuki S, van der Meer JWM, van Crevel R, van de Vosse E, Ottenhoff THM: Dynamic changes in pro- and anti-inflam-matory cytokine profiles and gamma inter-feron receptor signaling integrity correlate with tuberculosis disease activity and re-sponse to curative treatment. Infect Immun 2007; 75: 820–829.
24 Lee HW, Lee HS, Kim DK, Ko DS, Han SK, Shim YS, Yim JJ: Lack of association between interleukin-12 receptor  1 polymorphisms and tuberculosis in Koreans. Respiration 2005; 72: 365–368.
25 Gong JH, Zhang M, Modlin RL, Linsley PS, Iyer D, Lin Y, Barnes PF: Interleukin-10 downregulates Mycobacterium tuberculosis -induced Th1 responses and CTLA-4 expres-sion. Infect Immun 1996; 64: 913–918. 26 Appelberg R, Castro AG, Pedrosa J, Silva RA,
Orme IM, Minoprio P: Role of gamma inter-feron and tumor necrosis factor alpha during T-cell-independent and -dependent phases of Mycobacterium avium infection. Infect Immun 1994; 62: 3962–3971.
27 Lee JS, Song CH, Lim JH, Kim HJ, Park JK, Paik TH, Kim CH, Kong SJ, Shon MH, Jung SS, Jo EK: The production of tumor necrosis factor-alpha is decreased in peripheral blood mononuclear cells from multidrug-resistant tuberculosis patients following stimulation with the 30-kDa antigen of Mycobacterium tuberculosis . Clin Exp Immunol 2003; 132: 443–449.
28 Sharma S, Sharma M, Roy S, Kumar P, Bose M: Mycobacterium tuberculosis induces high production of nitric oxide in coordination with production of tumor necrosis factor-al-pha in patients with fresh active tuberculosis but not in MDR tuberculosis. Immunol Cell Biol 2004; 82: 377–382.
29 Ribeiro-Rodrigues R, Resende Co T, John-son JL, Ribeiro F, Palaci M, Sa RT, Maciel EL, Pereira Lima FE, Dettoni V, Toossi Z, Boom WH, Dietze R, Ellner JJ, Hirsch CS: Sputum cytokine levels in patients with pulmonary tuberculosis as early markers of mycobacte-rial clearance. Clin Diagn Lab Immunol 2002; 9: 818–823.
30 Reed MB, Domenech P, Manca C, Su H, Bar-czak AK, Kreiswirth BN, Kaplan G, Barry CE 3rd: A glycolipid of hypervurulent tuber-culosis strains that inhibits the innate im-mune response. 2004; 431: 84–87.