Prediction of Main Regime Transition with Variations of Gas and
Liquid Phases in a Bubble Column
Hanjin Im, Jeil Park, and Jae W. Lee
*
Department of Chemical and Biomolecular Engineering, KAIST, 291 Daehak-ro, Yuseong-gu, Daejeon 34141, Republic of Korea
*
S Supporting InformationABSTRACT: Industrial bubble columns mainly operate in a heterogeneous flow regime and identifying transition from homogeneous to heterogeneousflow is important. This work addresses the determination offlow regimes with gas−liquid systems in a bubble column. Various parameters of gas holdup, volumetric mass transfer coefficient, drift flux, and pressure standard deviations were investigated to precisely determine the superficial gas velocity at the transition regime. For a
column aspect ratio (H/D: static liquid height to column diameter ratio) of 2.5 to 5, the transitional superficial gas velocity generally became higher with lower liquid height. However, the reverse trend was observed with a low density gas system due to the difference in force balance acting around the bubble. The weak body force and drag force in a lower axial position interrupted the mass transfer process. The experimental results showed similar ranges of the transitional superficial gas velocity regardless of the choice of parameter for detecting it. Because there is no precise correlation about transition regime properties, we proposed new correlations to predict both transition regime superficial gas velocity and gas holdup by taking the intersection of the two regimes. The correlations precisely captured the transition regime properties within 15% deviations even in gas−liquid systems that are not tested in this work.
1. INTRODUCTION
The bubble column is an important gas−liquid contactor. It has been widely applied, such as in the petrochemical and mineral processing industries as well as in biomass production, because of their superior mass and heat transfer, simple con-struction, andflexible operation under various reaction condi-tions.1−6A bubble column consists of a main body column and a gas sparger at the bottom of the column. Gas is distributed through the gas sparger, and gas−liquid flow development occurs upon introduction to the column. The bubble column can be operated in batch, semibatch, or continuous modes. In our work, batch operation of bubble column was analyzed. There are two types of flow regimes in the bubble column operation: homogeneous and heterogeneous.7,8 In the homo-geneousflow regime, each bubble is uniformly distributed, and the uniform rise in velocity of each bubble results in limited frequencies of bubble coalescence.9Thisflow regime is usually observed at a low superficial gas velocity. The homogeneous flow regime can be classified into monodispersed homoge-neous and pseudohomogehomoge-neousflow regimes.10,11The former has aflat local void fraction and the latter has a center-peaked bubble size distribution. At a higher superficial gas velocity, the flow regime shifts to the heterogeneous flow regime (or churn-turbulentflow). In that regime, there is an improved turbulent motion of gas bubbles. Higher gas input and the vigorous mixing of gas bubbles induce repeated bubble coalescence in the column. There is a considerable population of large bubbles, and so a wide distribution of bubble size is observed. Therefore, in the homogeneous regime, a uniform size of smaller bubbles
can be observed, whereas larger bubbles are obtained in the heterogeneous regime.
Understanding the range of transition regimes is important in operating bubble columns with various liquid and gas phases because the mass transfer behavior between homogeneous and Received: October 5, 2018
Accepted: December 31, 2018
Published: January 16, 2019
Figure 1. Determination of transitional superficial gas velocity (Ar−monoethylene glycol (MEG) 25 wt % system).
Article
http://pubs.acs.org/journal/acsodf
Cite This:ACS Omega 2019, 4, 1329−1343
This is an open access article published under an ACS AuthorChoice License, which permits copying and redistribution of the article or any adaptations for non-commercial purposes.
Downloaded via KOREA ADVANCED INST SCI AND TECHLGY on August 31, 2019 at 16:28:55 (UTC).
heterogeneousflow is considerably different. The region of the transition regime depends on the column dimension, sparger design, and gas−liquid properties. Previous work reported that both the column diameter and column height affect the transitional superficial gas velocity.12−14 It was demonstrated that the column diameter has an effect on gas holdup for the column diameter column smaller than 0.15 m.15 For the column with a column diameter greater than 0.2 m and a column height greater than 2.2 m, the aspect ratio of height to diameter does not affect the gas holdup.16 Therefore, the aspect ratio with a smaller diameter or height than these is important in observing the transitional superficial gas velocity. The effect of gas−liquid property on the transitional superficial gas velocity was also studied. It was understood that the higher viscosity of liquid phase hinders the homogeneous regime stability and reduces the gas holdup.17−19
A number of methods have been used in determining the transition regime point. The gas holdup profile can be one of the determining parameters because the trend of gas holdup profiles differs between the two flow regimes along the super-ficial gas velocity.20
The concept of drift flux, which can be derived with gas holdup and superficial gas velocity, can also predict the transition point.21A specific band (3−5 Hz) is used as evidence of the incipient transition regime in the spectral analysis method based on the Fourier transform.22−24In addi-tion, a fractal method utilizing cyclic slow and rapid stochastic phenomena was applied to determine theflow regime transi-tion.23,25
Although there have been general studies on the transitional superficial gas velocity, no definitive answer has been given to this problem specifically when the gas−liquid phases and the aspect ratio vary. Previous studies developed a model to
predict the gas holdup at the transition regime using small bubble velocity.26,27By calculating two parameters in their models, the transitional superficial gas velocity could be determined. However, the transitional superficial gas velocity presented in the literature digressed from experimental observation and needed more accurate prediction.
Therefore, the purpose of this work is to investigate the transitional superficial gas velocity and to suggest an accurate model to predict the superficial gas velocity at the transition regime. Experiments were carried out to identify the superficial gas velocity at the transition regime of various gas phases in the organic or aqueous bulk liquid phase. We did not employ an air−water system as gas−liquid phases because many studies have already investigated this system.17,24,27In our work, the transition regime point was measured by the gas holdup, volumetric liquid-phase mass transfer coefficient, and drift flux
profile. Furthermore, the pressure standard deviation was applied to investigate the transition regime. The empirical results of this work were compared with the predicted transitional superficial gas velocity by using both prior correlations and our proposed correlation.26,27The comprehensive correlation proposed here accurately predicted the gas holdup and the superficial gas velocity by integrating the two models covering gas holdup at homogeneous and heterogeneousflow regimes.
2. RESULTS AND DISCUSSION
2.1. Transitional Superficial Gas Velocity. The transi-tional superficial gas velocity is an important issue in the operation of an industrial bubble column. Because homoge-neous and heterogehomoge-neousflow regimes have different hydro-dynamic properties, different equations estimating mass trans-fer parameters should be applied based on the delicately
Figure 3.Individual transition regime determined by the slope of nitrogen gas holdup.
determined transitional superficial gas velocity. Thus, in this work, numerous experiments determining the transitional super-ficial gas velocity with various methods were carried out to confirm the accuracy of the data. After the investigation of the empirical transitional superficial gas velocity, the results were compared with an existing model in prior studies and a new estimation model was developed to precisely predict the transi-tion regime.26,27
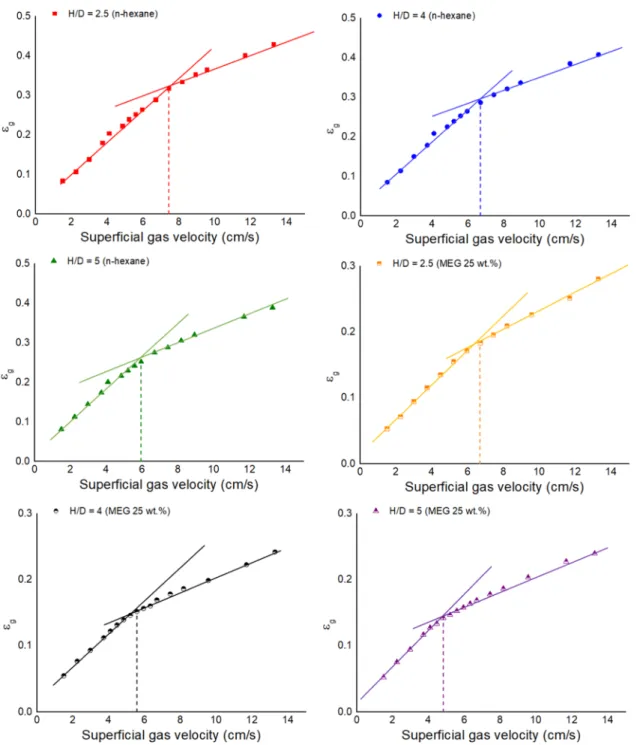
2.2. Gas Holdup. Gas holdup is an important design param-eter, as it has a significant influence on the column hydro-dynamic behavior and mass transfer. For the homogeneousflow regime, gas holdup quickly increases as the superficial gas velocity rises until it reaches the transitional superficial gas velocity. Once the superficial gas velocity reaches the transitional
superficial gas velocity, the ascending rate of gas holdup is reduced and the transition point from homogeneous to hetero-geneous regime can be clearly recognized. The determination of the transitional superficial gas velocity is shown inFigure 1 using a plot of gas holdup vs superficial gas velocity. Although the gas holdup itself did not show a linear relationship with the whole range of superficial gas velocity, the two separate linear estimations provide the superficial gas velocity at the transition point.
The investigation of the gas holdup data over different gas− liquid phases is illustrated inFigures 2−4. The determination of the overall transition regimes in the gas holdup can be referred to the Supporting Information (Figure S1). The regime transition can be observed as the superficial gas velocity varies
between 0.03 and 0.08 m/s. According to the observation, the increasing liquid height resulted in the reduced transitional superficial gas velocity. It is concurrent with previous obser-vations that higher static liquid heights induce lower transition regime velocities.13,20,28Overall, the gas holdup was lower at the n-hexane system than at the MEG 25 wt % system regard-less of gas species because of the higher viscosity of the MEG 25 wt % system.
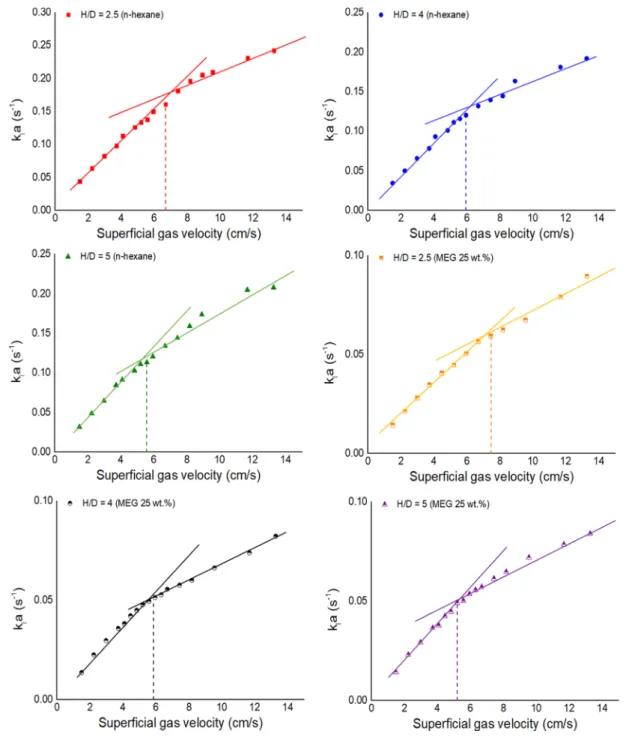
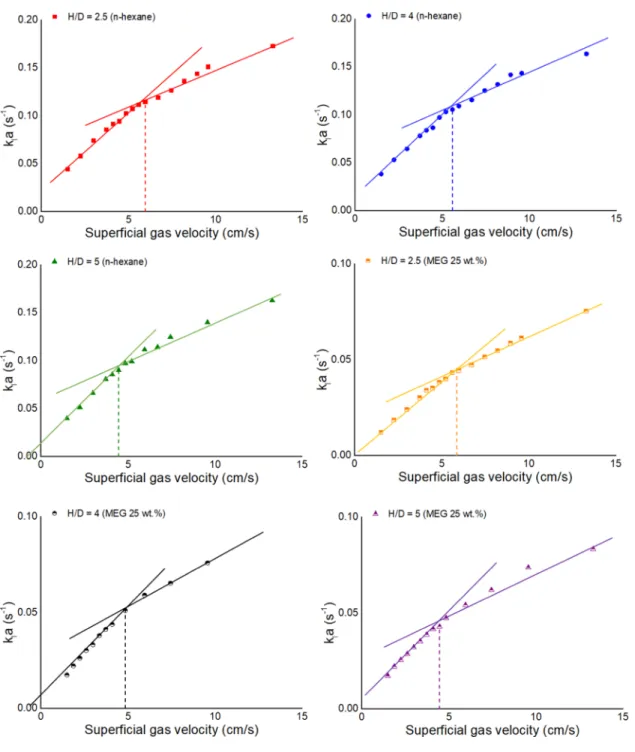
2.3. Volumetric Mass Transfer Coefficient (kla).
Detecting the change of the volumetric mass transfer coef-ficient is another way to determine the transitional superficial gas velocity. The result of kla is displayed inFigures 5−7. The determination of the overall transition regimes by the kla can be seen inFigure S1. The result was similar to that of the gas holdup case. The n-hexane system showed higher mass transfer coefficients than the system of MEG 25 wt % solution. Also,
the increasing liquid height decreased the transitional super-ficial gas velocity.
Regarding the experiments using n-hexane and helium, however, mass transfer was improved, although the static liquid height increased. The result using argon and nitrogen as a gas phase did not show this reverse tendency. The reason why the elevated static liquid height gave better mass transfer seems to be derived from the smaller density of helium. By taking a closer look at a force acting in the bubble, there is drag force (FD), body force (FB), pressure force (FP), virtual mass force (FVM), and lift force (FL).29 The following equations are detailed expressions of each force
ρ π = | − | − F 1C d v v v v 2 l 4 ( ) D D b 2 l b l b (1) = FB m gb (2)
Figure 5.Individual transition regime determined by kla with argon gas.
= − ∇ FP Vb p (3) ρ = − F V C Dv Dt Dv Dt VM l b VM l g i k jjjj y { zzzz (4) ρ = − × ∇ × FL lC V vL b( l vg) ( vl) (5)
where CD, CL, and CVMare coefficients of each force. A condition of the same superficial gas velocity and the same liquid was applied, and only the gas phase was varied. vl is negligible because vl is mainly affected by liquid property and vg.2929 The variation of pressure is governed by the axial position, and so FPis not greatly affected by changing the gas-phase component. Also, correlations in previous studies on bubble diameters did not consider gas properties of density and viscosity.30,31 If a bubble size is independent of the axial
position, the only variable parameters are vband mb. Thus, the change of FP, FVM, and FLis negligible. The FB of helium is significantly smaller than that of the other gases because of the low density of helium (argon: 1.661; helium: 0.16442; nitrogen: 1.1496 kg/m3at room temperature and atmospheric pressure). Average bubble rise velocity was investigated to examine the change of FD, and the result is illustrated in Figure 8. In the experiment using argon as a gas phase, the average bubble rise velocity for the entire column was higher at all superficial gas velocity conditions for the experiment using an H/D ratio of 5 (hatched block and white block in Figure 8a). Therefore, better mass transfer can be observed at lower static liquid height because a slower average bubble rise velocity induces more gas−liquid mass transfer opportunity.
For the experiment using helium as a gas phase, however, the static liquid height increase gave reduced average bubble
rise velocity (Figure 8b). This is the reason why the improved kla was observed even though the static height was expanded. Additional evidence of the mass transfer increase can be obtained by splitting measuring regions of average bubble rise velocity. For the argon experiment, the average bubble rise velocity in the range of 0−2.5 H/D axial position was lower than that in the range of 2.5−5 H/D axial position as the superficial gas velocity increased (see the black and gray blocks inFigure 8a). However, the average bubble rise velocity gradually decreased as the axial position increased for the helium experiment. This decrease in the average bubble rise velocity can increase the drag force in eq 1, which acts in the opposite direction of bubble rise. As a result, the different flow development tendency provides different mass transfer behaviors. With this overall perspective, the rise of static liquid heights may grow the kla when less dense gas is used.
2.4. Drift Flux. The drift flux method was introduced by Wallis to analyze flow hydraulics and physical properties of two-phase systems.21Drift flux can be given by the following equation
ε
= −
j u (1g g) (6)
The transitional superficial gas velocity can also be obtained by tracing the change in the slope of the gas holdup vs driftflux curve.13,23,32Results of the investigation using driftflux analysis are illustrated inFigures 9−11. The overall transition regime with different gas−liquid systems was displayed inFigure S2. The overall trend of the effect of static liquid height and different gas−liquid systems on the transitional superficial gas velocity was concurrent with the former selection of gas
Figure 7.Individual transition regime determined by kla with helium gas.
holdup because the drift flux analysis is based on the gas holdup ineq 6.
2.5. Pressure Standard Deviation. Another method for determining the transitional superficial gas velocity is to inves-tigate pressure fluctuations. There have been several studies using statistical analysis to identify the hydrodynamics of a bubble column.33−35 The main characteristic of a homoge-neousflow regime is the generation of a uniform bubble size at the gas sparger. Thus, there will be small pressurefluctuations at the lower point of the column. However, at a higher axial position, bubble size distribution will gradually become dis-ordered because a bubble has the possibility of coalescing with others during the bubble rise. Therefore, it can be inferred that the intensity of pressure fluctuation progressively increases along the rising axial position. However, in the heterogeneous flow regime, a clear difference compared to the homogeneous flow regime is the wide range of bubble size distribution through the whole column. Pressurefluctuations are independent of the axial position due to the release of large bubbles near the gas sparger and the eddies in the column. Hence, the investigation of pressure fluctuations can be utilized as another tool for finding the transitional superficial gas velocity.
Figure 12shows that the pressurefluctuation is measured by obtaining pressure standard deviations with different axial positions (H/D = 0.1, 1, 2.5, and 3.5). Another figure con-taining empirical data using argon and helium is shown in the Supporting Information (Figure S3). The left side of thefigure represents the homogeneousflow regime, and the other side represents the heterogeneousflow regime. The empirical data
of the pressure standard deviation showed an upward tendency as the axial position increased in the homogeneous regime. The transition regime began with the red lines inFigure 12a,c. No relationship between axial position and pressure standard deviation was observed in the graph representing heteroge-neousflow regime. Observation of the pressure standard devia-tion in the other gas−liquid systems, and all the empirical results in the above sections about the transitional superficial gas velocity are displayed in Table 1. Various gas−liquid systems showed different transitional superficial gas velocity. The empirical data with various methods for determining the transition regime showed that the transitional superficial gas velocity decreased with the rising static liquid height. There was no big difference between the transition regime velocities from the four different analysis methods. Drift flux and gas holdup have similar tendency because driftflux is a term com-bining superficial gas velocity with gas holdup. A big difference between gas holdup and liquid-side mass transfer coefficient is present with the bubble diameter. If a gas slug or gas cap is created in a bubble column, liquid-side mass transfer is signi-ficantly reduced, although gas holdup is not affected a lot.36
Because the gas slug or gas cap cannot be created in this work, the transitional superficial gas velocity was similar with the four different analysis methods. Thus, the average of the transition regime velocities was employed to propose a correlation of the transitional superficial gas velocity in the following section.
2.6. Correlation of the Transitional Superficial Gas Velocity. There have been a few studies concerned specifically with transitional superficial gas velocity, and each of their models was proposed to determine the transitional gas holdup and the small bubble velocity. By using the two parameters, the transitional superficial gas velocity could be obtained.26,27 In our experiment, the dispersed bubble diameter was small enough to be recognized as a small bubble near the superficial gas velocity of 0 m/s. Therefore, the average bubble rise velocity at this condition can be expressed as the small bubble velocity. The transitional superficial gas velocity, the gas holdup at the transition regime, and the small bubble velocity predicted by the previous models were displayed with our experi-mental data inFigure 13.26,27 The three calculated parameters appeared with a significant difference between the experiments and the model predictions. Thus, a new correlation was pro-posed, as described next.
The relation between the gas holdup and the superficial gas velocity was analyzed. Because a lot of previous literature expressed gas holdup as a power relationship with superficial gas velocity, the value of the exponent for gas holdup was considered.26,37,38
ε =g Auga (7)
It was found that exponent“a” was in the range of 0.7−1.2 for the homogeneousflow regime, and it was within 0.4−0.7 for the heterogeneous flow regime.39 In another study, 1.2 was used for the exponent in the homogeneous flow regime and 0.4 in the heterogeneousflow regime to provide a transition regime correlation.26 However, it was also reported that the value operating in the homogeneousflow regime was 0.58.40 Gandhi and Joshi collected all of the published 3374 data points over the past 45 years regarding the measurement of the gas holdup.
We also estimated the exponents by utilizing our 270 data points, as shown in Table 2. Because the column dimension may influence the gas−liquid flow up to the aspect ratio of 5,
Figure 8.Average rise velocity with respect to different axial positions (velocity measured position/static liquid height of experiments): (a) argon and (b) helium.
only the transitional superficial gas velocity measured at the aspect ratio of 5 was applied for developing a prediction model.9,41The average value of a was 0.8422 operating in the homogeneousflow regime and 0.557 operating in the hetero-geneousflow regime. The slope change at the transition regime can be well-defined between the gas holdup and the superficial gas velocity, as shown inFigures 2−4. Therefore, based on the experimental data, the correlation to estimate the gas holdup for each flow regime was established to find the transitional superficial gas velocity. Because gas and liquid viscosity, surface tension, and density have a considerable influence on the gas holdup, their properties were included as a parameter. The gas holdup prediction models for each regime were built by multi-ple regressions, as shown below.
In the homogeneous flow regime
εg=0.883ρg0.143ρl−0.0071μ−0.0012σ−0.276ug0.8422 (8)
In the heterogeneousflow regime
εg=1.04584ρg0.187ρl−0.187μ−0.0631σ−0.188ug0.557 (9)
The parity plot between the experimental and the estimated value is shown in Figure 14 to confirm the validity of both correlations. All of the data were within the range of 15% error. The intersection between the two gas holdup models for the homogeneous and the heterogeneousflow regimes can be the gas holdup at the transition regime. To simplify the equation, the model equation can be expressed as a power law model
ε =g Auga (10)
ε =g Bugb (11)
Because A, B, a, and b were known values ineqs 8and9, the intersection point can be easily expressed as
ε =A B − A ( )a a b g / (12) Figure 9.Individual transition regime determined by driftflux with argon gas.
= − B A u a b g 1/ i k jjj y{zzz (13)
Therefore, the equation to estimate the specific gas holdup and the superficial gas velocity values at each transition regime can be obtained
εg,trans=1.452ρg0.273ρl−0.536μ−0.184σ−0.0181 (14)
ρ ρ μ σ
= − −
ug,trans 1.803 g0.155 l 0.628 0.216 0.306 (15)
eqs 14and15were derived byeqs 8and9for the parameters having the following experimental ranges; ρg = 0.16442− 1.661 kg/m3, ρ
l = 655−1027.71 kg/m3, μ = 0.000326−
0.001289 Pa s, andσ = 0.0184−0.071 N/m. The comparison of experimental and correlated data is illustrated inFigure 15. Data from previous literature were compared with the cal-culated values from our proposed correlations.14,22,42,43 The new model revealed a good prediction capability for the gas−liquid
systems like water−air and 80 wt % MEG−air that are not tested in this work. The calculated values of superficial gas velocity and gas holdup at the transition regimefitted well with the empirical data. Therefore, the proper selection of the value of exponent a in superficial gas velocity gives a proper pre-diction of superficial gas velocity and gas holdup at the transi-tion point. Because this experiment was carried out at ambient conditions, the given correlations may not work for pressurized systems. More investigations in various conditions should be carried out to further improve the correlations.
3. CONCLUSIONS
This work was performed to accurately determine the transitional superficial gas velocity with several different gas− liquid systems. Several different methods employing gas holdup, volumetric liquid-phase mass transfer coefficient, drift flux, and pressure standard deviation showed similar results in the transitional superficial gas velocity. Increase in the static liquid
height can lower the transitional superficial gas velocity. However, in a lower gas density case such as with helium, it was observed that the increased static height caused a higher transitional superficial gas velocity. The relationship between gas holdup and superficial gas velocity was carefully observed to develop a new model based on the empirical result. After establishing a gas
holdup model for the homogeneous and heterogeneousflow
regimes, a new model to predict superficial gas velocity and gas holdup at the transition point was established. The established model displayed an overall error of less than 15% when compared to the empirical results of this work. By considering liquid and gas phase physical properties, the proposed model offers flexible prediction capability for various gas−liquid mass transfer systems.
4. METHODS
4.1. Bubble Column Setup. The detailed design of the bubble column experiment is illustrated in Figure 16. The transparent acrylic column had the inner diameter of 0.2 m and
height of 1.8 m. At the bottom of the column, a ring sparger with 54 holes with a size of 0.001 m in diameter was installed to provide a consistent distribution of the gas phase. The gas sparger was made of 3/8″ stainless steel pipe and has a
diameter of 0.12 m. A mass flow controller (MFC-Korea,
TSCD245, Korea) was used to provide the gas phase. The superficial gas velocity was set to more than 0.01 m/s to avoid gas weeping near the gas sparger. To cover both homogeneous and heterogeneousflow regimes, superficial gas velocities were varied up to 0.133 m/s. To detect a pressurefluctuation during the experiment, four pressure sensors (Sensys, PHPG 0003BCTG, Korea) that offered ±0.035% precision under the range of 0−3 bars were installed at different axial positions. During the experiment, dynamic massflow controller (MFC) signals were continuously recorded and delivered to the PC.
4.2. Measurement Method. For the liquid phase, mono-ethylene glycol (MEG) aqueous solutions and n-hexane were used. Because pure MEG has a high viscosity, 25 wt % MEG
Figure 11.Individual transition regime determined by driftflux with helium gas.
aqueous solution was employed. Each of helium, nitrogen, and argon was chosen as a gas phase to cover various gas densities. All experiments were carried out in batch mode and experi-mental condition was atmospheric pressure and room tem-perature. The liquid phase was filled before the experiment, and the gas phase was injected through the sparger by MFC. The void fraction of the gas holdup (εg) was calculated by the ratio of the aerated liquid height to the difference between the static and the aerated liquid heights.
The volumetric mass transfer coefficient (kla) was deter-mined by applying dynamic dissolved oxygen (DO) absorption and desorption method. There were already frequent refer-ences using a DO probe to obtain kla.44,45Ahead of the experi-ment, oxygen gas was sufficiently provided to achieve the
saturated condition to desorb the remaining gas in the liquid phase. After the complete replacement of the system gas by oxygen, the object gas was distributed, and the variation of DO in the system liquid was measured using a polarographic DO meter (Hanna Instruments, HI98193). The collected DO data were transferred to the PC, and the experimental kla was cal-culated by the following equation36,46,47
ε − + = * − * − k a t C C C C 1 const. ln l g i f (16)
Bubble velocity was measured by a stopwatch. Once a bubble was released above the sparger, exact time measurement began. The elapsed time was measured until the bubble passed the
Figure 12.Experimental pressure deviation on different gas−liquid systems (measured at 5 H/D axial position): (a, c) homogeneous flow regime and (b, d) heterogeneousflow regime.
Table 1. Transitional Superficial Gas Velocity Results with Different Detection Method under Variation of Static Liquid Height and Gas−Liquid Systema
detection method gas holdup kla driftflux pressure standard deviation
axial position H/D=2.5 H/D=4 H/D=5 H/D=2.5 H/D=4 H/D=5 H/D=2.5 H/D=4 H/D=5 H/D=2.5 H/D=4 H/D=5 MEG 25 wt % Solution He 4.83 3.72 3.72 4.83 3.72 2.97 4.83 3.72 3.36 4.83 3.72 2.97 N2 5.94 4.46 3.72 5.94 4.83 4.46 5.94 4.46 3.72 5.94 4.46 3.72 Ar 6.69 5.57 4.83 7.43 5.57 5.2 6.69 5.57 5.2 6.69 5.57 5.2 n-hexane He 4.83 4.08 4.08 4.08 3.72 4.83 4.83 4.83 4.08 4.09 3.72 2.97 N2 6.69 4.83 4.83 5.94 5.57 4.83 6.69 5.57 5.2 5.94 5.2 4.83 Ar 7.43 6.69 5.94 6.69 5.94 5.57 7.43 6.69 5.94 7.43 6.69 5.2 a⟨cm/s⟩.
specific destinations (axial position of H/D = 2.5 and 5). Because it is hard to differentiate which bubble is a measuring objective, thefirst released bubble after the column operation was observed. For the accuracy of the experiment, more than
10 bubble velocity measurements were made per each data point. After the experiment, the remaining gas in the sparger was slowly released. This condition was represented as a small
Figure 13.Comparison of transition regime parameters: (a) transi-tional superficial gas velocity; (b) gas holdup at transition point; and (c) small bubble velocity.
Table 2. Determined Values of the Exponent,a, in Power Law Relationship for Each Gas−Liquid System
gas−liquid system
homogeneousflow regime heterogeneousflow regime Ar−MEG 25 wt % 0.8547 0.5258 Ar−n-hexane 0.8639 0.5306 N2−MEG 25 wt % 0.7567 0.5982 N2−n-hexane 0.7909 0.57 He−MEG 25 wt % 0.9004 0.5847 He−n-hexane 0.8866 0.5298
Figure 14.Parity plot of experimental data and gas holdup estimated byeqs 8and9.
Figure 15. Comparison between experimental and calculated transitional superficial gas velocity (estimated byeq 15).
Figure 16.Schematic diagram of the bubble column.
bubble velocity at 0 m/s superficial gas velocity. For the pres-sure deviation analysis, the dynamic prespres-sure during the experi-ment was recorded and analyzed by the connected PC.
■
ASSOCIATED CONTENT*
S Supporting InformationThe Supporting Information is available free of charge on the ACS Publications websiteat DOI:10.1021/acsomega.8b02657.
Overall view of regime transition using gas holdup and kla in different gas−liquid systems; experimental pressure deviations on different gas−liquid systems (PDF)
■
AUTHOR INFORMATION Corresponding Author *E-mail:[email protected]. ORCID Jae W. Lee:0000-0002-8756-0195 NotesThe authors declare no competingfinancial interest.
■
ACKNOWLEDGMENTSThe authors are grateful for thefinancial supports from both the Hanwha Chemical R&D Institute through the KAIST-Hanwha Future Technology R&D Center and the Advanced Biomass R&D Center (ABC) as the Global Frontier Project funded by the Ministry of Science, ICT, and Future Planning, South Korea (ABC-2010-0029728).
■
NOMENCLATURECf,final gas concentration, kg/m3 Ci, initial gas concentration, kg/m3
C*, concentration of gas at saturation, kg/m3 D, column diameter, m d, bubble diameter, m g, gravity acceleration, m/s2 j, driftflux, m/s F, force, N H, column height, m
kla, volumetric liquid-phase mass transfer coefficient, s−1 m, mass, kg
p, pressure, Pa t, time, s
u, superficial gas velocity, m/s v, velocity, m/s V, volume, m3 Greek Letters εg, gas holdup μ, liquid viscosity, Pa s ρ, density, kg/m3 σ, surface tension, N/m Subscripts B, body b, bubble D, drag g, gas L, lift l, liquid P, pressure sb, small bubble trans, transition regime VM, virtual mass
Abbreviations
MEG, monoethylene glycol MFC, massflow controller DO, dissolved oxygen
■
REFERENCES(1) Kang, D.; Lee, K.; Lee, J. W. Feasibility evaluation of quinary heterogeneous reactive extractive distillation. Ind. Eng. Chem. Res. 2014, 53, 12387−12398.
(2) Chaudhari, R. V.; Mills, P. L. Multiphase catalysis and reaction engineering for emerging pharmaceutical processes. Chem. Eng. Sci. 2004, 59, 5337−5344.
(3) Yang, J. H.; Hur, Y. G.; Lee, H.-T.; Yang, J.-I.; Kim, H.-J.; Chun, D. H.; Park, J. C.; Jung, H.; Park, S. B. Interaction between partitioning porous plate and rising bubbles in a trayed bubble column. Chem. Eng. Res. Des. 2012, 90, 1457−1466.
(4) Elbing, B. R.; Still, A. L.; Ghajar, A. J. Review of bubble column reactors with vibration. Ind. Eng. Chem. Res. 2016, 55, 385−403.
(5) Lee, S. H.; Park, S. T.; Lee, R.; Hwang, J. H.; Sohn, J. M. Water gas shift reaction in a catalytic bubbling fluidized bed reactor. Korean J. Chem. Eng. 2016, 33, 3523−3528.
(6) Yi, M.; Lee, J. W. Efficient in situ drying of low rank coal in a pressurized down-flow flash dryer. Korean J. Chem. Eng. 2016, 33, 3401−3406.
(7) Guan, X.; Yang, N.; Li, Z.; Wang, L.; Cheng, Y.; Li, X. Experimental investigation of flow development in large-scale bubble columns in the churn-turbulent regime. Ind. Eng. Chem. Res. 2016, 55, 3125−3130.
(8) Majumder, S. K. Hydrodynamics and Transport Processes of Inverse Bubbly Flow, 1st ed.; Elsevier, 2016; pp 1−462.
(9) Zahradník, J.; Fialova, M.; Ru, M.; Drahos, J.; Kastanek, F.; Thomas, N. H. Duality of the gas-liquid flow regimes in bubble column reactors. Chem. Eng. Sci. 1997, 52, 3811−3826.
(10) Besagni, G.; Inzoli, F.; Ziegenhein, T.; Lucas, D. Computational Fluid-Dynamic modeling of the pseudo-homogeneous flow regime in large-scale bubble columns. Chem. Eng. Sci. 2017, 160, 144−160.
(11) Guédon, G. R.; Besagni, G.; Inzoli, F. Prediction of gas−liquid flow in an annular gap bubble column using a bi-dispersed Eulerian model. Chem. Eng. Sci. 2017, 161, 138−150.
(12) Thorat, B. N.; Joshi, J. B. Regime transition in bubble columns: experimental and predictions. Exp. Therm. Fluid Sci. 2004, 28, 423− 430.
(13) Ruzicka, M. C.; Drahoš, J.; Fialova, M.; Thomas, N. H. Effect of bubble column dimensions on flow regime transition. Chem. Eng. Sci. 2001, 56, 6117−6124.
(14) Besagni, G.; Inzoli, F. The effect of liquid phase properties on bubble column fluid dynamics: Gas holdup, flow regime transition, bubble size distributions and shapes, interfacial areas and foaming phenomena. Chem. Eng. Sci. 2017, 170, 270−296.
(15) Besagni, G.; Di Pasquali, A.; Gallazzini, L.; Gottardi, E.; Colombo, L. P. M.; Inzoli, F. The effect of aspect ratio in counter-current gas-liquid bubble columns: Experimental results and gas holdup correlations. Int. J. Multiphase Flow 2017, 94, 53−78.
(16) Sasaki, S.; Uchida, K.; Hayashi, K.; Tomiyama, A. Effects of column diameter and liquid height on gas holdup in air-water bubble columns. Exp. Therm. Fluid Sci. 2017, 82, 359−366.
(17) Krishna, R.; De Swart, J. W. A.; Hennephof, D. E.; Ellenberger, J.; Hoefsloot, H. C. J. Influence of increased gas density on hydrodynamics of bubble-column reactors. AlChE J. 1994, 40, 112− 119.
(18) Pino, L. Z.; Solari, R. B.; Siquier, S.; Antonio Estevez, L.; Yepez, M. M.; Saez, A. E. Effect of operating conditions on gas holdup in slurry bubble columns with a foaming liquid. Chem. Eng. Commun. 1992, 117, 367−382.
(19) Ruzicka, M. C.; Drahoš, J.; Mena, P. C.; Teixeira, J. A. Effect of viscosity on homogeneous−heterogeneous flow regime transition in bubble columns. Chem. Eng. J. 2003, 96, 15−22.
(20) Sarrafi, A.; Müller-Steinhagen, H.; Smith, J. M.; Jamialahmadi, M. Gas holdup in homogeneous and heterogeneous gasliquid bubble column reactors. Can. J. Chem. Eng. 1999, 77, 11−21.
(21) Wallis, G. B. One Dimensional Two Phase Flow, 1st ed.; McGraw-Hill: New York, 1969; pp 1−431.
(22) Letzel, H. M.; Schouten, J. C.; Krishna, R.; Van den Bleek, C. M. Characterization of regimes and regime transitions in bubble columns by chaos analysis of pressure signals. Chem. Eng. Sci. 1997, 52, 4447−4459.
(23) Gourich, B.; Vial, C.; Essadki, A. H.; Allam, F.; Soulami, M. B.; Ziyad, M. Identification of flow regimes and transition points in a bubble column through analysis of differential pressure signal influence of the coalescence behavior of the liquid phase. Chem. Eng. Process. 2006, 45, 214−223.
(24) Vial, C.; Camarasa, E.; Poncin, S.; Wild, G.; Midoux, N.; Bouillard, J. Study of hydrodynamic behaviour in bubble columns and external loop airlift reactors through analysis of pressure fluctuations. Chem. Eng. Sci. 2000, 55, 2957−2973.
(25) Briens, C. L.; Briens, L. A.; Hay, J.; Hudson, C.; Margaritis, A. Hurst’s analysis to detect minimum fluidization and gas maldis-tribution in fluidized beds. AlChE J. 1997, 43, 1904−1908.
(26) Reilly, I. G.; Scott, D. S.; Debruijn, T. J. W.; MacIntyre, D. The role of gas phase momentum in determining gas holdup and hydrodynamic flow regimes in bubble column operations. Can. J. Chem. Eng. 1994, 72, 3−12.
(27) Wilkinson, P. M.; Spek, A. P.; van Dierendonck, L. L. Design parameters estimation for scale-up of high-pressure bubble columns. AlChE J. 1992, 38, 544−554.
(28) Jamialahmadi, M.; Müller-Steinhagen, H.; Sarrafi, A.; Smith, J. M. Studies of gas holdup in bubble column reactors. Chem. Eng. Technol. 2000, 23, 919−921.
(29) Simonnet, M.; Gentric, C.; Olmos, E.; Midoux, N. CFD simulation of the flow field in a bubble column reactor: Importance of the drag force formulation to describe regime transitions. Chem. Eng. Process. 2008, 47, 1726−1737.
(30) Pohorecki, R.; Moniuk, W.; Bielski, P.; Sobieszuk, P. Diameter of bubbles in bubble column reactors operating with organic liquids. Chem. Eng. Res. Des. 2005, 83, 827−832.
(31) Kumar, A.; Degaleesan, T. E.; Laddha, G. S.; Hoelscher, H. E. Bubble swarm characteristics in bubble columns. Can. J. Chem. Eng. 1976, 54, 503−508.
(32) Tarmy, B.; Chang, M.; Coulaloglou, C.; Ponzi, P. Hydro-dynamic characteristics of three phase reactors. Chem. Eng. 1984, 407, 18−23.
(33) Esmaeili, A.; Guy, C.; Chaouki, J. The effects of liquid phase rheology on the hydrodynamics of a gas−liquid bubble column reactor. Chem. Eng. Sci. 2015, 129, 193−207.
(34) Johnsson, F.; Zijerveld, R. C.; Schouten, J. C.; Van den Bleek, C. M.; Leckner, B. Characterization of fluidization regimes by time-series analysis of pressure fluctuations. Int. J. Multiphase Flow 2000, 26, 663−715.
(35) Barghi, S.; Prakash, A.; Margaritis, A.; Bergougnou, M. A. Flow regime identification in a slurry bubble column from gas holdup and pressure fluctuations analysis. Can. J. Chem. Eng. 2004, 82, 865−870. (36) Im, H.; Lee, S.; Lee, J. W. Enhanced mass transfer from the installation of a sieve tray subject to the variation of liquid heights and flow regimes in a bubble column. Chem. Eng. Res. Des. 2018, 136, 654−662.
(37) Hikita, H.; Kikukawa, H. Liquid-phase mixing in bubble columns: Effect of liquid properties. Chem. Eng. J. 1974, 8, 191−197. (38) Kelkar, B. G.; Phulgaonkar, S. R.; Shah, Y. T. The effect of electrolyte solutions on hydrodynamic and backmixing characteristics in bubble columnns. Chem. Eng. J. 1983, 27, 125−133.
(39) Shah, Y. T.; Kelkar, B. G.; Godbole, S. P.; Deckwer, W. D. Design parameters estimations for bubble column reactors. AlChE J. 1982, 28, 353−379.
(40) Gandhi, A. B.; Joshi, J. B. Unified correlation for overall gas hold-up in bubble column reactors for various gas-liquid systems
using hybrid genetic algorithm-support vector regression technique. Can. J. Chem. Eng. 2010, 88, 758−776.
(41) Bouaifi, M.; Hebrard, G.; Bastoul, D.; Roustan, M. A comparative study of gas hold-up, bubble size, interfacial area and mass transfer coefficients in stirred gas−liquid reactors and bubble columns. Chem. Eng. Process. 2001, 40, 97−111.
(42) Krishna, R.; Wilkinson, P. M.; Van Dierendonck, L. L. A model for gas holdup in bubble columns incorporating the influence of gas density on flow regime transitions. Chem. Eng. Sci. 1991, 46, 2491− 2496.
(43) Koide, K.; Morooka, S.; Ueyama, K.; Matsuura, A.; Yamashita, F.; Iwamoto, S.; Kato, Y.; Inoue, H.; Shigeta, M.; Suzuki, S.; Akehata, T. Behavior of bubbles in large scale bubble column. J. Chem. Eng. Jpn. 1979, 12, 98−104.
(44) Grund, G.; Schumpe, A.; Deckwer, W.-D. Gas-liquid mass transfer in a bubble column with organic liquids. Chem. Eng. Sci. 1992, 47, 3509−3516.
(45) Popovic, M. K.; Robinson, C. W. Mass transfer studies of external-loop airlifts and a bubble column. AlChE J. 1989, 35, 393− 405.
(46) Akita, K.; Yoshida, F. Gas holdup and volumetric mass transfer coefficient in bubble columns. Ind. Eng. Chem. Process Des. Dev. 1973, 12, 76−80.
(47) Park, J.; Lee, S.; Lee, J. W. Effect of pH and concentrated salt on the droplet size and mass transfer coefficient in a stirred liquid− liquid reactor. Ind. Eng. Chem. Res. 2018, 57, 2310−2321.