저작자표시-비영리-변경금지 2.0 대한민국 이용자는 아래의 조건을 따르는 경우에 한하여 자유롭게 l 이 저작물을 복제, 배포, 전송, 전시, 공연 및 방송할 수 있습니다. 다음과 같은 조건을 따라야 합니다: l 귀하는, 이 저작물의 재이용이나 배포의 경우, 이 저작물에 적용된 이용허락조건 을 명확하게 나타내어야 합니다. l 저작권자로부터 별도의 허가를 받으면 이러한 조건들은 적용되지 않습니다. 저작권법에 따른 이용자의 권리는 위의 내용에 의하여 영향을 받지 않습니다. 이것은 이용허락규약(Legal Code)을 이해하기 쉽게 요약한 것입니다. Disclaimer 저작자표시. 귀하는 원저작자를 표시하여야 합니다. 비영리. 귀하는 이 저작물을 영리 목적으로 이용할 수 없습니다. 변경금지. 귀하는 이 저작물을 개작, 변형 또는 가공할 수 없습니다.
Non-Contrast-Enhanced High-Resolution
Susceptibility-Weighted Image in Semiquantitative
Assessment of Glioma Vascularity at 3T:
Comparison with MR perfusion imaging
by
Mee Jin Park
Major in Medicine
Department of Medical Sciences
The Graduate School, Ajou University
Non-Contrast-Enhanced High-Resolution
Susceptibility-Weighted Image in Semiquantitative
Assessment of Glioma Vascularity at 3T:
Comparison with MR perfusion imaging
by
Mee jin Park
A Dissertation Submitted to The Graduate School of Ajou University
in Partial Fulfillment of the Requirements for the Degree of
Master of Medical Sciences
Supervised by
Sun Yong Kim, M.D.
Department of Medical Sciences
The Graduate School, Ajou University
This certifies that the dissertation
of Mee Jin Park is approved.
SUPERVISORY COMMITTEE
Sun Yong Kim
Je Hwan Won
Jai Keun Kim
The Graduate School, Ajou University
December, 21st, 2009
i
-ABSTRACT-
Non-Contrast-Enhanced High-Resolution Susceptibility-Weighted
Image in Semiquantitative Assessment of Glioma Vascularity at
3T: Comparison with MR Perfusion Imaging
To test the hypothesis that intra-tumoral susceptibility signal (ITSS) on high-resolution susceptibility-weighted image (HR-SWI) can reflect glioma vascularity and compare its diagnostic accuracy for glioma grading with that of dynamic susceptibility contrast (DSC) MR perfusion.
Forty-one patients with diffuse astrocytomas, underwent both non-contrast-enhanced HR-SWI and DSC-MR perfusion imaging at 3T. We correlated the degree and morphology of ITSSs in the tumor region with maximal relative cerebral blood volume (rCBVmax). The degree of ITSSs and rCBVmax were compared between three groups
with different histopathologicgrades. Spearman correlation coefficients were determined
between ITSS degrees, rCBVmax, and glioma grades. Receiver operating characteristic
(ROC) curve analyses were performed to determine optimum threshold values and
diagnostic accuracy for gioma grading.
There was a significant linear correlationbetween the degree of ITSSs and maximal
rCBV values in the tumor region of interest(r = 0.72; P < .0001). Degree of ITSS was
significantly different for all three grades(P <.005). Spearman correlation coefficients
between ITSS degree and glioma grade was 0.88 (95% confidence interval = 0.79 – 0.94). In the ROC curve analysis of histopathologic correlation by using ITSS degree, the
optimal sensitivity, specificity, positive predictive value, and negative predictive value for determining a high grade tumor were 85.2%, 92.9%, 95.8%, and 76.5%, respectively.
The semiquantitative assessment of glioma vascularity using non-contrast-enhanced HR-SWI shows significant correlation with rCBVmax, and its specificity and positive predictive value for glioma grading are higher than those of DSC MR perfusion.
Keywords: Susceptibility-weighted image, glioma, vascularity, MR, perfusion
iii
TABLE OF CONTENTS
ABSTRACT ··· i
TABLE OF CONTENTS ··· iii
LIST OF FIQURES ··· iv
LIST OF TABLES ··· v
. Ⅰ INTRODUCTION ··· 1
. Ⅱ MATERIALS AND METHODS ··· 3
A. Study patients ··· 3 B. MR Imaging Protocol ··· 3 C. Image Analysis ··· 4 D. Statistical Analysis ··· 6 III. RESULTS ··· 9 IV. DISCUSSION ··· 18 V. CONCLUSION ··· 22 REFERENCES ··· 23 국문요약 ··· 27
LIST OF FIGURES
Fig. 1. The morphology of intra-tumoral susceptibility signals. ··· 8
Fig. 2. MR images of a 49-year-old woman with left temporal glioblastoma multiforme. ··· 11
Fig. 3. MR images of a 55-year-old man with glioblastoma multiforme. ··· 12
Fig. 4. Scatterplot showing the correlation between the degree of ITSS and maximum rCBV ··· 14
Fig. 5. Receiver operating characteristic (ROC) curve analysis of the degree of ITSS (A) and maximum rCBV (B) for correctly identifying high-grade glioma (WHO grade
v
LIST OF TABLES
Table 1. Sensitivity, specificity, positive predictive value, and negative predictive Value of ITSS degree for differentiating between WHO grade II, III, and
IV gliomas. ··· 16
Table 2. Sensitivity, specificity, positive predictive value, and negative predictive value of maximum rCBV for differentiating between WHO grade II, III, and IV gliomas. ··· 16
Table 3. Sensitivity, specificity, positive predictive value, and negative predictive value Of ITSS degree for determining high grade glioma (WHO grade III
and IV) according to threshold values. ··· 17
Table 4. Sensitivity, specificity, positive predictive value, and negative predictive value of maximum rCBV for determining high grade glioma (WHO grade III and IV) according to threshold values. ··· 17
I. INTRODUCTION
High-resolution susceptibility-weighted image (HR-SWI) has been reported recently to demonstrate magnetic susceptibility differences of various tissues, which use blood oxygenation level-dependent (BOLD) induced phase difference between venous blood and surrounding brain parenchyma (Reichenbach et al.,1998; Reichenbach et al.,2001; Reichenbach et al.,2001). HR-SWI can increase the sensitivity to susceptibility effect of micro-venous structure and blood products. Therefore, this novel imaging technique can be used in noninvasive visualization of normal or pathologic vascular structures which are not visible in conventional MR imaging (Sehgal et al.,2005).
So far, HR-SWI has mainly been used in assessment of various vascular and hemorrhagic brain disorders such as arteriovenous malformation, occult low-flow vascular lesion, and cavernous malformation (de Souza et al.,2008; Lee et al.,1999; Sehgal et al.,2005). The clinical application of this novel technique at 1.5 T MR scanner, however, has been limited by long acquisition time related to relatively long echo time (TE) which is required for BOLD induced phase effect. This long acquisition time can lead to motion artifact and the use of HR-SWI at 1.5T can be time-consuming in routine MR imaging protocol. Recently, the development of 3T MR scanner and parallel imaging technique made it possible to increase the speed, coverage, and signal to noise ratio of MR image. Therefore, this novel technique is now suitable for examination of patients with various brain disorders to obtain both high spatial resolution and reasonable acquisition time. Moreover, HR-SWI can provide many additional informations compared with
- 2 -
conventional gradient echo image.
In glioma, angiogenesis has been shown to be associated with tumoral viability and aggressiveness. Currently dynamic susceptibility contrast (DSC) perfusion MR imaging provides information about neovascularity and angiogenesis in glioma (Law et al.,2003; Law et al.,2004; Lev et al.,2004). Relative cerebral blood volume (rCBV) and vascular
permeability measurements (Ktrans) correlate significantly with glioma grading, as
determined by histopathology (Lev et al.,2004; Law et al.,2003; Law et al.,2004). Since the intra-tumoral susceptibility signal (ITSS) on HR-SWI correlated with tumor grade as determined by PET study and histopathology (Barth et al.,2003; Daumas-Duport et al.,2000; Pinker et al.,2007). This imaging technique seems to be a promising tool for noninvasive glioma grading.
In the present study, we tested the hypothesis that ITSS on HR-SWI can reflect glioma vascularity and compared the diagnostic accuracy for glioma grading between HR-SWI and DSC MR perfusion.
II. MATERIALS AND METHODS
A. Study Patients
Forty-one consecutive patients with histologically proven diffuse astrocytomas were enrolled in this study. All study patients underwent both HR-SWI and DSC MR perfusion imaging as well as conventional MR imaging before surgical biopsy and/or resection. There were 19 male and 22 female patients, and patients’ ages ranged from 19 to 70 years
witha mean of 47 years. An experienced neuropathologist performed the histopathologic
evaluation. Pathologic specimens had been obtained by means of either stereotactic
resection (n = 29) or stereotactically guided biopsy (n = 12) and were classified in
accordance with the revised World Health Organization (WHO) system of brain tumors.12
The Institutional Review Board approved our study, and informed consents were obtained from all patients or members of their families.
B. MR Imaging Protocol
MR imaging was performed using a 3 T MR scanner (Achieva; Philips Medical
Systems, Best, The Netherlands) with 8-channel sensitivity encoding (SENSE) head coil. Standard MR imaging included the following sequences: axial fast spin-echo T2-weighted
imaging (TR/TE = 3000/80 ms), axial spin-echo T1-weightedimaging (TR/TE = 495/10
ms), and enhanced axial and coronal T1-weighted imaging. The contrast-enhanced axial and coronal T1-weighted sequences were performed after administering
0.1 mmol/kg of gadolinium dimeglumine (Magnevist®) per kg body weight.
- 4 -
al.,2004; Lee et al.,1999; Rauscher et al.,2004; Sehgal et al.,2005). The detail imaging parameters for HR-SWI were as follows: Flow-compensated 3 dimensional gradient echo
sequence,TR/TE: 24 ms/34 ms, flip angle: 10°, field of view: 200 x 200 mm, matrix: 332
x 332, section thickness: 3mm, slab thickness: 135 mm, total acquisition time: 4 minutes
2 seconds.
DSC MR perfusion imaging was performed with a gradient-echo echo-planar sequences
during the administration of standarddose of 0.1 mmol/kg of gadolinium dimeglumine
(Magnevist; Schering, Berlin, Germany) per kg body weight at a rate of 4ml/sec with an
MR-compatible power injector (Spectris; Medrad, Pittsburgh,Pa). The bolus of contrast
material was followed by 20 ml bolusof saline that was administered at the same injection
rate. The detailed imaging parameters for DSC MR perfusion were as follows: TR = 1407 ms, TE = 40 ms, flip angle = 35°, field of view = 24 cm, and matrix = 128 × 128. Total acquisition time for DSC MR perfusion imaging was 1 minutes and 30 seconds. DSC MR
perfusion imaging was performed by using the same sectionorientations and coverage as
used for conventional MR imaging and HR-SWI. All imaging data were transferred from
the scanners to an independentPC for quantitative analysis. Perfusion parametric maps
were obtained by using a dedicated software package (NordicICE; Nordic Imaging Lab).
The arterial input function was determinedfrom the M2 segment of middle cerebral artery.
After eliminating recirculation of contrast agent with gamma-variatecurve fitting, the
relative CBV was computed by means of a numericintegration of the curve.
C. Image Analysis
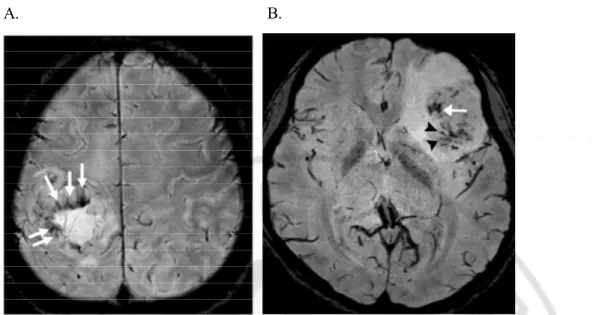
by two experienced radiologists. Intra-tumoral calcifications or hemorrhages, which could cause ITSSs on HR-SWI, were excluded on conventional MR images, including gradient echo images. ITSSs were defined as low-signal, tubular or dot-like structures, with or without conglomeration, seen within the tumor on HR-SWI. We assessed the presence or absence of ITSSs in each tumor and compared the incidence of ITSSs between high- and low-grade gliomas. We also determined the specific morphology of the ITSS and reached a consensus as to which was predominantly seen in each high- or low-grade glioma. The morphology of the ITSS was classified into three categories: conglomerated dots, conglomerated tubular, and mixed dots and tubular (Fig. 1).
For the quantitative analysis, the degree of ITSS was divided into four grades: grade 0, no ITSS; grade 1, 1-5 dot-like or tubular ITSSs; grade 2, 6-10 dot-like or tubular ITSSs; and grade 3, more than 11 dot-like or tubular ITSSs in the continuous area within a tumor. The quantification of rCBV was performed within the corresponding area with the region of ITSS degree measurements. Four separate regions-of-interest (ROIs) were designated in the region of maximal abnormalities, as determined visually on the rCBV map. The maximum value of rCBV among the four ROIs was recorded. To minimize intra-observer variability in the ROI analysis, two radiologists consensually targeted the ROIs to the
maximalabnormalities, and the size was kept constant (diameter, 1.5 mm). This maximum
value of the ROI analysis has been reported to provide the highestintra-observer and
inter-observer reproducibility in MR perfusionmeasurements (Wetzel et al.,2002). The
ratio of the maximum rCBV (rCBVmax) was calculated using the ROI values of the contralateral normal-appearing white matter of the centrum semiovale.
- 6 -
We assessed the level of inter-observer variability for the degree of ITSS and rCBVmax measurements and calculated the correlation coefficient between the degree of ITSS and the rCBVmax obtained from DSC MR perfusion imaging. The degree of ITSS and rCBVmax were compared between grades II, III, and IV, and the correlation coefficients between the ITSS degree, rCBVmax, and glioma grade were determined. Finally, the sensitivity, specificity, positive predictive value (PPV), and negative predictive value (NPV) of HR-SWI were calculated for the correct identification of high-grade (high-grade III and high-grade IV) and low-high-grade (high-grade II) gliomas. The sensitivity and specificity, with 95% confidence limits, were estimated using standard statistical formulas and were based on the consensus data from the quantitative measures.
D. Statistical Analysis
Intraclass correlation coefficient (ICC) was used to determine the levels of
interobserver variability in quantitative analysis of ITSS on HR-SWI and MR perfusion parameters. Analysis of variance (ANOVA) and Kruskal-Wallis test were performed to compare the mean ITSS degree and rCBVmax between three groups with different
histopathologic grade. Spearman correlation coefficients were used to show the
relationships between the degree of ITSS, rCBVmax, and histopathologic grade.Receiver
operator characteristic (ROC) curve analyses were performed to determine optimum
thresholds and diagnostic accuracy of HR-SWI and DSC MR perfusion for determining
high grade tumor. This analysis permitted the determination of the sensitivity,specificity,
PPV, and NPV associated with each parameter of HR-SWI and DSC MR perfusion asa
analyzed the ROC curve using the MedCalc statistical package (MedCalc Software,
Mariakerke, Belgium).The areas under the ROC curves (AUC) were compared between
theHR-SWI and DSC MR perfusion parameters. All P values were 2-tailed with .05 as
- 8 -
A. B.
Fig. 1. The morphology of intra-tumoral susceptibility signals. A. Conglomerated tubular
III. RESULTS
Of the 41 tumors, twelve were low-gradeastrocytomas (WHO grade II), seven were
anaplastic astrocytomas (WHO grade III), and twenty-two were glioblastoma multiforme (WHO grade IV).
In the qualitative analysis, ITSSs were demonstrated in all glioblastomas (WHO grade IV). On HR-SWI, these ITSSs were usually located in the inner portion of the contrast-enhancing rim on contrast-enhanced T1-weighted images, and the ITSSs were located in the region of visually maximal rCBV on DSC MR perfusion images. Regarding the morphology of the ITSSs, conglomerated mixed tubular and dot-like ITSSs were most frequent in high-grade gliomas and matched with the region of the qualitatively maximal rCBV shown in (Fig. 2). The conglomerated tubular morphology also matched the region of the visually maximal rCBV shown in (Fig. 3).
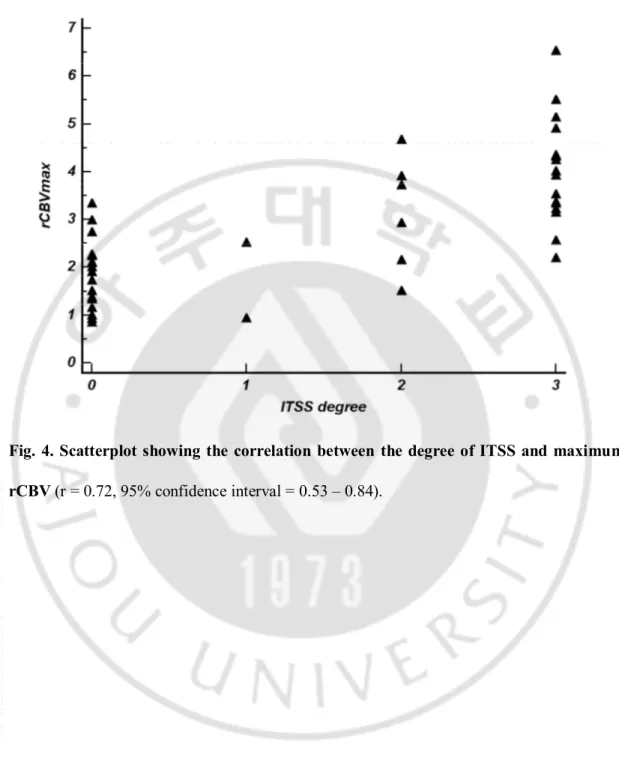
In the quantitative analysis, inter-observer agreement for the degree of ITSS and the values of MR perfusion parameters was excellent (ICC = 0.82-0.93). There was a significant linear correlation between the degree of ITSS and the rCBVmax value in the
tumor region of interest(r = 0.72; P < 0.0001; Fig. 4). The Kruskal-Wallis test showed
that the degree of ITSS was significantly different among all three grades(P < 0.005).
Tables 1 and 2 shows the sensitivity, specificity, PPV, and NPV of ITSS degree and
rCBVmax for differentiating between three groups with different histopathologicgrade.
The Spearman correlation coefficient between the degree of ITSS and the glioma grade was 0.88 (95% confidence interval = 0.79 - 0.94). In the ROC curve analysis with
- 10 -
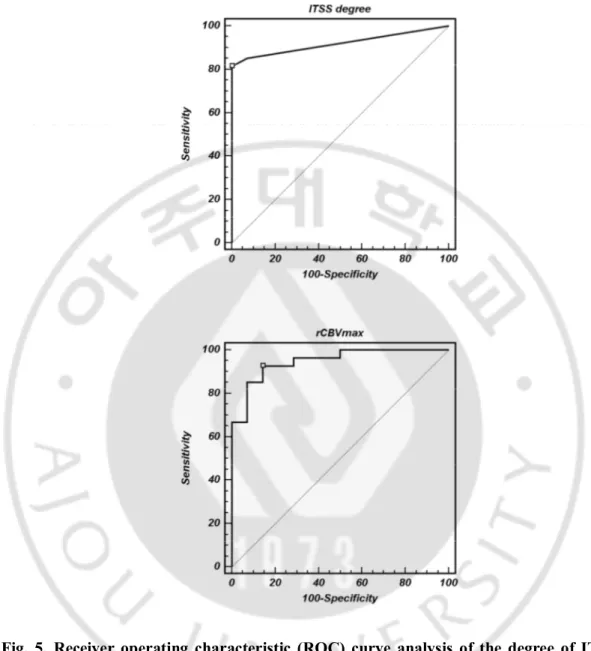
histopathologic correlation, optimal sensitivity, specificity, PPV, and NPV to determine a high grade glioma by using the ITSS degree and rCBVmax were 85.2%, 92.9%, 95.8%, and 76.5% and 92.6%, 85.7%, 92.6%, and 85.7%, respectively (Tables 3 and 4; Fig. 5).
A. B.
C. D.
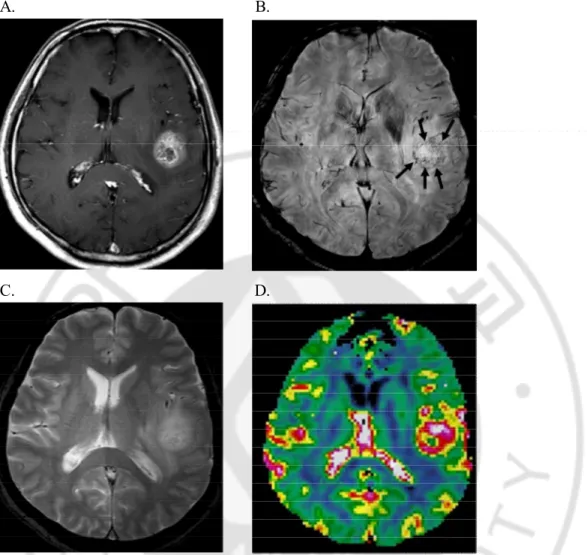
Fig. 2. MR images of a 49-year-old woman with left temporal glioblastoma multiforme.
The contrast-enhanced axial T1-weighted image (A) shows a mass with peripheral rim enhancement. HR-SWI (B) demonstrates multiple dot-like intra-tumoral susceptibility signals (ITSSs; arrows) in the area with the peripherally enhanced solid portion in the contrast-enhanced T1-weighted image. The ITSSs are not obvious on conventional gradient echo images (C). The rCBV map (D) shows elevated rCBV in the region of the ITSSs seen on the HR-SWI.
- 12 - A. B. C. D. E.
Fig. 3. MR images of a 55-year-old man with glioblastoma multiforme. The
contrast-enhanced axial T1-weighted image (A) shows a mass with irregular peripheral rim enhancement in the right parietal lobe. HR-SWI (B) reveals conglomerated tubular intra-tumoral susceptibility signals (ITSSs) just in the inner portion of the enhancing rim on the contrast-enhanced T1-weighted image. On the corresponding rCBV map (C), the region with the maximum rCBV matches the ITSSs and is located in the outer portion of the ITSSs. The region with the ITSSs also matches the area of T2 shortening on the R2 (D) and T2 (E) relaxation maps
- 14 -
Fig. 4. Scatterplot showing the correlation between the degree of ITSS and maximum rCBV (r = 0.72, 95% confidence interval = 0.53 – 0.84).
Fig. 5. Receiver operating characteristic (ROC) curve analysis of the degree of ITSS and maximum rCBV for correctly identifying high-grade glioma (WHO grade III and IV). The area underthe ROC curve for the degree of ITSS is 0.92 (95% confidence interval = 0.79 – 0.98) and that for the maximum rCBV is 0.95 (95% confidence interval = 0.83 – 0.99).
- 16 -
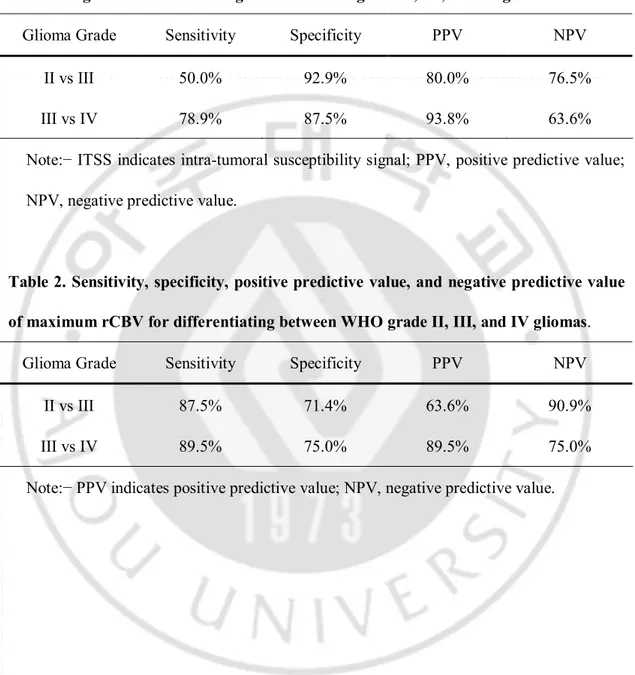
Table 1. Sensitivity, specificity, positive predictive value, and negative predictive value of ITSS degree for differentiating between WHO grade II, III, and IV gliomas.
Glioma Grade Sensitivity Specificity PPV NPV
II vs III 50.0% 92.9% 80.0% 76.5%
III vs IV 78.9% 87.5% 93.8% 63.6%
Note:− ITSS indicates intra-tumoral susceptibility signal; PPV, positive predictive value; NPV, negative predictive value.
Table 2. Sensitivity, specificity, positive predictive value, and negative predictive value of maximum rCBV for differentiating between WHO grade II, III, and IV gliomas.
Glioma Grade Sensitivity Specificity PPV NPV
II vs III 87.5% 71.4% 63.6% 90.9%
III vs IV 89.5% 75.0% 89.5% 75.0%
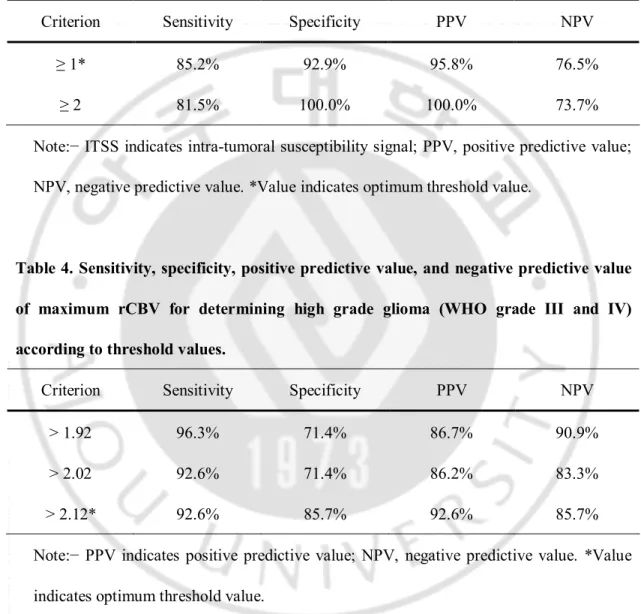
Table 3. Sensitivity, specificity, positive predictive value, and negative predictive value of ITSS degree for determining high grade glioma (WHO grade III and IV) according to threshold values.
Criterion Sensitivity Specificity PPV NPV
≥ 1* 85.2% 92.9% 95.8% 76.5%
≥ 2 81.5% 100.0% 100.0% 73.7%
Note:− ITSS indicates intra-tumoral susceptibility signal; PPV, positive predictive value; NPV, negative predictive value. *Value indicates optimum threshold value.
Table 4. Sensitivity, specificity, positive predictive value, and negative predictive value of maximum rCBV for determining high grade glioma (WHO grade III and IV) according to threshold values.
Criterion Sensitivity Specificity PPV NPV
> 1.92 96.3% 71.4% 86.7% 90.9%
> 2.02 92.6% 71.4% 86.2% 83.3%
> 2.12* 92.6% 85.7% 92.6% 85.7%
Note:− PPV indicates positive predictive value; NPV, negative predictive value. *Value indicates optimum threshold value.
- 18 -
IV. DISCUSSION
Our results showed a significant correlation between HR-SWI and DSC MR
perfusion in the determinationof glioma vascularity. HR-SWI demonstrated the highest
degree of ITSS in glioblastoma multiforme and heterogeneous tumor vascularity within each glioma. In the present study, specific morphological patterns of ITSSs were matched with the regions of visually maximal rCBV, and the degree of ITSSs was significantly correlated with the values of rCBVmax on DSC MR perfusion images, suggesting that the ITSSs are potentially helpful sign for a correct diagnosis of high-grade glioma. We also found that the diagnostic performance of HR-SWI for grading gliomas was comparable to that of DSC MR perfusion. The ITSSs were seen in all glioblastomas, although their degree was somewhat different in each tumor. In the ROC curve analysis, the diagnostic accuracy of HR-SWI for determining high-grade glioma was relatively high. Moreover, the specificity and PPV of ITSSs for determining high-grade glioma were higher than those of rCBVmax. It is possible that these results are related to the fact that ITSSs were rarely seen in low-grade glioma.
MR perfusion is currently one of the best imaging modalities, for the evaluation of
glioma grade. The rCBV and permeability values (Ktrans) have been reported as reliable
parameters in glioma grading (Law et al.,2003; Law et al. 2004; Lev et al.,2004). Recently, HR-SWI has been reported as a useful tool for non-invasive glioma grading (Barth et al.,2003; Pinker et al.,2007; Pinker et al.,2008).
gliomas contain a relatively large amount of deoxyhemoglobin, which generates susceptibility effects and causes signal loss (Pinker et al.,2007). Pinker et al. (Pinker et al.,2007) reported that intra-lesional susceptibility effects were correlated with tumor grade, as determined by PET and histopathology, and that by direct comparison of intra-lesional susceptibility effects with the histopathology, intra-tumoral susceptibility effects reflected conglomerates of tumor microvascularity. In the present study, conglomerated dot-like or tubular ITSSs significantly correlated with the maximal rCBV values obtained by DSC MR perfusion.
With the advent of 3T MR scanners and parallel imaging techniques, the acquisition time of HR-SWI is not exhaustive, compared with conventional gradient echo techniques. As shown previously (de Souza et al.,2008; Lee et al.,1999; Pinker et al.,2008; Sehgal et al.,2005) HR-SWI can provide valuable additional information in pathologic brain disorders. Moreover, contrary to a previous report (Pinker et al.,2008), HR-SWI, as included in our imaging protocol, allowed coverage of the whole brain within the acquisition time mentioned above. At our institution, we could acquire HR-SWI with reasonable spatial resolution within 4 min, and our routine brain MR imaging protocol now includes non-contrast-enhanced HR-SWI.
Several previous studies have proposed that HR-SWI should be performed with contrast enhancement, because the contrast agent can shorten T1-relaxation times of blood; therefore, the extra phase shift could improve signal cancellation at shorter acquisition times and thus result in a shorter scan time (Barth et al.,2003; Pinker et al.,2007; Pinker et al.,2008). However, routine MR imaging protocols for brain tumors
- 20 -
usually include contrast enhancement studies such as contrast-enhanced T1-weighted images and perfusion MR images. Therefore, the combination of HR-SWI and contrast enhancement does not provide an added value in diagnostic accuracy or acquisition time for glioma grading. In the present study, we performed HR-SWI without contrast administration. If the diagnostic accuracy of non-contrast-enhanced HR-SWI for glioma grading were comparable to that of perfusion MR, currently the best imaging modality for glioma grading, we would expect that a non-contrast-enhanced MR imaging protocol could be performed in routine brain tumor imaging. In our study with non-contrast-enhanced HR-SWI, the correlation between the degree of ITSS and the value of rCBVmax was significant. Moreover, the diagnostic accuracy, including sensitivity and specificity, of non-contrast enhanced HR-SWI for glioma grading was comparable to that of DSC MR perfusion.
Our study has several limitations. Of the 41 patients, twelve patients underwent
stereotacticbiopsy, which might be prone to the sampling error of not includingthe most
representative part of the tumor. However, we decidedthe biopsy site based on information
from both contrast enhancementand foci of maximum rCBV values. It has been reported
that thisapproach may offer a more accurate way of choosing a biopsysite (Covarrubias et
al.,2004). Another limitation is that we performed directcorrelation between
HR-SWI-derived ITSS andhistopathologic finding only in three of our cases. However, the direct
histopathologic correlation has previously been reported (Law et al.,2003), Therefore, we focused on the comparison of HR-SWI with DSC MR perfusion. We did not have a guideline or reference for quantifying the degree of ITSS, and thus our method could be
subjective. However, the inter-observer agreement for our measurement of the ITSS degree was excellent. Finally, an uneven distribution of tumor grades was used for our analysis. The current study included a relatively small number of anaplastic astrocytomas (WHO grade III). For practical purposes, we grouped patients with anaplastic astrocytomas and glioblastoma multiforme together in our major analysis. Further studies with larger populations are necessary to determine the usefulness of HR-SWI in differentiating these two tumor groups.
- 22 -
V. CONCLUSION
Semi-quantitative assessment of glioma vascularity using non-contrast-enhanced high-field HR-SWI shows significant correlation with the values of MR perfusion parameters, currently the best imaging modality for glioma grading. Moreover, the specificity and PPV of HR-SWI are higher than those of DSC MR perfusion because the ITSSs are rarely seen in low grade glioma. Therefore, the ITSSs are potentially helpful sign suggesting a correct diagnosis of high grade glioma. Our results show the possibility of a non-contrast brain tumor imaging protocol in patients who have contraindications for contrast agents or who cannot tolerate the bolus injection.
REFERNCES
1. Barth M, Nöbauer-Huhmann IM, Reichenbach JR, Mlynárik V, Schöggl A, Matula C, Trattnig S : High-resolution three-dimensional contrast-enhanced blood oxygenation level-dependent magnetic resonance venography of brain tumors at 3 Tesla: first clinical experience and comparison with 1.5 Tesla. Invest Radiol. 38 : 409–414, 2003
2. Covarrubias DJ, Rosen BR, Lev MH. Dynamic magnetic resonance perfusion imaging of brain tumors. Oncologist. 9 : 528–537, 2004
3. Daumas-Duport C, Beuvon F, Varlet P, Fallet-Bianco C : WHO and Sainte-Anne Hospital classifications. Ann Pathol. 20 : 413–428, 2000
4. de Souza JM, Domingues RC, Cruz LC Jr, Domingues FS, Iasbeck T, Gasparetto EL. Susceptibility-weighted imaging for the evaluation of patients with familial cerebral cavernous malformations: a comparison with T2-weighted fast spin-echo and gradient-echo sequences. AJNR Am J Neuroradiol. 29 : 154-158, 2008
5. Haacke EM, Xu Y, Cheng YC, Reichenbach JR : Susceptibility weighted imaging (SWI). Magn Reson Med. 52 : 612–618, 2004
- 24 -
6. Law M, Yang S, Wang H, Babb JS, Johnson G, Cha S, Knopp EA, Zagzag D : Glioma grading: sensitivity, specificity, and predictive values of perfusion MR imaging and proton MR spectroscopic imaging compared with conventional MR imaging. AJNR Am J Neuroradiol. 24 : 1989–1998, 2003
7. Law M, Yang S, Babb JS, Knopp EA, Golfinos JG, Zagzag D, Johnson G : Comparison of cerebral blood volume and vascular permeability from dynamic susceptibility contrast-enhanced perfusion MR imaging with glioma grade. AJNR Am J Neuroradiol. 25 : 746–755, 2004
8. Lee BC, Vo KD, Kido DK, Mukherjee P, Reichenbach J, Lin W, Yoon MS, Haacke M : MR high-resolution blood oxygenation level d ependent venography of occult (low-flow) vascular lesions. AJNR Am J Neuroradiol. 20 : 1239–1242, 1999
9. Lev MH, Ozsunar Y, Henson JW, Rasheed AA, Barest GD, Harsh GR 4th, Fitzek MM, Chiocca EA, Rabinow JD, Csavoy AN, Rosen BR, Hochberg FH, Schaefer PW, Gonzalez RG : Glial tumor grading and outcome prediction using dynamic spin-echo MR susceptibility mapping compared with conventional contrast-enhanced MR: confounding effect of elevated rCBV of Oligodendrogliomas. AJNR Am J Neuroradiol. 25 : 214–221, 2004
10. Pinker K, Noebauer-Huhmann IM, Stavrou I, Hoeftberger R, Szomolanyi P, Karanikas G, Weber M, Stadlbauer A, Knosp E, Friedrich K, Trattnig S : High-Resolution contrast-enhanced, susceptibility-weighted MR Imaging at 3T in patients with brain tumors: correlation with positron-emission tomography and histopathologic findings. AJNR Am J Neuroradiol. 28 : 1280-86, 2007
11. . Pinker K, Noebauer-Huhmann IM, Stavrou I, Hoeftberger R, Szomolanyi P, Weber M, Stadlbauer A, Grabner G, Knosp E, Trattnig S : High-field, high-resolution, susceptibility-weighted magnetic resonance imaging: improved image quality by addition of contrast agent and higher field strength in patients with brain tumors. Neuroradiology. 50 : 9-16, 2008
12. Rauscher A, Sedlacik J, Barth M, Mentzel HJ, Reichenbach JR : Magnetic susceptibility-weighted MR phase imaging of the human brain. AJNR Am J Neuroradiol. 26 : 736–742, 2005
13. Reichenbach JR, Essig M, Haacke EM, Lee BC, Przetak C, Kaiser WA, Schad LR : High-resolution venography of the brain using magnetic resonance imaging. MAGMA. 6 : 62–69, 1998
- 26 -
14. Reichenbach JR, Jonetz-Mentzel L, Fitzek C, Haacke EM, Kido DK, Lee BC, Kaiser WA : High-resolution blood oxygen-level dependent MR venography (HRBV): a new technique. Neuroradiology. 43 : 364-69, 2001
15. Reichenbach JR, Haacke EM. High-resolution BOLD venographic imaging: a window into brain function. NMR Biomed. 14:453–467, 2001
16. Sehgal V, Delproposto Z, Haacke EM, Tong KA, Wycliffe N, Kido DK, Xu Y, Neelavalli J, Haddar D, Reichenbacn JR : Clinical applications of neuroimaging with susceptibility-weighted imaging. J Magn Reson Imaging. 22 : 439–450, 2005
17. Wetzel SG, Cha S, Johnson G, Lee P, Law M, Kasow DL, Pierce SD, Xue X : Relative cerebral blood volume measurements in intracranial mass lesions: interobserver and intraobserver reproducibility study. Radiology. 224 : 797–803, 2002
-국문요약-
3T 자기공명에서 비조영증강 고해상도 자화율 민감 영상을 이
용한 신경교종 혈관분포에 대한 평가: 관류 강조 영상과 비교
아주대학교 대학원의학과 박 미 진 (지도교수: 김 선 용) 고해상도 자화율 민감 영상 (HR-SWI) 에서 나타나는 종양 내 자화율 신 호 (ITSS) 가 신경교종의 악성등급과 관계 있는 혈관분포를 반영한다는 가설을 평가하고자 하였다. 그리고 현재 신경교종의 수술 전 진단영상으로 인정받은 자기공명 관류 강조 영상과 비교하여 뇌신경교종을 등급화하는 데 있어 HR-SWI 의 진단적 정확도를 측정하고자 하였다. 수술 전 비조영증강 고해상도 자화율 민감영상과 관류 강조 영상을 포함 한 자기공명 영상 검사를 시행하고 뇌신경교종으로 진단받은 41명의 환자를 대상으로 하였다. 각각의 종양에서 관찰한 ITSSs 의 빈도와 형태가 자기 공명 관류 강조 영상에서 얻어진 최고 상대 뇌혈용적 (rCBVmax) 값과 연관성이 있 는지 조사하였다. 환자군을 신경교종의 병리학적 악성도 등급에 따라 세 개로 분류하고 ITSSs 의 빈도와 신경교종 등급 사이의 Spearman 상관계수를 구하였 다. ROC curve 검사방법을 사용하여 ITSSs 의 고 등급 신경교종에 대한 진단적- 28 -
가치까지 알아보았다.
ITSSs 빈도와 rCBVmax 가 유의미한 선형 상관관계를 보였고 ITSSs 의 빈도는 세 개의 집단에서 모두 유의미한 차이를 보였다. ITSSs 의 빈도와 신경 교종의 등급 사이의 Spearman 상관계수는 0.88 이었다. ROC curve 분석을 통하 여 ITSSs 의 등급으로 신경교종의 병리학적 고 등급을 진단하는 데 있어서 민 감도, 특이도, 양성예측도, 그리고 음성예측도는 각각 85.2%, 92.9%, 95.8%, 그리 고 76.5% 였다. 결론적으로 비조영증강 고자장 고해상도 자화율 민감 영상을 사용한 신 경교종 혈관분포의 반정량적 평가는 rCBVmax 와 유의미한 상관관계가 있었고 신경교종을 등급화하는 특이도와 양성예측도는 rCBVmax 를 사용한 자기공명 관류 영상보다 더 높았다.. 핵심어: 자화율 민감 영상, 신경교종, 혈관분포, 자기공명 관류 강조 영상