ICCAS2005 June 2-5, KINTEX, Gyeonggi-Do, Korea
Deep Of Discharge Meter
Somphon Rattanaphaiboon*, Winya Sawaengsinkasikit**,
Vittaya Tipsuwanporn*, Prapas Roengruen*
*Dept. of Instrument Engineering,
Faculty of Engineering, King Mongkut’s Institute of Technology, Ladkrabang, Bangkok, Thailand,Tel : (66-2) 739-2406-7 Ext. 103 , Email : ktvittay@kmitl.ac.th , somphon_r@hotmail.com
**Dept. of Electrical Engineering, Faculty of Engineering, Kasem Bundit University, Bangkok, Thailand
Abstract :Battery is an energetic collector of solar cell system. Battery which is used in the system must have many qualities in the followings. The battery must be “Deep Cycle Battery ” type. In addition ,the battery is Cleary indicated the percentage of DOD. The indication of DOD is used for calculation other valve used in solar cell system. Currently ,the percentage of DOD of battery is fixed by battery manufacture. If users would like to calculate is introduced % DOD ,the users have to check the battery at least 12 months. This article is introduced battery deep of discharge meter by using theory of lead acid battery under deep cycle type and including the theory of DC. Current and internal resistance of battery. The data used for analyzing are collected according to the theories. The data will be calculated by monitor unit and controller systems.
Keywords :DOD = Deep of Discharge, Ah = Ampere – Hour , Sp.Gr. = Specific Gravity,
1. INTRODUCTION
2. . INDOCTRINATION OF SYSTEM
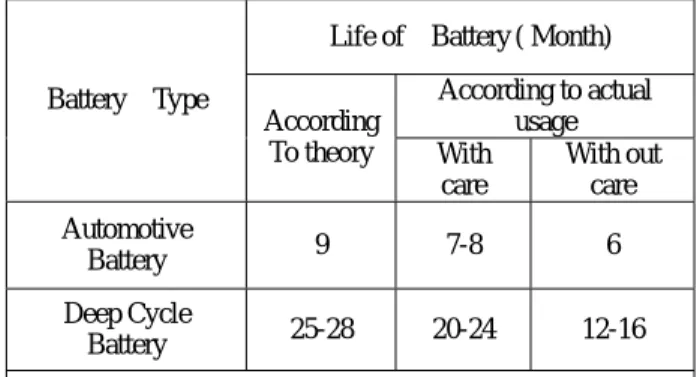
Electrical generator of direct circuit or batter has been accepted and use as power supply that be able to keep energy in the form of electricity. Electrical generator of direct current will depreciate according to the time of usage and condition of usage. From the developed research and project of solar cell in Thailand and many countries, The system is not successful as it should be. The reason is that can not control how people use even though it is designed and developed by engineer. This article will suggest how to prevent user’s behavior in controlling self discharging of battery in solar cell system. Battery Deep of Discharge meter checks energy of battery, stops self discharging of inverter, set or sending signal when battery discharges its self to the specific DOD. This system prevents over discharging of better . As the result, The life of battery is longer. We can conclude the life test of battery in solar cell system as table 1
The system of battery DOD meter is the same as loading that connected in parallel with the battery for measuring such as electrical pressure, electrical current. The measured result is compared with the resistance within the battery and the degree of acid at different DOD and time. The output will be the usage of electrical energy per hour ( Watt-Hour ) and the controlled signal of solar cell system by indicating DOD of discharging battery.
2.1 The calculation of acid degree
In battery, acid is diluted sulfuric acid. The degree of acid is enough to react with chemical in battery, Battery used with solar cell or deep cycle battery use electrolyte with specific
gravity 1.280 at 20oc. When it is fully charged, the specific
gravity equals 1.320 at 20oc. When it is empty, the specific
gravity equals1.080 at 20oc. The temperature of electrolyte
will affect the acid degree as follows;
Sp.Gr.20 o
C = Sp.Gr.R + 0.00073 (TR – 20). (1)
Table 1 Life of Lead-acid battery in solar cell system.
From the equation (1), the specific gravity will change
0.0073 at energy 1oc and the acid degree will also effect the
electrical current in the battery. Life of Battery ( Month)
According to actual usage Battery Type According To theory With care With out care Automotive Battery 9 7-8 6 Deep Cycle Battery 25-28 20-24 12-16
* Comparing the same currant and size of battery
2.2 Calculation of electrical current and energy in solar cell system.
From the researched in formation found that Thailand has
sun energy about 4.5 Kw.h/m2/day[3][4] . The energy starts from
08.00 AM - 4.00 PM. (8 hours). The solar cell can receive energy the most during 09.30 AM -2.30 PM. (5 hours). For this article, we will use government solar home system as case study. We can calculate as follow;
From table 1 The life of battery is depended on the maintenance and usage. If we can control the discharging of battery user’s behavior will change. As the result, the life of battery will be longer. We must have battery DOD meter to check the remaining electrical energy in the battery to define
the system usage.
Picture 1 The follow of solar cell system
ICCAS2005 June 2-5, KINTEX, Gyeonggi-Do, Korea
From picture 3 The battery is not fully charged since day 2 to 6. The remaining energy will not be enough to use in the next day. As the result the battery will be depreciated before its normal life. Therefore, we must set the amount of energy used per day.
We can set the amount by indicating DOD of battery. The amount compare the electrical current and pressure from battery with the resistance and specific gravity of acid at different time. From the discharging information at different DOD, micro controller will compute and display the result. If the result of DOD is more than the set amount, the warning sign will signal user to reduce the load of usage.
Picture 2 The flow of Solar Home System
- Solar panel size 120 Wp, the highest received energy
in 1 day equal to 2.3 The electrical pressure and resistance in the battery
In checking battery, the electrical pressure is an variable that can be checked easiest. We can check the electrical current by connecting the load with the battery to discharge electricity out. For the electrical resistance can be checked by sophisticated and expensive equipment. When the battery is fully charged, Voltage is equal 12.75-12.95 V. According to the resistance of Deep cycle battery 12 V. When the battery is discharge, the voltage will decrease 10.5 V. or 1.75 V/cell or the battery is out of electricity. On the other hands, the resistance in thebattery increases continuously or from equation E = IR .From the equation the capacity of battery will effect the life of battery
Wtotal = 120 W x 5 Hr. = 600 W-h / Day
- Controlling equipment Charger & Inverter the loaded electrical set must have electrical current of 10 A and single phase inverter of 150W with more than 80 % of efficiency. The electrical energy from solar panel that pass through. The controlling equipment (charger and inverter) will have the remaining energy for charging as follows
Wcha = Wtotal x
η
= 600 x 0.80 = 480 W-h/Day (2) - Equipment for using in the system compare of fluorescent 10 watt @ 2 set and plug receptacle for TV 14
inches @ 1 unit.
3. DESIGNING
The designing of battery Deep of Discharge Meter use the principle of direct electrical current and DC watt meter. The result of energy is in the from of Watt-Hour. We compare the result with the resistance and acid degree in the battery. This method will result in the amount of DOD showing on the monitor.
The total load is as follows;
Fluorescent 10 watt @ 2 set = 20 Watt. TV 14 inches @ 1 unit = 60 Watt.
Total = 80 Watt. In 1 day, we continuously use for 5 hours
= 80 x 5 hr. = 400 W-h /Day
The actual energy and the lost energy in electrical wire 5% and the lost energy in inverter 20% equals the actual energy thst id used in the system as follows;
Deep of Discharge Meter
Wuse = 400 / 0.95 / 0.8 = 526 W-h / Day (3)
Deep Cycle Battery
From (2) and (3) Energy for charging the battery is 480 watt but the battery has to distribute the total electrical energy
of 526 watt the remaining energy in battery is as follows; Picture 4 Diagram for battery Deep of Discharge Meter
Wbatt = 12 V x 125 Ah = 1500 W-h From the diagram 4 the meter checks pressure of battery,
the use electrical current to find used energy. The result is compared with the resistance in battery during the discharging and decreasing of acid degree. When the battery is discharging, the result will show in % of DOD. We can set the aunt of DOD for discharging battery. The meter will warn the system or reduce the load to prevent the battery from over discharging sooner than its normal usage.
We allow the battery to distribute the electrical energy at DOD 60 %
= 1500 W-h x 0.60 = 900 W-h (4) The received energy can be concluded as follows;
60 40 DOD DOD = 900 w. 526 w Used 374 w 40 DOD 40 DOD 40 DOD 40 DOD 374 w 480 w Cha 526 wUsed 328 w Uncha. 328 w 480 w Cha 40 DOD 526 w Used Uncha. 40 DOD 480 w Cha Uncha. 40 DOD 526 w Used Uncha. 40 DOD 480 w Cha Uncha. 1 st Day 2 nd Day 3 rd-5 th Day 6 th Day
4. EXPERIMENT AND RESULT
In experiment to find the relationship of electrical energy and battery life, we used deep cycle acid battery 125 Ah /
20HR to discharge.
Picture 3 The distribution of battery
ICCAS2005 June 2-5, KINTEX, Gyeonggi-Do, Korea
From the table, we need to check the electrical pressure
and specific gravity of acid during discharging of battery, First, we measure the discharged current, Second, we measure the resistance within battery. The result can be concluded as follows;
Picture 5 Connecting wire with battery
Picture 6 Showing the result from computer for comparing the actual amount.
For 1 cycle, we discharged the battery at different DOD according to table 2. We recharged the battery with 120 % of the discharged current. We continuously discharged and recharged the battery until it is broken down. Every 25 cycle of charging and discharging, we tested battery capacity to determine battery life.
Table 2 Showing the electrical current that is discharged at different DOD Battery Capacity (Ah) DOD (%) CH & DCH Current ( A ) DCH Time ( Hr ) Final Volt ( V ) Charge Time ( Hr ) 125 10 4.17 (0.033C) 3 10.5 3.6 125 20 8.33 (0.067C) 3 10.5 3.6 125 30 12.50 (0.100C) 3 10.5 3.6 125 40 16.67 (0.133C) 3 10.5 3.6 125 50 20.83 (0.166C) 3 10.5 3.6 125 60 25.00 (0.200C) 3 10.5 3.6 125 70 29.17 (0.233C) 3 10.5 3.6 125 80 33.33 (0.266C) 3 10.5 3.6 125 90 37.50 (0.300C) 3 10.5 3.6 125 100 41.67 (0.333C) 3 10.5 3.6
10.50 10.75 11.00 11.25 11.50 11.75 12.00 12.25 12.50 12.75 13.00 13.25 0 10 20 30 40 50 60 70 80 90 100
Degree of Discharge ( Percentage )
Di schar ge V olt age ( V ) 0.0 5.0 10.0 15.0 20.0 25.0 30.0 35.0 40.0 45.0 50.0 55.0 In te rnal R esi stance ( m Ω )
Discharge Voltage (V) Internal Resistance
Picture 7 The relationship of electrical pressure and the
resistance within battery
10.50 10.75 11.00 11.25 11.50 11.75 12.00 12.25 12.50 12.75 13.00 13.25 0 10 20 30 40 50 60 70 80 90 100
Degree of Discharge ( Percentage )
Di sc har ge V olt ag e (V ) 1.050 1.075 1.100 1.125 1.150 1.175 1.200 1.225 1.250 1.275 1.300 1.325 Sp .G r.o f El ec tro lyt e
Discharge Voltage Sp.Gr.of Electrolyte
Picture 8 The relationship of electrical pressure and
specific gravity
Picture 9 Showing the difference of battery life that has
been controlled and not controlled.
5. CONCLUSION
From the experiment from picture 7 and 8, the internal resistance in the battery and the specific gravity of acid has effected the charge of DOD. As the result, it also effected the battery life. We can apply this information in battery Deep of Discharge Meter and warning system in solar cell system when DOD reaches the fix amount. The battery life in solar cell system will be longer and the energy is equally distributed according to picture 9. If we do not control DOD of battery,
ICCAS2005 June 2-5, KINTEX, Gyeonggi-Do, Korea
the battery life is 550 cycle or 1.5 years. When we control
battery usage by Battery Deep of Discharge Meter, the battery life increases to 820 cycles or 2.5 years. Nevertheless, We must use the correct type of batter. Users can see the difference between “ Deep Cycle battery” and “Automotive Battery” according to table 1.
REFERENCES
[1] David Linder , Handbook of Batteries and Fuel
Cells, McGraw- Hill , New York , 1992
[2] Nippon Denchi , Secondary Batteries for Actuaries
Use ,Japan , Nippon Decchi Co.ltd , 1999
[3] M.M.EI-Wakil , Powerplant Technology , Mc Graw
Hill ,New York , 1984.
[4] H.B.Exell and Kaya Saricali , Solar Energy ,
Vol.18 ,1976.
[5] Solar Home System Project “Provincial Electricity
Authority” Bangkok, Thailand. จค. 2 – ครส. -3 / 2547