Design of Graph Analysis Model to support Decision Making
Sang-Ha An a, Sung-Jin Lee a, Soon-Heung Chang a, Sung-Ho Kim b, Tae-Woon Kim ba Nuclear and Quantum Engineering, Korea Advanced Institute of Science and Technology, 373-1 Guseong-dong, Yuseong-gu, Daejon 305-701 [email protected]
b Korea Atomic Energy Research Institute, 150 Dukjin-dong, Yuseong-gu, Daejon 305-353
1. Introduction
Korea is meeting the growing electric power needs by using nuclear, fissile, hydro energy and so on. But we can not use fissile energy forever, and the people’s consideration about nature has been changed. So we have to prepare appropriate energy by the conditions before people need more energy. And we should prepare dynamic response because people’s need would be changed as the time goes on.
So we designed graphic analysis model (GAM) for the dynamic analysis of decision on the energy sources. It can support Analytic Hierarchy Process (AHP) analysis based on Graphic User Interface.
2. Methods and Results
In this section some of the techniques used to model the graphic analysis tools are described.
2.1 Analysis Model
The Analytic Hierarchy Process (AHP) is a powerful and flexible decision making process to help people set priorities and make the best decision when both qualitative and quantitative aspects of a decision need to be considered. By reducing complex decisions to a series of one-on-one comparisons, then synthesizing the results, AHP not only helps decision makers arrive at the best decision, but also provides a clear rationale that it is the best. Designed to reflect the way people actually think, AHP was developed in the 1970’s by Dr. Thomas Saaty, while he was a professor at the Wharton School of Business, and continues to be the most highly regarded and widely used decision-making theory.
The AHP and Graphic Analysis Model (GAM) software engage decision makers in structuring a decision into smaller parts, proceeding from the goal to objectives to sub-objectives down to the alternative courses of action. Decision makers then make simple pairwise comparison judgments throughout the hierarchy to arrive at overall priorities for the alternatives. The decision problem may involve social, political, technical, and economic factors. The AHP helps people cope with the intuitive, the rational and the irrational, and with risk and uncertainty in complex settings. It can be used to: predict likely outcomes, plan projected and desired futures, facilitate group decision making, exercise control over changes in the decision making system, allocate resources, select alternatives,
do cost/benefit comparisons, evaluate employees and allocate wage increases.
GAM is intuitive, graphically based and structured in a user-friendly fashion so as to be valuable for conceptual and analytical thinkers, novices and category experts. Because the criteria are presented in a hierarchical structure, decision makers are able to drill down to their level of expertise, and apply judgments to the objectives deemed important to achieving their goals. At the end of the process, decision makers are fully cognizant of how and why the decision was made, with results that are meaningful, easy to communicate, and actionable..
Figure 1. Analytic Hierarchy Process Structure[1].
2.2 Graphic Analysis Model (GAM)
To support Analytic Hierarchy Process, we designed Graphic Analysis Model by using Microsoft Visual C++ 6.0. First, user configures the item and link node. Item node means a specific decision value each and link node indicates weight vector of that item. After user configures the item and link node, input the value and weight vector of each item. In our topic, the items are described in Figure 1[1].
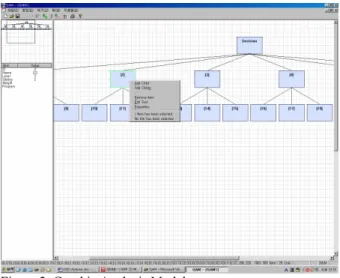
After user made one workspace, he can save and load his work. So if he wants to change his conditions, he just change his data from his work. And he can add or remove item by clicking item. GAM is shown in Figure 2.
Transactions of the Korean Nuclear Society Autumn Meeting Busan, Korea, October 27-28, 2005
Figure 2. Graphic Analysis Model
3. Conclusion
After we tried first trial, we could find out the conditions can be changed by the time goes on. So we made dynamic analysis tool to support dynamic analysis on changing conditions. Graphic Analysis Model (GAM) can support those jobs. Every time user wants to change functional requirements or weight vector, he can get his goal by GAM.
REFERENCES
[1] Seong Ho Kim, Tae Woon Kim, J. J. Ha, Sung Jin Lee, and Soon Heung Chang, Comprehensive Comparative Assessment of National Energy and Power Systems, 2004 KNS Autumn Meeting, Yong Pyung, Korea.
[2] European Commission (EC), ExternE project, Externality of Energy, EC, 1995.
[3] IAEA, Sustainable development and nuclear power, Vienna, 66pp., 1997.
[4] Young Kil Kwon, ASP ++, Mite Press, 2000.
![Figure 1. Analytic Hierarchy Process Structure[1].](https://thumb-ap.123doks.com/thumbv2/123dokinfo/4970019.52801/1.892.466.809.523.754/figure-analytic-hierarchy-process-structure.webp)