저작자표시-비영리-변경금지 2.0 대한민국 이용자는 아래의 조건을 따르는 경우에 한하여 자유롭게 l 이 저작물을 복제, 배포, 전송, 전시, 공연 및 방송할 수 있습니다. 다음과 같은 조건을 따라야 합니다: l 귀하는, 이 저작물의 재이용이나 배포의 경우, 이 저작물에 적용된 이용허락조건 을 명확하게 나타내어야 합니다. l 저작권자로부터 별도의 허가를 받으면 이러한 조건들은 적용되지 않습니다. 저작권법에 따른 이용자의 권리는 위의 내용에 의하여 영향을 받지 않습니다. 이것은 이용허락규약(Legal Code)을 이해하기 쉽게 요약한 것입니다. Disclaimer 저작자표시. 귀하는 원저작자를 표시하여야 합니다. 비영리. 귀하는 이 저작물을 영리 목적으로 이용할 수 없습니다. 변경금지. 귀하는 이 저작물을 개작, 변형 또는 가공할 수 없습니다.
Doctoral thesis in Medicine
Bone mineral density and fatty
degeneration of thigh muscles measured
by computed tomography in hip
fracture patients
2017
Ajou University Graduate school
Major in Medicine
Myung-Hoon Hahn
Bone mineral density and fatty degeneration of
thigh muscles measured by computed tomography
in hip fracture patients
Supervised by
Ye-Yeon Won, M.D., Ph.D.
I submit this thesis as doctoral thesis in medicine
Feb, 2017
Ajou University Graduate school
Major in Medicine
The doctoral thesis of Myung Hoon Hahn
In Medicine is hereby approved
Thesis Defense Committee
President Jae Ho Cho
Member Chang Hoon Jeon
Member Joo Hyoun Song
Member Joung Uk Park
Member Ye Yeon Won
Ajou University Graduate School
Dec. 21
st, 2016
i - ABSTRACT -
Bone Mineral Density and Fatty Degeneration of Thigh Muscles
Measured by Computed Tomography in Hip Fracture Patients
Muscle size and fatty degeneration in the thigh muscles were most positively correlated with the body weight. Bone mineral density was positively correlation with Cross sectional area and Cross sectional muscle area of all thigh muscles, and muscle attenuation coefficient of 2 gluteal muscles and fatty degeneration of 2 mid-thigh muscles. There was no statistically significant difference in the size of the femoral muscle and the degree of fatty degeneration between the two fracture groups.
___ __
Key Words: Osteoporosis, Hip fractures, Bone density, Fatty degeneration, muscle attenuation.
ii
TABLE OF CONTENTS
ABSTRACT ··· ⅰ TABLE OF CONTENTS ··· ⅱ LIST OF FIGURES ··· ⅲ LIST OF TABLE ··· iv Ⅰ. INTRODUCAITON ··· 1Ⅱ. MATERAL AND METHOD ··· 1
A. SUBJECTS ··· 1
B. MEASUREMENT ··· 2
1. PHYSICAL CHARACTERISTICS ··· 2
2. BONE MINERAL DENSITY ··· 2
3. MUSCLE MEASUREMENTS OF THE FEMORAL REGION ··· 3
C. STATISTICAL ANALYSIS ··· 3
Ⅲ. RESULTS ··· 4
A. PHYSICAL CHARACTERISTICS AND MUSCLE MEASUREMENTS ··· 4
B. CORRELATION BETWEEN THE MEASUREMENTS ··· 4
C. THE DIFFERNCE BETWEEN INTERTROCHANTERIC FRACTURE GROUP AND FEMORAL NECK FRACTURE GROUP ··· 7
Ⅳ. DISCUSSION ··· 8
Ⅴ. CONCLUSION ··· 10
REFERENCES ··· 11
iii
LIST OF FIGURES
Fig. 1. Measurement of intramuscular fat area and average HU within muscle by software program (between -190 to -30 HU ). ··· 2
iv
LIST OF TABLES
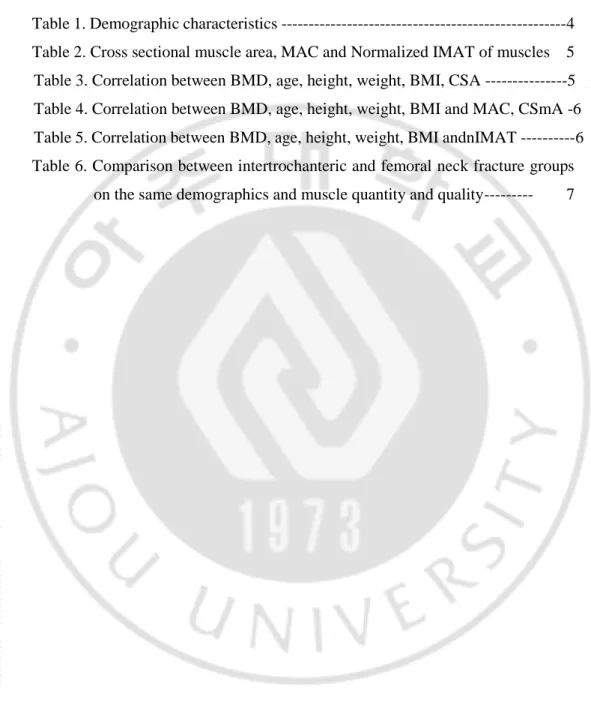
Table 1. Demographic characteristics ---4 Table 2. Cross sectional muscle area, MAC and Normalized IMAT of muscles 5 Table 3. Correlation between BMD, age, height, weight, BMI, CSA ---5
Table 4. Correlation between BMD, age, height, weight, BMI and MAC, CSmA -6 Table 5. Correlation between BMD, age, height, weight, BMI andnIMAT ---6 Table 6. Comparison between intertrochanteric and femoral neck fracture groups
1
I. Introduction
Progressive reduction of bone mass and muscle mass are inevitable processes which occur with aging. (Edwards et al, 2015, Umberto et al, 2013) BMD has a positive correlation between muscle mass and muscle strength, and therefore, sarcopenia is related to osteoporosis.(He et at, 2016, Kim et al, 2014) In the process of aging of these muscles, the degree of intramuscular fatty degeneration increased, which is also associated with a decrease in mobility function.(Marcus et al, 2012) Osteoporotic hip fracture is an important geriatric disease that threatens the life of the patient and impairs quality of life and is rapidly increasing with aging in elderly people over 65 years old.( Yoon et al, 2011, Yoon et al, 2013 ) The decrease of BMD and morphological characteristics of the proximal femur have been identified as factors affecting the osteoporotic hip fracture.(Svejrne et al, 2013, Broy et al, 2015 ) In recent years, muscle size change around the thigh area and the weakening of muscle strength by fatty degeneration are getting attention as factors affecting the osteoporotic hip fracture.(Schafer et al, 2010, Malkow et al, 2015 ) Visser et al. reported that the muscle amount and fatty degeneration were related to lower extremity performance and mobility limitation in well-functioning older persons.(Visser et al, 2005, Visser et al 2002 ) This weakening of muscle strength is related to the risk of falling.Moreland et al, 2004 ) Lang et al. reported that the fatty degeneration of thigh muscles increases the relative risk of hip fracture by 42%, which is independent of BMD and a predictive factor of hip fracture.(Lang et al, 2000 ) The purpose of this study is to investigate the correlation between body composition and measured BMD, muscle size, muscle weakness index and the degree of fatty degeneration of thigh muscles in women over 65 years old with osteoporotic hip fracture. Hip fracture patients were divided into femoral intertrochanteric fracture group and femoral neck fracture group, then BMD, thigh area muscle size, and fatty degeneration were investigated to find out the difference between the two groups.
II Materials and methods
1. Subjects
This study was conducted with 178 patients, out of 316 women osteoporotic hip fracture patients who were hospitalized at orthopedic surgery department of Ajou University from March 2013 to May 2016, who conducted both total hip BMD measurement and computed tomography of thigh muscles. Among them, the number of femoral neck fracture patient was 73 and the number of femoral intertrochanteric fracture patient was 105. We excluded patients with high-energy damage such as car accidents or falling, patients with diseases that may affect bone metabolism, patients who cannot walk well after being injured, and patients whose bone mineral density of hip region cannot be measured owing to the hip fracture at both sides.
2
Fig.1. Measurement of intramuscular fat area and average HU within muscle by software program ( between -190 to -30 HU ). HU; Hounsfield Unit
2. Measurement
1) Physical characteristics
The height and weight of the patient were measured and BMI was calculated. 2) Bone mineral density (BMD)
Total hip BMD was measured in the subject patient using dual energy X-ray absorptiometry (Lunar Prodigy DXA system, GE, Healthcare, USA). Patient measured BMD of the proximal femur without fracture in the supine position within 7 days of injury.
3 3) Muscle measurements of the femoral region
Four muscles were selected from the gluteal region (gluteus maximus and hip abductors) and mid-thigh region (quadriceps and Hamstring muscle) for the measurement. In order to measure these muscles, two axial images were taken using computed tomography (CT) before surgery and within 7 days after being injured. To measure gluteal muscles, axial cut was made on the basis of the third sacrum, and to measure mid-thigh region muscles, another axial cut was made on the basis of the mid-femur(50% of femur length).(Siemens Ltd., Erlangen, Germany) The length of the femur was measured from the tip of the femur to the intertrochanter notch. In the axial images, CSA of each muscle, CSmA, MAC and IMAT were measured using NIH Image J ver. 1.49K (NIH, Bethesda, MD, USA) software program which automatically distinguish muscle and fat based on the Hounsfield Unit (HU) within the muscle area, between 30-80 HU is recognized as muscle, and between -190 and -30 HU is recognized as fat (figure 1). (Lang et al, 2010, Goodpaster et al 2000 ) The IMAT value was divided by the size of each muscle to compensate for the difference in the body size of the patient, which was expressed as the normalized IMAT(nIMAT) value.(Vanderstracten et al, 2011 )
Normalized IMAT(%) = IMAT x 100 / CSA
3. Statistical analysis
Variables such as age, height, weight, BMI, BMD, and measurements of four muscles around thigh area of patient were expressed in the form of mean and standard deviation. The correlation between the variables was obtained with Pearson correlation and was statistically analyzed using SSPC statistical program(SPSS version22 SPSS Inc, Chicago, Illinois). Differences in the variables between the femoral neck fracture group and the intertrochanteric fracture group were determined using independent sample t test, with a statistical significance of less than 0.05.
4
III Result
1. Physical characteristics and muscle measurements
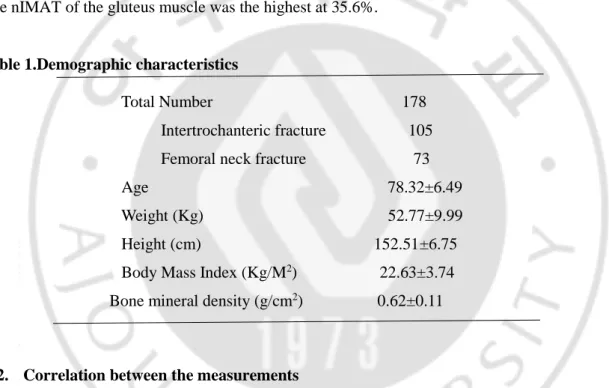
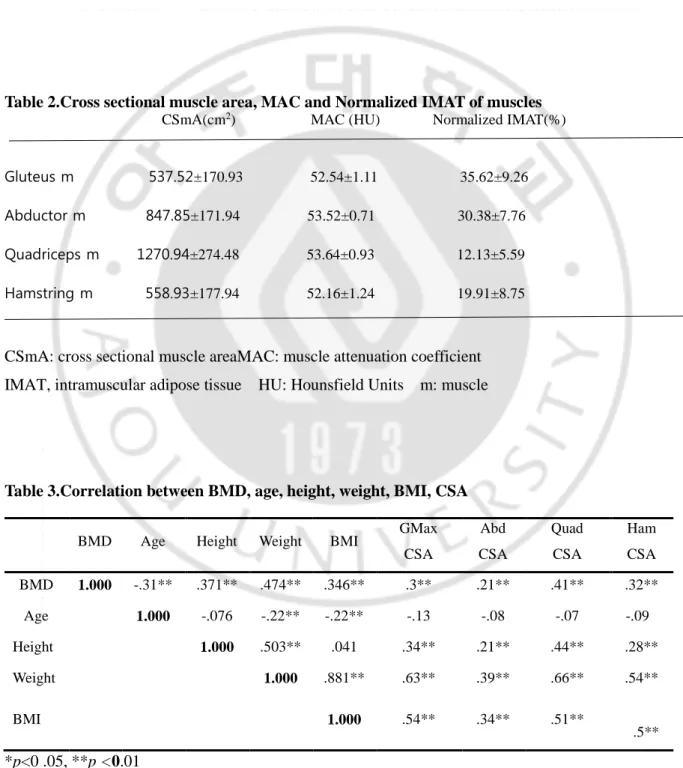
The physical characteristics of the subject patients are shown in Table 1. The mean age of patients was 78.3 years old, ranging from 65 to 91 years old. The mean BMI was 22.6, ranging from 14.4 to 35.2 and 46 patients were in the obese group (25.8% of the total patient). The mean BMD was 0.62g/cm2, ranging from 0.35 to 0.98. The mean T-score was -2.79 and 119 patients (66.9% of the total patient) were under -2.5 score which is in the range of osteoporosis under the WHO criteria. The measured CSmA, MAC and nIMAT of the four muscles are shown in Table 2. The MAC value of quadriceps muscle was 53.64 HU, which was the highest among the four muscles, with the lowest nIMAT of 12.1%. The nIMAT of the gluteus muscle was the highest at 35.6%.
Table 1.Demographic characteristics
Total Number 178 Intertrochanteric fracture 105 Femoral neck fracture 73 Age 78.32±6.49 Weight (Kg) 52.77±9.99 Height (cm) 152.51±6.75 Body Mass Index (Kg/M2) 22.63±3.74
Bone mineral density (g/cm2) 0.62±0.11
2. Correlation between the measurements
The correlation between the measurements and the statistical significance are shown in Table 3, 4, 5. BMD showed statistically significant decrease with increasing age and showed positive correlations with height, weight, and BMI. As the weight and BMI were increased, BMD increased. CSA of the four muscles showed statistically significant positive correlations with BMD, weight, height, and BMI, and a negative correlation with age. In other words, muscle size decreased with age.
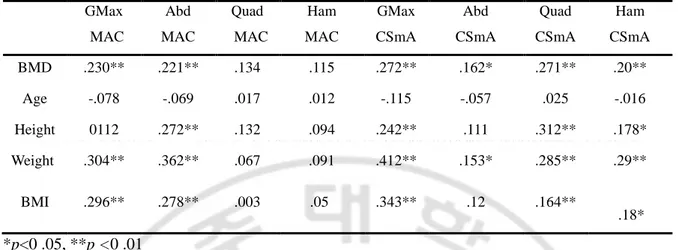
Regarding the MAC, which represents the muscle density of each muscle, gluteus maximus and abductor muscles in the gluteal area showed significantly positive correlations with BMD, weight, and BMI. However, quadriceps and hamstring muscles in the mid-thigh area showed positive correlations with BMD, weight, and BMI but no statistical significance.
CSmA in four muscles statistically increased with increasing BMD and showed a negative correlation with age except quadriceps. In other words, CSmA showed a decrease with increasing age but no statistical significance. CSmA of gluteus maximus, quadriceps and hamstring muscle showed
5
statistically significant positive correlation with BMD, height, weight and BMI, on the contrary, CSmA of abductor muscle showed a positive correlation with BMD and weight.
The nIMAT, which indicates the degree of fatty degeneration of each muscle, of all four muscles showed a statistically significant positive correlation with weight and BMI, on the other hand, showed negative correlations with age but no statistical significance. In quadriceps and hamstring muscles of mid-thigh area, nIMAT showed a statistically significant positive correlation with BMD.
Table 2.Cross sectional muscle area, MAC and Normalized IMAT of muscles CSmA(cm2) MAC (HU) Normalized IMAT(%)
Gluteus m 537.52±170.93 52.54±1.11 35.62±9.26
Abductor m 847.85±171.94 53.52±0.71 30.38±7.76
Quadriceps m 1270.94±274.48 53.64±0.93 12.13±5.59
Hamstring m 558.93±177.94 52.16±1.24 19.91±8.75
CSmA: cross sectional muscle areaMAC: muscle attenuation coefficient IMAT, intramuscular adipose tissue HU: Hounsfield Units m: muscle
Table 3.Correlation between BMD, age, height, weight, BMI, CSA
BMD Age Height Weight BMI GMax
CSA Abd CSA Quad CSA Ham CSA BMD 1.000 -.31** .371** .474** .346** .3** .21** .41** .32** Age 1.000 -.076 -.22** -.22** -.13 -.08 -.07 -.09 Height 1.000 .503** .041 .34** .21** .44** .28** Weight 1.000 .881** .63** .39** .66** .54** BMI 1.000 .54** .34** .51** . .5** *p<0 .05, **p <0.01
BMD, bone mineral density; BMI, body mass index; GMax, Gluteus Maximus; Abd, Abductor; Quad, Quadriceps; Ham, Hamstring; CSA, Cross SectionalArea
6
Table 4.Correlation between BMD, age, height, weight, BMI and MAC, CSmA GMax MAC Abd MAC Quad MAC Ham MAC GMax CSmA Abd CSmA Quad CSmA Ham CSmA BMD .230** .221** .134 .115 .272** .162* .271** .20** Age -.078 -.069 .017 .012 -.115 -.057 .025 -.016 Height 0112 .272** .132 .094 .242** .111 .312** .178* Weight .304** .362** .067 .091 .412** .153* .285** .29** BMI .296** .278** .003 .05 .343** .12 .164** . .18* *p<0 .05, **p <0 .01
BMD, bone mineral density; BMI, body mass index; GMax, Gluteus Maximus; Abd, Abductor; Quad, Quadriceps; Ham, Hamstring;MAC , muscle attenuation coefficient CSmA, Cross Sectional muscle Area
Table 5. Correlation between BMD, age, height, weight, BMI andnIMAT GMax nIMAT Abd nIMAT Quad nIMAT Ham nIMAT BMD .128 .125 .176* .149* Age -.004 -.01 -.131 -.121 Height .125 .094 .180* .093 Weight .41** .316** .465** .353** BMI .4** .3** .431** .343** *p<0 .05, **p <0 .01
BMD, bone mineral density; BMI, body mass index; GMax, Gluteus Maximus; Abd, Abductor; Quad, Quadriceps; Ham, Hamstring;
7
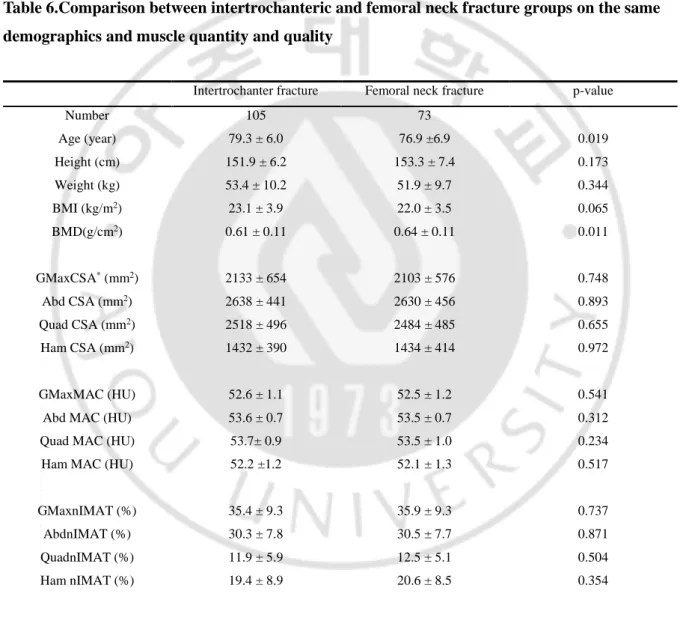
3. The difference between intertrochanteric fracture group and femoral neck fracture group The measurement values of the two groups are shown in Table 6. The age and BMD of the patients were statistically different between the two groups. Age was higher in the intertrochanteric fracture group and BMD was higher in femoral neck fracture group. The muscle size and a degree of fatty degeneration of the muscles were not significantly different between the two groups.
Table 6.Comparison between intertrochanteric and femoral neck fracture groups on the same demographics and muscle quantity and quality
Intertrochanter fracture Femoral neck fracture p-value
Number 105 73 Age (year) 79.3 ± 6.0 76.9 ±6.9 0.019 Height (cm) 151.9 ± 6.2 153.3 ± 7.4 0.173 Weight (kg) 53.4 ± 10.2 51.9 ± 9.7 0.344 BMI (kg/m2) 23.1 ± 3.9 22.0 ± 3.5 0.065 BMD(g/cm2) 0.61 ± 0.11 0.64 ± 0.11 0.011 GMaxCSA* (mm2) 2133 ± 654 2103 ± 576 0.748 Abd CSA (mm2) 2638 ± 441 2630 ± 456 0.893 Quad CSA (mm2) 2518 ± 496 2484 ± 485 0.655 Ham CSA (mm2) 1432 ± 390 1434 ± 414 0.972 GMaxMAC (HU) 52.6 ± 1.1 52.5 ± 1.2 0.541
Abd MAC (HU) 53.6 ± 0.7 53.5 ± 0.7 0.312
Quad MAC (HU) 53.7± 0.9 53.5 ± 1.0 0.234
Ham MAC (HU) 52.2 ±1.2 52.1 ± 1.3 0.517
GMaxnIMAT (%) 35.4 ± 9.3 35.9 ± 9.3 0.737
AbdnIMAT (%) 30.3 ± 7.8 30.5 ± 7.7 0.871
QuadnIMAT (%) 11.9 ± 5.9 12.5 ± 5.1 0.504
Ham nIMAT (%) 19.4 ± 8.9 20.6 ± 8.5 0.354
Data is expressed as Mean ± SD. Comparisons significant for p < 0.05
BMD, bone mineral density; BMI, body mass index; GMax, Gluteus Maximus; Abd, Abductor; Quad, Quadriceps; Ham, Hamstring; CSA, Cross sectional area;HU, Hounsfield units;
8
IV. Discussion
With age, loss of muscle mass is associated with loss of bone mass. The precise mechanism responsible for synchronizing bone and muscle mass remain unclear. Muscle decline with age appears to occur before bone decline with age. With age, greater adiposity is observed in both bone marrow and muscle and fat infiltrated are also observed in nerves and capillaries.(Bonewald et al, 2013 )
Goodpaster, et al. argued that muscle strength decline is much more rapid than the concomitant loss of muscle mass which suggest a decline in muscle quality. Moreover, the degree of muscle weakness is much more related with the muscle strength reduction than muscle mass does.(Goodpaster et al, 2006 ) Marcus et al. reported that intramuscular fat deposition is associated with metabolic deficits and lack of exercise in the elderly and increases with age and the level of inactivity.( Marcus et al, 2010 ) To measure the deposition of fat tissue in muscle, invasive methods such as biopsy of muscle tissue, and noninvasive methods such as dual energy X-ray absorptiometry(DXA), computed tomography(CT) and H-MR spectroscopy are being used.(Malkow et al, 2014, Goodpaster et al, 2000, Nakagawa et al, 2007 ) ) Among these, the measurement of fatty degeneration in muscles using a computed tomography showed that the fat tissue was dark and the muscle tissue was bright (depending on the proton content per unit mass, the adipose tissue appears in the negative area, ranging from -190 to -30 HU, and the muscle appears in the 0 to 100 HU area), so that the two tissues could be easily distinguished. Therefore, despite the radiation exposure and price disadvantages, this method is suitable for measuring the deposition of fat tissue in muscle. (Goodpater et al, 2000 ) Recently, Malkov et al. reported that value of the CSA, MAC, and subcutaneous fat thickness of the muscle around the femur which was measured using dual-energy X-ray absorptiometry, showed a statistically significant correlation with the value of those measured using a computed tomography.(Malkow et al, 2015 ) Although it is convenient for the clinical use, it does not have enough resolution that can surpass the tissue distinguishing ability by computed tomography.
In this study, the MAC value of quadriceps muscle was 53.64 HU, the highest among the four muscles, with the lowest nIMAT of 12.13%. On the other hand, the nIMAT of gluteus maximus muscle was the highest at 35.6%. This suggests that the level of fatty degeneration of the extensor of knee joint is low even in the elderly. Inacio et al. measured the MAC and IMAT values of the thigh muscles in the elderly over 65 years of age. MAC was the highest in the quadriceps and the lowest in the gluteus maximus and medius muscles and IMAT was the lowest measure in quadriceps and showed the same result as that of this study. This is explained by the fact that muscles in the gluteal lesion are more responsive to muscle changes with age.(Inacio et al, 2014 ) Thelen et al. reported that the responsive muscular activation patterns of elderly subjects were similar to those of young subjects in the forward fall experiment. However, there was a difference in muscle activation time due to the delayed quadriceps activity before the swing phase and during the swing phase. The importance of quadriceps muscles in
9 the case of falling was emphasized.(Thelen et al, 2000 )
As expected, analysis of the correlation between the measurements demonstrated that BMD, body weight, and BMI showed statistically significant decrease with age. BMD showed a statistically significant positive correlation with height, body weight, and BMI. CSA and CSmA decreased with age and the degree of fatty degeneration also tends to decrease but no statistical significance. In previous studies, it has been reported that the degree of fatty degeneration of muscle increases with age, however in this study, the degree of fatty degeneration of muscle decrease trend with age but no statistical significance. It seems because ages of the subject patients are high and body weight is more sensitive than age. CSA, CSmA and IMAT showed a statistically significant positive correlation with body weight and BMI in four muscles. So the heavier the body weight, the larger CSA, CSmA and the grater the degree of fatty degeneration. The changes of BMD showed a statistically significant positive correlation with CSA and CSmA. MAC of the quadriceps and hamstring muscles in the mid-thigh area did not show a significant correlation with age, height, weight, BMI and BMD (Table 4). This suggests that 2 muscles in the mid-thigh area is less responsive to body weight changes than in gluteal area. nIMAT of 2 mid-thigh muscles showed positive correlation with weight, BMI and BMD. On the contrary, nIMAT of 2 gluteal muscles showed no correlation with BMD. That means, the higher BMD, the greater MAC of the gluteal muscles and the more fatty degeneration of the mid-thigh muscles.
Recently, other risk factors of the osteoporotic hip fracture which independent from BMD were being announced. Lang et al. reported that combining body composition with skeletal measures may improve fracture prediction compared to bone measure alone. Moreover they reported that the cross-sectional area and muscle weakness index of the thigh muscle were independent fracture risk factors.(Lang et al, 2010, Lang et al, 2008 ) Malkov et al. reported that the thickness of subcutaneous fat in the thigh, cross sectional muscle area and muscle density were the risk factor for hip fracture in both sexes.(Malkow et al, 2015 )
In this study, hip fracture patient group was divided into femur intertrochanteric fracture group and femoral neck fracture group. Age and BMD were statistically different between the two groups. Age was higher in femoral intertrochanteric fracture patients group and BMD was higher in femoral neck fracture patients group. The size and the degree of fatty degeneration of the muscle around the femur was not significantly different between the two groups. Although there are many studies on the morphologic difference of the proximal femur and the BMD in the two fracture groups, this study may be the first to compare the size and cross-sectional area of the surrounding muscles.
The limitation of this study is that the study was retrospective and the fractured patient was included only so couldn’t compare with the non-fracture group. The number of fracture patients was not large enough to obtain statistical significance in comparison between the intertrochanteric fracture group and the neck fracture group. In addition, measurements of vitamin D levels, lipid profile, and blood glucose, which directly affect muscle mass and intramuscular fat deposition, are missing. Park et al. reported
10
that the risk of reduced muscle mass in elderly women with type 2 diabetes was twice as high as in those without type 2 diabetes. Lang et al reported that patients with diabetes had more intramuscular fatty degeneration than those without diabetes and 42% had a higher risk of fracture in the diabetic patient group. (Schafer et al 2010, Park et al, 2009 ) In addition, there was no evaluation of the exercise capacity of the patients before the injury. We suggest that a prospective study supplemented with these findings is needed.
In conclusion, muscle size and degree of fatty degeneration of thigh muscles showed a statistically significant positive correlation with the body weight. BMD was positively correlation with CSA and CSmA of all thigh muscles, and MAC of 2 gluteal muscles and fatty degeneration of 2 mid-thigh muscles. There was no statistically significant difference in the size of the femoral muscle and the degree of fatty degeneration in the femur intertrochanteric fracture and neck fracture patients group.
V. Conclusion
Muscle size and fatty degeneration in the thigh muscles were most positively correlated with the body weight. BMD was positively correlation with CSA and CSmA of all thigh muscles, and MAC of 2 gluteal muscles and fatty degeneration of 2 mid-thigh muscles. There was no statistically significant difference in the size of the femoral muscle and the degree of fatty degeneration between the two fracture groups.
11
References
Bonewald LF, Kiel D, Clemens T, Esser K, Orwoll E, O’Keefe R, Fielding R: Forum on bone and skeletal muscle interactions; Summary of the proceedings of an ASBMR Workshop. J Bone Miner Res 28(9): 1857-1865, 2013
Bouche KG, Vanovermeire O, Stevens VK, Coorevits PL, Caemaert JJ, Camblier DC, Verstraete K, Vanderstraeten GG, Danneels LA: Computed tomographic analysis of the quality of trunk muscles in asymptomatic and symptomatic lumbar discectomy patients. BMC Musculoskelet Disord 12: 65-73, 2011
Broy SB, Cauley JA, Lewiecki ME, Schousboe JT, Shepherd JA, Leslie WD : Fracture Risk Prediction by Non-BMD DXA Measures: the 2015 ISCD Official Positions Part 1: Hip Geometry. J Clin Densitom 18(3):287-308, 2015
Edwards MH, Dennison EM, Sayer AA, Fielding R, Cooper C : Osteoporosis and sarcopenia in older age. Bone 80: 126-130, 2015
Goodpaster BH, Carlson CL, Visser M, Kelley DE, Scherzinger A, Harris TB, Stamm E, Newman AB: Attenuation of skeletal muscle and strength in the elderly: the Health ABC Study. J Appl Physiol 90: 2157–2165, 2001
Goodpaster BH, Kelley DE, Thaete FL, He J, Ross R: Skeletal muscle attenuation determined by computed tomography is associated with skeletal muscle lipid content. J Appl Physiol 89: 104–110, 2000
Goodpaster BH, Park SW, Harris TB, Kritchevsky SB, Nevitt M, Schwartz AV, Simonsick EM, Tylavsky FA, Visser M, Newman AB: The loss of skeletal muscle strength, mass and quality in older adults: the Health, Aging and Body Composition Study. J Gerontol A Biol Sci Med Sci 61:1059–1064, 2006
Goodpaster BH, Thaete FL, Kelley DE: Composition of skeletal muscle evaluated with computed tomography. Ann N Y Acad Sci 904: 18–24, 2000
He H, Liu Y, Tian Q, Papasian CJ, Hu T, Deug HW : Relationship of sarcopenia and body composition with osteoporosis. Osteoporos int 27: 473-482, 2016
Inacio M, Ryan A.S, Bair W.N, Prettyman M, Beamer BA, Rogers MW: Gluteal muscle composition differentiates fallers from non-fallers in community dwelling older adults. BMC geriatrics 14: 37-44, 2014
Kim SY, Won CW, Kim BS, Choi HR, Moon NY: The association between the low muscle mass and osteoporosis in elderly korean people. J Korean Med Sci 29: 995-1000, 2014
Lang T, Cauley JA, Tylavsky F, Bauer D, Cummings S, Harris TB: Computed tomographic
12
health, aging, and body composition study. J Bone Miner Res 25(3): 513–519, 2010
Lang T, Koyama A, Li C, Li J, Lu Y, Saeed I, Gazze E, Keyak J, Harris T, Cheng X: Pelvic body composition measurements by quantitative computed tomography: association with recent hip fracture. Bone 42: 798–805, 2008
Malkow S, Cawthon PM, Peters KW, Cauley JA, Murphy R, Aisser M, Wilson JP, Harris T, Satterfield S, Cummings S, Shepherd JA: Hip fracture risk in older men and women associated with DXA derived measures of thigh subcutaneous fat thickness, cross sectional muscle area, and muscle density. J Bone Miner Res 30(8): 1414-1421, 2015
Marcus RL, Addison O, Dibble LE, Foreman KB, Morrell G, Lastayo P : Intramuscular adipose tissue, sarcopenia, and mobility function in older individuals. Journal of aging research 12: 629-637, 2012 Marcus RL, Addison O, Kidde JP, Dibble LE, Lastayo PC: Skeletal muscle fat infiltration: impact of age, inactivity, and exercise. J Nutr Health Aging 14(5): 362–366, 2010
Moreland JD, Richardson JA, Goldsmith CH, Clase CM: Muscle weakness and falls in older adults: a systematic review and meta-analysis. J Am Geriatr Soc 52: 1121–1129, 2004
Nakagawa Y, Hattori M, Harada K, Shirase R, Bando M, Okano G: Age-related changes in
intramyocellular lipid in humans by in vivo H-MR spectroscopy. Gerontology 53(4): 218–223, 2007 Park SW, Goodpaster BH, Lee JS, kuller LH, Boudreau R, Rekeneire N, Stephen K, Tylavsky F, Nevitt M, Cho YW, Mewman AB: Excessive loss of skeletal muscle mass in older adults with type 2 diabetes.
Diabetes care 32(11): 1993-1997, 2009
Schafer AL, Vittinghoff E, Lang TF, Sellmeyer DE, Harris TB, Kanaya AM, Stromeyer ES, Cawthon PM : Fat infiltration of muscle, diabetes, and clinical fracture risk in older adults. J Clin Endocrinol
Metab 95(11): 368–372, 2010
Svejrne O, Ahlborg HG, Nilsson JA, Karlsson MK : Low BMD is an independent predictor of fracture and early menopause of mortality in post-menopausal women--a 34-year prospective study. Maturitas 74: 341–345, 2013
Thelen DG, Muriuki M, James J, Schultz AB, Ashton Miller JA, Alexander NB: Muscle activities used by young and old adults when stepping to regain balance during a forward fall. Journal of electromyography and kinesiology : official journal of the International Society of
Electrophysiological Kinesiology 10: 93-101, 2000
Umberto T, Jacopo B, Monica C, Cecilia R, Federico ML, Riccardo I, Elena G : Osteoporosis and sarcopenia: the connections. Aging Clin Exp Res 25: S 93-95, 2013
Visser M, Goodpaster BH, Kritchevsky SB, Newman AB, Nevitt M, Rubin SM, Simonsick EM, HarrisTB : Muscle mass, muscle strength and muscle fat infiltration as predictors of incident mobility limitations in well-functioning older persons. J Gerontol A Biol Sci Med Sci 60:324–333, 2005 Visser M, Kritchevsky S, Goodpaster BH, Newman AB, Nevitt M, Stamm E, Harris TB: Leg muscle mass and composition in relation to lower extremity performance in men and women aged 70–79: the
13
Health Aging and Body Composition Study. J Am Geriatr Soc 50: 897–905, 2002
Yoon BH, Lee YK, Kim SC, Kim SH, Ha YC, Koo KH : Epidemiology of proximal femoral fractures in South Korea. Archives of osteoporosis 8: 157-161, 2013
Yoon HK, Park C, Jang S, Jang S, Lee YK, Ha YC : Incidence and mortality following hip fracture in Korea. Journal of Korean medical science 26: 1087-1092, 2011
14 국문 요약