Examining markers in 8q24 to explain differences in evidence for
association with cleft lip with/without cleft palate between
Asians and Europeans
Tanda Murray1,*, Margaret A. Taub2,*, Ingo Ruczinski2, Alan F. Scott3, Jacqueline B. Hetmanski1, Holger Schwender2,4, Poorav Patel1, Tian Xiao Zhang1, Ronald G. Munger5, Allen J. Wilcox6, Xiaoqian Ye7,8, Hong Wang9, Tao Wu9, Yah Huei Wu-Chou10, Bing Shi11, Sun Ha Jee12, Samuel Chong13, Vincent Yeow14, Jeffrey C. Murray15, Mary L. Marazita16, and Terri H. Beaty1
1Department of Epidemiology, Johns Hopkins Bloomberg School of Public Health, Baltimore MD,
USA 21205
2Department of Biostatistics, Johns Hopkins Bloomberg School of Public Health, Baltimore MD,
USA 21205
3Institute of Genetic Medicine, Johns Hopkins School of Medicine, Baltimore MD, USA 21205 4Faculty of Statistics, TU Dortmund University, 44221 Dortmund, Germany
5Utah State University, Logan, UT USA 84322
6NIEHS/NIH, Epidemiology Branch, Durham, North Carolina USA 27709 7Wuhan University, School of Stomatology, Wuhan, China
8Department of Genetics & Genomic Sciences, Mount Sinai School of Medicine, New York, NY
USA 10029
9Peking University Health Science Center, Beijing, China 10Chang Gung Memorial Hospital, Taoyuan, Taiwan
11State Key Laboratory of Oral Disease, West China College of Stomatology, Sichuan University,
Chengdu 610041, P.R. China, Chengdu, China
12Yonsei University, Epidemiology & Health Promotion, Seoul, Korea 13National University of Singapore, Singapore
14KK Women’s & Children’s Hospital, Singapore
14Department of Pediatrics, Children’s Hospital, University of Iowa, Iowa City, IA USA 52242 15Center for Craniofacial and Dental Genetics, School of Dental Medicine, University of
Pittsburgh, Pittsburgh, PA USA 15219
Abstract
In a recent genome wide association study (GWAS) from an international consortium, evidence of linkage and association in chr8q24 was much stronger among non-syndromic cleft lip/palate (CL/ P) case-parent trios of European ancestry than among trios of Asian ancestry. We examined
Contact information: Dr. T.H. Beaty, Dept. of Epidemiology, School of Public Health, Johns Hopkins University, 615 N. Wolfe St,
NIH Public Access
Author Manuscript
Genet Epidemiol
. Author manuscript; available in PMC 2013 May 01.Published in final edited form as:
Genet Epidemiol. 2012 May ; 36(4): 392–399. doi:10.1002/gepi.21633.
NIH-PA Author Manuscript
NIH-PA Author Manuscript
marker information content and haplotype diversity across 13 recruitment sites (from Europe, USA and Asia) separately, and conducted principal components analysis (PCA) on parents. As expected, PCA revealed large genetic distances between Europeans and Asians, and a north-south cline from Korea to Singapore in Asia, with Filipino parents forming a somewhat distinct Southeast Asian cluster. Hierarchical clustering of SNP heterozygosity revealed two major clades consistent with PCA results. All genotyped SNPs giving p<10−6 in the allelic TDT showed higher heterozygosity in Europeans than Asians. On average, European ancestry parents had higher haplotype diversity than Asians. Imputing additional variants across chr8q24 increased the strength of statistical evidence among Europeans and also revealed a significant signal among Asians (although it did not reach genome-wide significance). Tests for SNP-population interaction were negative, indicating the lack of strong signal for 8q24 in families of Asian ancestry was not due to any distinct genetic effect, but could simply reflect low power due to lower allele
frequencies in Asians.
Keywords
cleft lip with/without cleft palate; 8q24; genome wide association; imputation
Introduction
Genome wide association studies (GWAS) of isolated, non-syndromic cleft lip with or without palate (CL/P) have revealed strong evidence of association with markers in a ‘gene desert’ on chr8q24. [Birnbaum et al. 2009] first documented this association in a study of German cases and controls, with the most significant SNP (rs987525) having p-value of 3.34×10⁻²⁴ and an estimated Odds Ratio (OR) of 2.57 for heterozygotes. Similar signals at this same SNP were reported in other non-Hispanic white samples from Philadelphia [Grant et al. 2009], Lithuania and Estonia [Nikopensius et al. 2009], Poland [Mostowska et al. 2010] with estimated ORs of 2.09, 1.89, 1.58, and 1.96, respectively. Using a case-parent trio design, we conducted a GWAS of CL/P and found genome-wide significant results for rs987525 (p=5.04×10⁻¹⁶) and surrounding SNPs, however, the evidence of association was far stronger in trios of European ancestry compared to those of Asian ancestry [Beaty et al. 2010]. In a pooled sample of case-parent trios from Denmark, Norway, Iowa, Pittsburg, Utah and Maryland, the allelic transmission disequilibrium test (TDT) gave an
OR(transmission) of 2.01 (95% CI 1.69–2.38; p=6.69×10⁻¹⁶) for the A allele at rs987525. However, among trios from China, South Korea, Taiwan, Singapore and the Philippines, the p-value for rs987525 was far less significant (p=0.0089), although the estimated direction of effect was similar {OR(transmission)=1.39, 95% CI 1.09–1.78}. In an independent but smaller sample of Chinese and Filipino trios used for replication, rs987525 was not significant, while independently sampled trios of European ancestry replicated the signal [Beaty et al. 2010]. In line with results from our Asian samples, Blanton et al. [2011] reported a lack of signal in chr8q24 among Hispanics. However Rojas-Martinez et al. [2010] found a significant association in Mesoamericans (Mayans) from Mexico. This difference in signal across racial groups is intriguing, especially since the first evidence pointing to chr8q24 was found in a linkage study of a large African American CL/P family [Chiquet et al. 2009], but their follow up study of the top 10 SNPs reported by Birnbaum et al. [2009] did not yield positive results in this multiplex family.
Figure 1 summarizes the significance of tests of the null hypothesis of independence between rs987525 and risk of CL/P among published samples (both case-control studies in blue; family based studies in gray). Samples of European ancestry gave highly significant results, but other ethnic groups were less consistent, even when sample sizes were larger. Several explanations are possible for this apparent population specific finding. The most
NIH-PA Author Manuscript
NIH-PA Author Manuscript
obvious one is locus heterogeneity, where distinct genes play a causal role in the etiology of non-syndromic CL/P as often suggested [Schliekelman and Slatkin, 2002] and a mutation in one causal gene is much more common in one population compared to another. One of the striking results from our GWAS was strong evidence for several markers in the IRF6 and MAFB genes among Asian families, but not among families of European ancestry, while the converse was true for chr8q24 [Beaty et al. 2010]. However, it is also possible both the chr8q24 region and the other genes are biologically relevant to the pathogenesis of CL/P in a universal manner, but minor differences in the degree of coverage provided by commercial SNP panels, on top of the genetic distance between European and Asian populations, could account for differences in strength of association signal from GWAS.
Genetic distance reflects how similar two populations are in allele frequencies, and polymorphic markers (e.g. SNPs) vary in “information content” across populations. This becomes particularly crucial for statistical power because the transmission disequilibrium test (TDT) depends directly on heterozygosity levels, as homozygous parents cannot contribute to this test statistic [Spielman et al. 1993]. Hence, low SNP information content or low heterozygosity will decrease the probability of informative mating types and reduce statistical power for the TDT. Here, we measured genetic distances among our diverse sample of CL/P case-parent trios, and show how disparate information content at markers in the SNP panel between Asians and Europeans families could partially explain differences in the GWAS signal.
Inadequate coverage of this region is another explanation for the difference in chr8q24 signal between Europeans and Asians. Our previous study identified a ~402kb region covered by 78 SNPs on the Illumina 610Quad array [Beaty et al. 2010], which is rather sparse. Assuming many more SNPs/variants exist in this region, there is the potential for imputation to provide stronger association signal among Asian families. Rare variants in chr8q24 (roughly defined as minor allele frequency, or MAF<1%) could also explain the lack of strong signal in Asian samples. On the other hand, critical unobserved variants might not be well tagged by SNPs on standard panels. In this situation, imputing additional variants (especially those with low MAF) could provide sufficient additional information to detect evidence, especially when the phased haplotypes from the 1000 Genomes Project (2010) serve as reference haplotypes. Here, we used imputation to increase the information content of our marker panel and found some evidence of association between CL/P and variants in the chr8q24 region in both European and Asian case-parent trios.
Methods and Materials
SampleAs previously reported [Beaty et al. 2010], subjects in the International Cleft Consortium were collected under a case-parent trio study design. Cases were sampled from thirteen recruitment sites (Denmark, Norway, Iowa, Maryland, Pittsburgh, Utah, Philippines, Taiwan, Singapore, Shandong Province, Sichuan Province, Hubei Province, and South Korea) in eight countries on three continents. To describe the genetic variation in this sample, we analyzed unrelated parents of a case with an isolated, non-syndromic oral cleft. We used HapMap III unrelated Yorubans (YRI), CEU, Han Chinese (CHB), Japanese (JPT), and Mexicans (MEX) as reference populations.
Genotyping
All subjects were genotyped on the 610Quad Illumina SNP Chip panel, which yielded roughly 589,763 SNPs after quality control steps [Beaty et al. 2010]. We screened for unexpected relatedness (beyond the recognized parent-child relationship intrinsic to
case-NIH-PA Author Manuscript
NIH-PA Author Manuscript
parent trios) using 98,867 randomly selected autosomal SNPs with MAF>0.05, 50th percentile GC score >80 and pairwise linkage disequilibrium (LD) measured as r2<0.3 to estimate identity by descent (IBD) sharing using PLINK (v1.07) [Purcell et al. 2007]. For pairs of individuals unexpectedly identified as either 1° or 2° relatives, one member of each pair was excluded from the subsequent principal components analysis (PCA). For PCA, we randomly selected independent SNPs under the above criteria, except with a more stringent cut point for pairwise LD of r2<0.12, which yielded 38,188 SNPs spanning all autosomal chromosomes. PCA was conducted on unrelated subjects using smartpca (Eigensoft v3.0) [Price et al. 2006] with default parameters (except for iterative removal of outliers). We ran PCA on the combined sample and on subsets by geographic region reflecting Asian and European ancestry (which included European Americans) separately. We examined the top 10 eigenvectors to summarize all genetic variance, as well as Wright’s fixation index (FST)
as a pairwise measure of genetic distance. Chr8q24 analysis
The chr8q24 region of signal for CL/P was defined as a ~402kb region extending from 129,778,467-130,181,350 (NCBI Build 36) on chromosome 8 containing 78 genotyped SNPs [Beaty et al. 2010]. For each recruitment site and the HapMap III populations, we estimated allele frequencies for all 78 SNPs, and their polymorphic information content (PIC). The region was then divided into 13 contiguous haplotypes of 6 SNPs each to assess haplotype diversity. PLINK was used to estimate haplotype frequencies within each recruitment site, which were in turn used to evaluate the percent haplotype diversity in Arlequin (v3.2.1.2) [Excoffier et al. 2010].
SNP imputation at chr8q24
In a 1MB region encompassing the chr8q24 region of strongest signal, we imputed 6,955 and 8,184 SNPs and rare variants among Asian and European parents, respectively, using the 1000 Genomes Project (June 2010), release) as a reference group. Specifically, phased haplotypes in 60 Han Chinese from Beijing (CHB) and Japanese from Tokyo (JPT) were used as a reference group for Asian trios, and phased haplotypes in 60 unrelated CEU subjects (who are of northwestern European ancestry) were used as the reference group for trios of European ancestry. Missing genotypes were inferred using BEAGLE (Browning and Browning, 2009) incorporating the known relationships to improve imputation quality, as suggested by Taub et al. [2011]. We excluded genotyped SNPs with MAF<0.01, SNPs showing >1 Mendelian errors within case-parent trios, SNPs with missing call rates >3%, and those with p<10−5 in tests of Hardy-Weinberg equilibrium. Imputed variants were analyzed using a closed-form implementation of a conditional logistic regression additive model [Schwender et al. 2011] in R (v2.13.1), both separately for each population and for a combined data set to test for SNP-population interactions.
Results
Genetic Distance among parents of CL/P cases
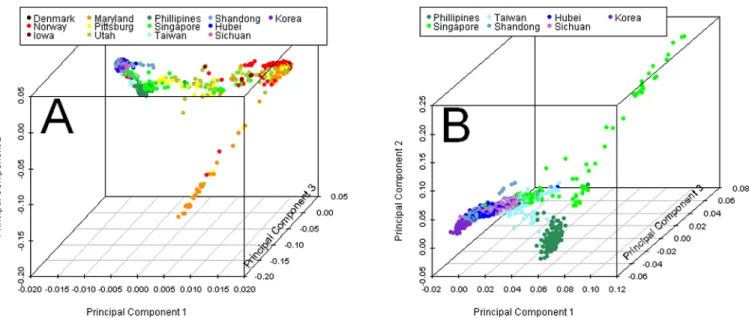
Principal components analysis (PCA) on parents of cases revealed two major clusters along the first principal component (PC1) axis, which accounted for 9.07 % of the total genetic variation among all 13 recruitment sites (Figure 2A). Parents of European ancestry clustered in the upper right, while parents of Asian ancestry formed a small cline in the upper left reflecting differences between South Korea and China in the north and Taiwan, Singapore and the Philippines in the south. As seen in Figure 2A, many individuals fell between these two major groups along PC1, with a few parents from Maryland and other US sites trailing downward (largely African Americans). Wright’s FST confirmed patterns observed in PCA
(Table S1). The largest genetic distances were between Denmark and the Asian recruitment
NIH-PA Author Manuscript
NIH-PA Author Manuscript
sites (South Korea FST=0.108, Taiwan FST =0.108, China FST =0.106, Philippines FST
=0.105, Singapore FST =0.092). FST ≈0.1 were typical between European/US sites and the
Asian sites. Pairs with an estimated FST≈0 included: Denmark-Iowa, Iowa-Utah,
Pennsylvania-Utah, Shandong Province-Sichuan Province, and Hubei Province-Sichuan Province.
A separate PCA was conducted on parents from all Asian sites to further explore the differences between Southeast Asian (primarily Filipinos) and the other East Asian samples (Figure 2B). Here, the distinction between East and Southeast Asian becomes magnified along PC1 (which absorbed only 0.68% of the total genetic variation), while some Singaporeans were widely dispersed along PC2 (which absorbed 0.38% of the variation). These Singaporean outliers were largely South Asians from India, and 2 were reportedly of African descent but turned out to be South Africans of European ancestry. Still, FST values
were relatively small between the Philippines and all other Asians sites, with South Korea showing the greatest distance from the Philippines (FST =0.022).
Haplotype diversity in chr8q24
The 78 genotyped SNPs in the chr8q24 region were divided into 13 contiguous haplotypes of 6 SNPs each. As seen in Figure 3, Asian parents had, on average, lower haplotype diversity than parents of European ancestry. However, the two groups converged at segment 10, where an apparent spike in haplotype diversity among Asians reached ~80% (with Europeans only slightly higher). The final 3 haplotypes showed much smaller differences between groups. Haplotype 12 showed the lowest haplotype diversity in samples of European ancestry (44%), and haplotype 7 showed the lowest diversity (23%) among Asian parents (n.b. this haplotype included the most significant individual SNP rs987525). Filipino parents exhibited greater haplotype diversity at each of these segments compared to other Asian sites (the highest thin blue line). As expected, there were more distinct haplotypes for each segment among Europeans, some of which were completely absent in Asians. For haplotype 8 (composed of rs7017252, rs12547241, rs11784358, rs13265167, rs9693430, and rs10956454), the TACCGC haplotype had frequencies ranging from 23% to 29% among parents of European ancestry, but this haplotype was absent among Asian parents (except among parents from Singapore who had a frequency of 3%). Interestingly, this haplotype was very strongly associated with increased risk of CL/P (p-value of 5.2×10⁻¹⁷) in a haplotypic TDT.
Heterozygosity in chr8q24
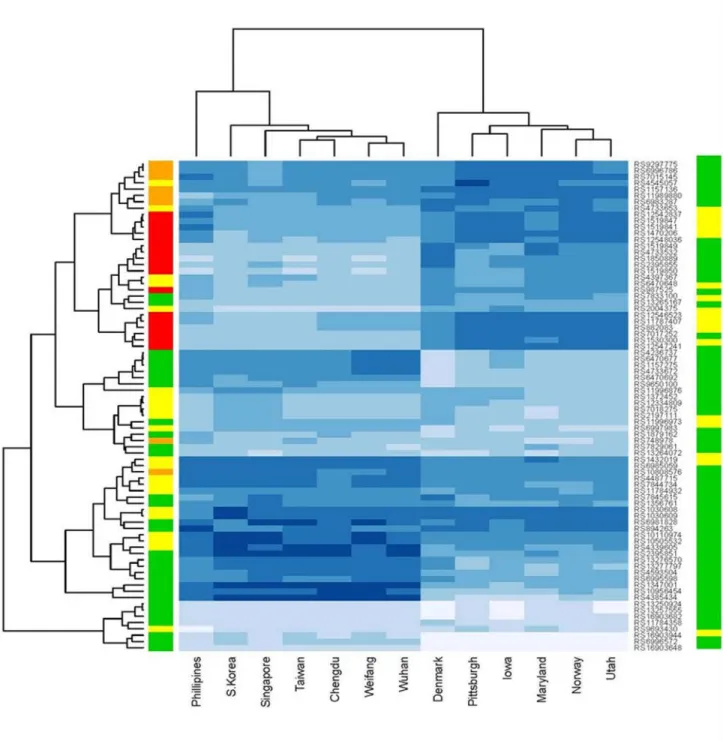
Individual SNPs giving genome-wide evidence of linkage and association in the entire group of case-parent trios showed distinct patterns of heterozygosity in trios of European ancestry (who showed average heterozygosity values ranging between 0.4 and 0.5) and trios of Asian ancestry (where these same SNPs had heterozygosity values <0.2). Hierarchical clustering of all 13 recruitment sites by SNP heterozygosity (Figure 4) yielded two major clades
reflecting clustering patterns seen in results of PCA. Recruitment sites composed largely of parents of European ancestry grouped together, and as did those recruitment sites largely of Asian ancestry. Parents from the Philippines formed a somewhat distinct branch from the other Asian sites, consistent with PCA results (Figure 2D). Denmark occupied a somewhat distinct branch from the other European/US sites in heterozygosity, however, in PCA (Figure 2A) Denmark had clustered very tightly with parents from Norway, Utah and the other US sites. This discrepancy could be due to the small sample size of this Danish group (87 parents). Clustering by heterozygosity for these 78 SNPs in chr8q24 highlighted the difference in information content between parents of Asian and European ancestry. Figure 4 shows a heatmap of heterozygosity for all 78 SNPs, and the most significant SNPs clustered together and showed high heterozygosity among parents of European ancestry, but distinctly
NIH-PA Author Manuscript
NIH-PA Author Manuscript
lower heterozygosity among Asian parents. SNPs in this region with the highest information content among Asians showed little or no evidence of association with CL/P.
Imputed SNPs/Variants Analysis
We performed imputation with BEAGLE considering the family structure in these case-parent trios, which provides much higher quality imputed data for downstream analysis [Taub et al., 2011]. The reference samples were from the 1000 Genomes Project (June 2010) release), and we performed imputation separately for the European and Asian case-parent trios, using the CEU and CHB+JPT reference panels, respectively. We analyzed variants/ SNPs imputed from 129,778,467-130,181,350 (NCBI Build 36) in the chr8q24 region using the genotypic TDT; this region contained 653 variants among Asians (Table S2) and 751 variants among Europeans (Table S3). Among these imputed variants, the most significant SNP (rs11776303) in Asians showed an odds ratio OR(case|allele T)=1.44 (95%CI: 1.18– 1.76; p=3.69×10⁻⁴) with an MAF=0.13. This variant was present in the European case-parent trios and again the T allele was the high risk allele, although here it was the major allele (frequency=0.54). In Europeans, rs11776303 gave the same estimated odds ratio OR(case|allele T)=1.44 (95% CI: 1.24–1.68; p=2.5×10⁻⁶) under an additive model. This imputed variant was 19 kb downstream of rs987525, the most significant observed SNP in the European samples which gave OR(case|allele A)=2.01 (95%CI: 1.69–2.39;
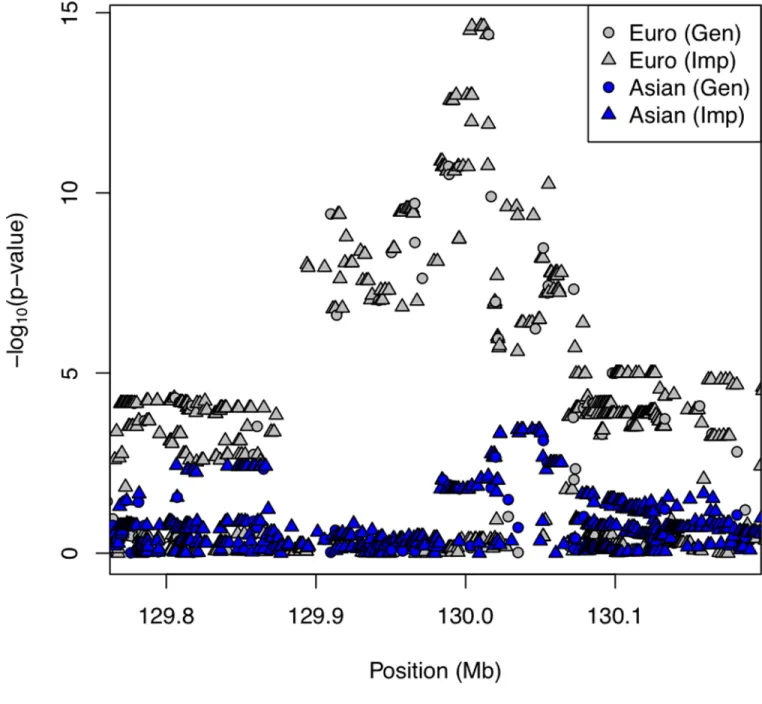
p=4.01×10⁻¹⁵ among Europeans). The European peak variant (imputed marker
chr8:130004269) was flanked by 122 markers also achieving genome-wide significance in the imputed data set (p<10−7, see Figure 5). All but one of these markers had MAF>0.2 in Europeans, while only three of these same markers had MAF>0.2 in Asians. The Asian peak variant (rs11776303) was also flanked by 12 additional markers giving p<10−3 (all had MAF<0.13). In Europeans, three of these 12 markers achieved genome-wide significance, six were nearly as significant (p<10−6), one was not significant and two were not present in the European imputation output. This indicates concordance of signal between Europeans and Asians, but again demonstrates the lack of information content among Asians.
To better understand the role of population as a mediator of genetic effects in this region, we fit a model on all CL/P case-parent trios simultaneously, including a term for population-genotype interaction that would indicate differences in transmission rates between these two populations (Table S4). Absence of any interaction could indicate the model is equally appropriate in both populations, while differences in significance for the effect sizes could simply be due to differential power (e.g. decreased heterozygosity) in one population compared to another. Interestingly, only one of the 12 markers surrounding rs11776303 (the peak SNP in Asians) showed any evidence of significant interaction (p=0.002), indicating the effect of this SNP in Europeans and Asians is quite similar for most (if not all) markers, and providing support for the hypothesis there may be a true association between markers in this region and the CL/P phenotype among Asians. However, 35 imputed markers attaining genome-wide significance in Europeans did show some evidence of possible
gene-population interaction (at p<0.01), arguing low MAF may not be the only explanation for a lack of signal in Asians.
Discussion
There are several potential explanations for the previously reported difference in strength of GWAS signal markers in 8q24 between CL/P case-parent trios of Asian and European ancestry [Beaty et al. 2010]. Locus heterogeneity is perhaps the most obvious explanation, which hypothesizes several distinct causal genes for CL/P, and these different genes have alleles varying in frequency between Asians and Europeans. Any given causal mutation might be easily documented in one group but be considerably rarer in another group, and therefore much more difficult to identify. There could also be more subtle explanations for
NIH-PA Author Manuscript
NIH-PA Author Manuscript
the discrepancy in statistical signals for linkage and association across populations. If SNPs included in a genome-wide marker array provide less coverage of LD patterns in one group, this could represent a form of bias in selecting markers on the chip. The Human610 Quad Beadchip array used here has an estimated 87% global SNP coverage among HapMap CEU individuals and 83% for HapMap CHB/JPT individuals [Li et al. 2008]. The r2 at which 95% of SNPs are tagged was 0.55 for CEU and around 0.40 for CHB/JPT [Illumina Technical Note 2010]. SNPs on this platform were all derived from HapMap II data. However, it has been noted SNP tagging coverage has an upward bias for some regions of the genome over others, and the estimated tagging coverage can be too generous when using HapMap data [Li et al. 2008]. The slightly larger LD blocks among parents of European ancestry (Figure S1a), and the shorter ones observed among Asian parents suggest the 78 typed SNPs were better tags for Europeans than for Asians.
Actual differences in heterozygosity or information content of markers could be the key factor underlying the differences in strength of association signal for CL/P and markers in 8q24 between Asians and Europeans. SNPs with the strongest association among Europeans, e.g. rs987525, had heterozygosity values of ~42% among parents of European ancestry, but much lower among Asian parents (~13%). Filipino parents had the highest heterozygosity among all Asian parents (30%), but were still lower than Europeans. This disparity in heterozygosity between Asian and European parents was apparent across all 78 genotyped SNPs in the chr8q24 region of signal, and paralleled their estimated genetic distances (see Table S1) and PCA clustering patterns. This should be expected, since genetic distance is a function of allele frequency differences across populations. Disparity in heterozygosity directly affects power of the TDT, because only trios with at least one heterozygous parent can contribute. Thus, higher heterozygosity yields more information for the TDT (e.g. for rs987525 among Asians: heterozygosity=13%, allelic TDT p=0.0089; while among Europeans: heterozygosity=42%, allelic TDT p=3.33×10⁻¹⁶). Disparity in mean haplotype diversity (Figure 3) underscores the lower information content over these 78 SNPs among Asians compared to Europeans.
A similar difference in haplotype diversity between populations of divergent ancestry was observed by Helgason et al. [2007], surrounding a SNP near TCF7L2 on chr. 10 that was strongly associated with type-2 diabetes in Europeans, but where the high risk allele was nearly absent in East Asians. Based on analysis of HapMap groups, they argued this could represent evidence of differential selection, with a lower haplotype diversity in Asians possibly reflecting a selective sweep. While we did not specifically test for evidence of selection in the 8q24 region, differences in population-level forces could explain the diversity between populations seen here. In light of the number of nearby genes implicated in other diseases, careful examination of signs of selective pressure in this region might be a fruitful area for future work
Given heterozygosity influences both selection of SNPs to be included on the array and the power of the TDT, along with relatively sparse density provided by these 78 observed SNPs in chr8q24, we enriched our marker set with imputed variants using the 1000 Genomes Project phased haplotypes as a reference. Although HapMap II data are of higher quality, these markers represent mostly common variants, and we wanted to include rarer variants available in the 1000 Genomes reference panel. For the European ancestry samples, the original genome-wide signal among the 78 genotyped SNPs was augmented and peaked around position 130.0 Mb on the physical map. For the Asian trios, a suggestive (but not genome-wide significant) peak was centered at a position less than 20kb downstream, and an imputed variant (rs11776303) gave the greatest significance. We initially performed imputation without taking family structure into account, which allowed us to better assess imputation quality, and on average imputation quality was slightly better among European
NIH-PA Author Manuscript
NIH-PA Author Manuscript
ancestry families than among Asian families. This may also be explained by differences in heterozygosity among the 78 observed SNPs between Asian and European samples, but it could reflect the greater challenges in imputing in this region in Asians due to the lower marker information content. Also, the proportion of the 78 genotyped SNPs present in reference haplotypes was lower in Asians than Europeans. For example, the most significant SNP among Europeans (rs987525) was absent in the reference panel for Asians. Here we have provided evidence to explain the apparent discrepancy in the strength of GWAS signal between markers in chr8q24 and risk of CL/P between trios of Asian and European ancestry, which will hopefully stimulate further investigating of this region. These new insights were derived solely by “in silico” methods. The next step would be to validate our findings by either genotyping imputed variants showing the most promising signals among Asian trios, or sequencing the entire region in both groups. Although the GWAS signals lie in a “gene desert”, surrounding genes (e.g. PVT1, MYC, GSDMC and ASAP1) have been implicated in several cancers. One imputed SNP in European trios (rs17241908) which showed evidence of association and linkage with CL/P (p=4.01×10⁻¹⁵) lies in a putative transcription factor binding site identified by Chromatin ImmunoPrecipitation assays followed by sequencing (ChIP-seq) (see Figure S2). Other 8q24 markers in this gene desert are associated with increased risk for prostate, breast and colon cancer [Ahmadiyeh et al., 2010]. Some of these have yielded evidence of epigenetic modification and demonstrated tissue-specific interactions with the MYC oncogene. Bille et al. [2005] reported a higher rate of cancer in patients with oral clefts which could, in part, be due to the action of enhancers in 8q24 resulting in abnormal MYC expression. Several microRNA genes (which regulate gene expression after transcription) are also located nearby. None of these genes has been implicated in the etiology of CL/P, but they make chr8q24 a compelling region for further investigation. Finally, this study illustrates the power and limitations of imputation to detect signals originally missed by genome wide marker panels.
Supplementary Material
Refer to Web version on PubMed Central for supplementary material.
Acknowledgments
We sincerely thank all of the families at each recruitment site for participating in this international study, and we gratefully acknowledge the invaluable assistance of clinical, field and laboratory staff whose contributions made this work possible. Funding to support data collection, genotyping and analysis came from several sources, some to individual investigators and some to the cleft consortium itself. The International Cleft Consortium was part of the Gene, Environment Association Studies (GENEVA) Consortium funded by the National Human Genome Research Institute (NHGRI) to enhance communication and collaboration among researchers conducting genome-wide studies of complex diseases. Our group benefited greatly from the work and efforts of the entire consortium, especially the Coordinating Center (directed by B. Weir and C. Laurie of the University of Washington) in data cleaning and preparation for submission to the Database for Genotypes and Phenotypes (dbGaP). We also acknowledge the leadership of T. Manolio of NHGRI and E. Harris of National Institute of Dental and Craniofacial Research (NIDCR). Genotyping services were provided by the Center for Inherited Disease Research (CIDR), funded through a federal contract from the US National Institutes of Health (NIH) to Johns Hopkins University (contract number HHSN268200782096C), and we wish to thank Drs. K. Doheny, E.W. Pugh and H. Ling in particular. The GWAS was supported by the NIDCR through U01-DE-018993; “International Consortium to Identify Genes & Interactions Controlling Oral Clefts”, TH Beaty, PI. Funding for individual investigators include: R01-DE-014581 (THB); R37-DE08559 (JCM, MLM), R01-DE016148 (MLM), P50-DE016215 (JCM, MLM), R21-DE016930 (MLM). Smile Train Foundation supported data collection in Chengdu (BS). This research was supported in part by the Intramural Research Program of the NIH, National Institute of Environmental Health Sciences (AJW). The content is solely the responsibility of the authors and does not necessarily represent the official views of the NIDCR, nor the NIH.
NIH-PA Author Manuscript
NIH-PA Author Manuscript
References
Durbin RM, Abecasis GR, Altshuler DL, Auton A, Brooks LD, et al. 1000 Genomes Project Consortium. A map of human genome variation from population-scale sequencing. Nature. 2010; 467:1061–1073. [PubMed: 20981092]
Ahmadiyeh N, Pomerantz MM, Grisanzio C, Herman P, Jia L, et al. 8q24 prostate, breast, and colon cancer risk loci show tissue-specific long-range interaction with MYC. Proc Natl Acad Sci U S A. 2010; 25(107(21)):9742–9746. [PubMed: 20453196]
Barrett JC, Cardon LR. Evaluating coverage of genome-wide association studies. Nat. Genet. 2006; 38:659–662. [PubMed: 16715099]
Beaty TH, Murray JC, Marazita ML, Munger RG, Ruczinski I, et al. A genome-wide association study of cleft lip with and without cleft palate identifies risk variants near MAFB and ABCA4. Nat Genet. 2010; 42:525–529. [PubMed: 20436469]
Bille C, Winther JF, Bautz A, Murray JC, Olsen J, et al. Cancer risk in persons with oral cleft--a population-based study of 8,093 cases. Am J Epidemiol. 2005; 161(11):1047–1055. [PubMed: 15901625]
Birnbaum S, Ludwig KU, Reutter H, Herms S, Steffens M, et al. Key susceptibility locus for nonsyndromic cleft lip with or without cleft palate on chromosome. Nat Genet. 2009; 41:473–477. [PubMed: 19270707]
Blanton SH, Burt A, Stal S, Mulliken JB, Garcia E, et al. Family-based study shows heterogeneity of a susceptibility locus on chromosome 8q24 for nonsyndromic cleft lip and palate. Birth Defects Res A Clin Mol Teratol. 2010; 88(4):256–259. [PubMed: 20196142]
Browning BL, Browning SR. A unified approach to genotype imputation and haplotype phase inference for large sets of trios and unrelated individuals. Am J Hum Genet. 2009; 84:210–223. [PubMed: 19200528]
Chiquet BT, Hashmi SS, Henry R, Burt A, Mulliken JB, et al. Genomic screening identifies novel linkages and provides further evidence for a role of MYH9 in nonsyndromic cleft lip and palate. Eur J Hum Genet. 2009; 17:195–204. [PubMed: 18716610]
Excoffier L, Laval G, Schneider S. Arlequin ver. 3.0: An integrated software package for population genetics data analysis. Evolutionary Bioinformatics Online. 2005; 1:47–50. [PubMed: 19325852] Grant SF, Wang K, Zhang H, Glaberson W, Annaiah K, et al. A genome-wide association study
identifies a locus for nonsyndromic cleft lip with or without cleft palate on. J Pediatr. 2009; 155(6):909–913. [PubMed: 19656524]
Helgason A, Palsson S, Throleifsson G, Grant SFA, Emilsson V, et al. Refining the impact of TCF7L2 gene variants on type 2 diabetes and adaptive evolution. Nat. Genet. 2007; 39:218–225. [PubMed: 17206141]
Illumina Technical Note. The power of intelligent SNP selection. 2010. http://www.illumina.com/ Documents/products/technotes/technote_intelligent_snp_selection.pdf
Li M, Li C, Guan W. Evaluation of coverage variation of SNP chips for genome-wide association studies. Eur J Hum Genet. 2008; 16:635–643. [PubMed: 18253166]
Mostowska A, Hozyasz KK, Wojcicki P, Biedziak B, Paradowska P, et al. Association between genetic variants of reported candidate genes or regions and risk of cleft lip with or without cleft palate in the Polish population. Birth Defects Res A Clin Mol Teratol. 2010; 88(7):538–545. [PubMed: 20544801]
Nikopensius T, Ambrozaityte L, Ludwig KU, Birnbaum S, Jagomägi T, et al. Replication of novel susceptibility locus for nonsyndromic cleft lip with or without cleft palate on chromosome 8q24 in Estonian and Lithuanian patients. Am J Med Genet A. 2009; 149A(11):2551–2553. [PubMed: 19839039]
Patterson N, Price AL, Reich D. Population structure and eigenanalysis. PLoS Genetics. 2006; 2:e190. [PubMed: 17194218]
Purcell S, Neale B, Todd-Brown K, Thomas L, Ferreira M, et al. PLINK: a toolset for whole-genome association and population-based linkage analysis. Amer J Hum Genet. 2007; 81:559–575. [PubMed: 17701901]
NIH-PA Author Manuscript
NIH-PA Author Manuscript
Rojas-Martinez A, Reutter H, Chacon-Camacho O, Leon-Cachon RB, Munoz-Jimenez M, et al. Genetic risk factors for nonsyndromic cleft lip with or without cleft palate in a Mesoamerican population: Evidence for IRF6 and variants at 8q24 and 10q25. Birth Defects Res A Clin Mol Teratol. 2010; 88(7):535–537. [PubMed: 20564431]
Schliekelman P, Slatkin M. Multiplex relative risk and estimation of the number of loci underlying an inherited disease. Am J Hum Genet. 2002; 71:1369–1385. [PubMed: 12454800]
Schwender H, Taub MA, Beaty TH, Marazita ML, Ruczinski I. Rapid testing of SNPs and gene-environment interactions in case-parent trio data based on exact analytic parameter estimates. Biometrics. 2011 (in press).
Spielman RS, McGinnis RE, Ewens WJ. Transmission test for linkage disequilibrium: the insulin gene region and insulin-dependent diabetes mellitus (IDDM). Amer J Hum Genet. 1993; 52:506–516. [PubMed: 8447318]
Taub M, Schwender H, Beaty TH, Louis TA, Ruczinski I. Incorporating genotype uncertainty into the genotypic TDT for main effects and gene-environment interactions. Genet Epidemiol. 2012 (in press).
NIH-PA Author Manuscript
NIH-PA Author Manuscript
Figure 1. P-values for rs987525 on chr8q24 in tests of association with CL/P from published studies
Blue circles denote case-control studies and gray circles denote case-parent trio studies. The radius of the circles is proportional to the number of CL/P cases.
NIH-PA Author Manuscript
NIH-PA Author Manuscript
Figure 2. Three-dimensional scatter plots of principal components (PC) from PCA on parents from 13 sites
A) PC1–PC3 for all parents color coded by recruitment site. B) PC1-PC3 from PCA on parents only from Asian recruitment sites.
NIH-PA Author Manuscript
NIH-PA Author Manuscript
Figure 3. Estimated haplotype diversity over 13 6-SNP haplotypes covering 78 SNPs in 8q24 The Y–axis represents haplotype diversity, where the maximum diversity is 1. Values plotted at X-axis locations represent the midpoint of each haplotype. Thin lines are plotted for each population, with thicker lines showing the mean within Europeans (gray) and Asians (blue), respectively. For these European and Asian mean values, vertical bars indicate two standard errors in each direction as computed from Arlequin output. In Asians, the highest line blue represents haplotype diversity among parents from the Philippines. Ticks along the top axis indicate haplotype numbers referred to in the text.
NIH-PA Author Manuscript
NIH-PA Author Manuscript
Figure 4. Heterozygosity heatmap for 78 SNPs clustered by SNP and recruitment site
Darker blue corresponds to higher heterozygosity. Colored sidebar on the right represents p-values from TDT at that SNP among Asians, and the left sidebar represents p-p-values for Europeans. In sidebars, red indicates SNPs yielding p<10−6, orange 10−6<p<10−4, yellow
10−4<p<10−2 and green for non-significant SNPs (p>0.05).
NIH-PA Author Manuscript
NIH-PA Author Manuscript
Figure 5. −Log10(p) from genotypic TDT using imputed variants in 8q24 on European and Asian trios
Gray circles/triangles represent SNPs/variants genotyped/imputed (respectively) in trios of European ancestry; blue circles/triangles represent results for trios of Asian ancestry. In this region of 8q24 (hg18 chr8:129.8–130.2 Mb), 751 and 653 imputed SNPs/variants in Europeans and Asians, respectively, passed QC thresholds and added to the analysis (haplotypes from 1000 Genomes samples served as reference). Markers exhibiting suggestive results were seen among these Asian trios about 19kb downstream from rs987525, the most significant observed SNP among European trios.