서 론
CT(computed tomography) 조영 검사에서는 비침습적 의 장점을 가지고 있으나 피폭선량에 대한 우려로 선량감 소를 위해 노력하고 있으며, 이러한 CT 영상의 진단을 위 해 조영제를 주입하여 조영제 증강의 최적 시간을 적용하 는 bolus tracking technique을 이용하여 조영증강에 따른 최
적의 진단적 가치가 높은 영상을 획득하여 임상에서 적용하 고 있다(Kirchner et al. 2000). 이러한 CT 검사에서는 bolus tracking technique으로 혈관에 주입된 조영제를 실시간으로 조영증강의 정도를 최적화하기 위해 검사자의 혈관 내부에 관심영역(ROI; region of interest)을 설정하고 조영제 HU (Hounsfield Unit)의 문턱(threshold) 값을 설정하고 조영제 자동주입기를 이용하여 조영제 주입과 함께 조영증강의 정 도를 실시간으로 추적하면서 모니터링하여 조영제 주입 전 에 관심영역에 설정된 문턱 값에 조영제 증강 정도가 도달 하였을 때 CT 스캔하는 전향적 검사 기법으로 혈관 및 심
CTDI
팬텀을 이용한
CT
검사에서
Bolus Tracking Technique
의 선량 평가
권 대 철1· 최 지 원2,*
1신한대학교 바이오생태보건대학 방사선학과, 2전주대학교 방사선학과
Analysis of Radiation Dose for the Bolus Tracking Technique
using the CTDI Phantom of CT Study
Dae Cheol Kweon
1and Jiwon Choi
2,*
1Department of Radiological Science, College of Bioecological Health,
Shinhan University, Uijeongbu 11644, Republic of Korea
2Department of Radiological Science, Jeonju University, Jeonju 55069, Republic of Korea
Abstract - The purpose of this study is to measure the dose using head and body CTDI phantom, and the bolus tracking technique according to monitoring for CT study. CT-dose-index(CTDI) phantoms of the head and body were used to measure dose in CT using the bolus tracking technique. Scout scans were applied with a tube voltage of 120kVp and a tube current of 30mAs in the head and CTDI body phantom. Bolus tracking technique scanning was performed at 20 mAs for monitoring and 0.5sec, B30f(medium smooth) kernel and 2.0mm thickness. For dose measurement, the dose including scout monitoring was measured five times using an ionization chamber(UNFORS Xi, Raysafe AB, Billda, Sweden) dosimeter in the center of the head and body phantom. The effective dose was 0.018mSv for the head phantom multiplied by k(conversion coefficients) by DLP and 0.066mSv for the body phantom. Even if the radiation dose from monitoring is low, it can be applied as a basic data effectively to reduce the dose from monitoring in the clinical trial for patients.
Key words : Bolus tracking system, CT, CTDI, Effective dose
─ 229 ─
Technical Paper
* Corresponding author: Jiwon Choi, Tel. +82-63-220-3260 Fax. +82-63-220-2054, E-mail. [email protected]
장조영 및 소화기 계통의 검사에 적용되고 있다(Irie et al. 1995; Dinkel et al. 1998; Kweon et al. 2016).
기존 연구에서는 bolus tracking technique은 FBP(filtered back projection) 방법 및 반복 재구성 알고리즘을 사용하여 얻은 모니터링 용량을 최적화하는 것이었다. 다른 체중에 따라 그룹화된 환자에서 스캔 시작 시간의 효과를 평가하기 위한 연구가 수행되었다. 이때에 적용된 관전류는 10, 20, 30 및 50mA을 적용하여 보고하였다(Ishikawa et al. 2017).
CT 검사에서 조영제가 검사부위에 도달하는 최적의 조영 증강 시간을 모니터링하기 위해 임상에서 적용되는 bolus tracking technique은 방사선 선량에 대한 기여에 대해서는
간과되고, 중요성은 낮게 평가되어 있어 선량을 감소하여
검사하는 현재의 관점에서 bolus tracking technique 의 매개 변수 최적화의 중요성이 과소 평가되어 있다고 보고하였다 (Matsumoto et al. 2018).
이에 본 연구에서는 연구의 목적을 CT 검사에서 조영제
의 증강 정도를 위해 검사부위를 모니터링에 따른 bolus tracking technique을 두부 CTDI 팬텀 및 복부 CTDI 팬텀을 이용하여 선량을 측정하여 임상에서 적용할 수 있는 기초자
료를 제공하여 CT검사에 따른 선량을 감소하는 데 목적이
있다.
재료 및 방법
Bolus tracking technique를 이용한 CT에서 선량을 측정 하기 위해 아크릴 재질의 두부 및 복부의 CTDI (CT-dose-index) 팬텀을 이용하여 스캔하였다. 스캔은 두부 CTDI 팬텀 에서 관전압 120kVp, 관전류 30mAs를 적용하였고, CARE dose 4D는 scout 스캔에는 적용하여 스캔하였으나 bolus tracking technique 스캔에서는 적용하지 않고 스캔하였다.
1. Bolus tracking technique
Bolus tracking technique은 검사 목적에 따라 동맥혈관에 관심영역을 설정하고 pre-monitoring 후에 조영제를 주입하
고 10초 후에 모니터링을 2~3간격으로 스캔하여 검사하였
다(Kweon et al. 2009). Bolus tracking technique은 CARE
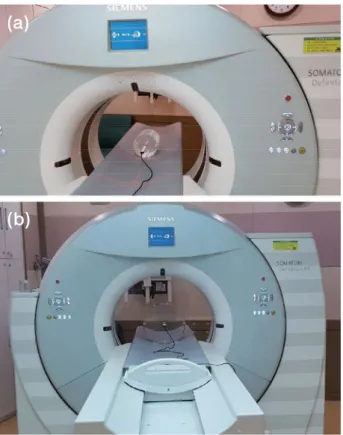
(combined applications to reduce exposure) Bolus 소프트웨 어(Siemens Healthcare, Forcheim, Germany)를 이용하여 스 캔하였다(Fig. 1). 2. CT 스캔 CT 스캔에서 관전압은 120kVp를 이용하였고, 관전압 의 적용은 scout 영상에서는 30mAs, 모니터링에서는 20 mAs를 적용하였고, 스캔은 두부팬텀과 복부팬텀을 이용하 여 측정하였다. 두부는 16cm이고, 복부는 32cm이다. Bolus tracking technique 스캔은 128-row CT scanner(Somatom Definition AS+, Siemens Healthcare, Forcheim, Germany)를 이용하여 스캔하였다. 관전압 120kVp, 관전류는 scout에서 30mAs, 모니터링은 20mAs, ROT는 0.5sec, B30f(medium smooth) kernel, 2.0mm thickness로 스캔하였다(Fig. 2).
3. 선량 측정
연구에 이용한 CTDI 팬텀은 PMMA(polymethyl metha crylate)의 재질로 이루어져 있고, 두부 CTDI 팬텀은 직경이 16cm이고, 복부 CTDI 팬텀은 직경이 32cm이며 모두 길이 는 15cm으로 제작된 CTDI 팬텀을 이용하여 선량을 측정하 였다(Fig. 3).
Bolus tracking technique의 모니터링 스캔에서 선량 측 정을 위해 두부와 복부팬텀의 중심부에 ionization chamber (UNFORS Xi, Raysafe AB, Billda, Sweden) 선량계를 이용
하여 선량을 측정하였다. DLP에 선량지수를 곱하여 유효선
량(effective radiation dose)을 측정하였다.
CT 스캔에서 콘솔의 dose report에 표시되는 CTDIvol 및 DLP(dose length product)는 두부 및 복부 CTDI 팬텀의 16 cm와 32cm를 이용하고 있다(Jessen et al. 1999).
DLP=CTDIvol×irradiated length
유효선량의 산출을 위해 본 연구에서는 ICRP(International Commission on radiological Protection) 103 기반의 조직가 중인자를 적용하여 유효선량을 산출하였다. 두부 팬텀에 서 모니터링에 따른 스캔의 유효선량은 DLP에 0.021의 k
(conversion coefficients)를 곱하여 산정하였고, 복부 팬텀에 서는 DLP에 0.015의 k(conversion coefficients)를 곱하여 산 정하였다(Shrimpton 2004; Shrimpton et al. 2005; Christner et al. 2010).
E(effective dose)=k×DLP
Bolus tracking technique의 모니터링을 4~5회가 적용되 어 스캔한 보고가 있어 임상에서 적용되는 선량을 측정하기 위해 scout 모니터링을 포함한 선량은 5회 측정하였다(Kim
et al. 2016).
두부 CTDI 팬텀과 복부 CTDI 팬텀에 ionization chamber 를 중심부에 위치하게 하여 Fig. 4와 Fig. 5와 같이 스캔하고
선량을 측정하였다.
결 과
Bolus tracking technique을 적용하여 두부 CTDI 팬텀을 이용한 선량의 선량측정 결과는 Table 1과 같이 측정되었다. 두부 CTDI 팬텀에서 관전압 120kVp에서 scout 스캔의 선량 은 345.3μGy, CTDIvol 3.86, DLP 3.9mGy·cm이었고, 모니 터링이 선량은 첫 번째 233.3μGy, 두 번째 457.4μGy, 세 번 째 681.35μGy, 네 번째 9032.3μGy로 누적 조사선량이 측정 되었고, CTDIvol 및 DLP가 선형으로 증가하였다(Table 1).
Bolus tracking technique을 적용하여 복부 CTDI 팬텀을 이용한 선량의 선량측정 결과는 Table 2와 같이 측정되었다. 복부 CTDI 팬텀에서 관전압 120kVp에서 scout 스캔의 선 량은 115.6μGy, CTDIvol 1.81, DLP 1.81mGy·cm이었고, 모니터링이 선량은 첫 번째 81.5μGy, 두 번째 150.4μGy, 세 번째 220.6μGy, 네 번째 301.8μGy로 누적 조사선량이 측정 되었고, CTDIvol 및 DLP가 선형으로 증가하였다(Table 2).
Bolus tracking technique에서 모니터링에 따른 유효선량 은 스캔 후에 콘솔의 모니터에 표시되는 dose report의 DLP 에 k(conversion coefficients)을 곱하여 산출한 유효선량은 두부 CTDI 팬텀은 0.018mSv이었고, 복부 CTDI 팬텀에서 는 0.066mSv로 산출되었다.
Bolus tracing technique을 적용한 모니터링 스캔에서 관 전압을 30mAs를 적용한 경우에 선량이 20mAs를 적용한 첫 번째 모니터링 스캔에 비해 높게 측정되었고, 두부 CTDI
팬텀의 모니터링 스캔의 선량이 복부 CTDI 팬텀을 적용한
경우보다 선량이 높게 측정되었다(Fig. 6).
Fig. 3. CTDI phantom of radiation dose measurement geometry. The length of CTDI phantom is 15cm. The head CTDI phantom is 16cm in diameter, whereas body phantom is 32cm in diameter.
Fig. 2. CT scanning and dose calculation of CTDI head(a) and body phantom(b).
(a)
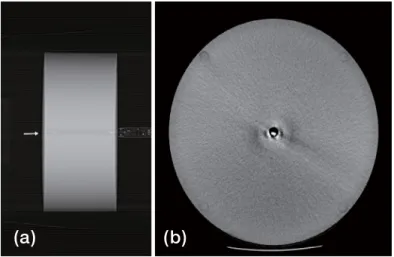
Fig. 4. CT image acquisition with scout image with ionization chamber of arrow(a) and CTDI head phantom(b) for measurement of radia-tion dose.
(a) (b)
Fig. 5. CT image acquisition with scout image with ionization chamber of arrow(a) and CTDI body phantom(b) image for measurement of radiation dose.
(a) (b)
Table 2. Bolus tracking system used of radiation dose and parameters for body CTDI phantom
Tube Voltage
(kV) Tube Current (mA) Absorbed Dose (μGy) CTDIvol (mGy·cm)DLP Effective Dose (mSv)
120 30 Pre-monitoring 115.6 1.81 1.81 0.066 20 1st monitoring 81.5 1.13 1.1 20 2nd monitoring 150.4 2.25 2.23 20 3rd monitoring 220.6 3.37 3.33 20 4th monitoring 301.8 4.49 4.43
Table 1. Bolus tracking system used of radiation dose and parameters for head CTDI phantom
Tube Voltage
(kV) Tube Current (mA) Absorbed Dose (μGy) CTDIvol (mGy·cm)DLP Effective Dose (mSv)
120 30 Pre-monitoring 345.3 3.86 3.9 0.018 20 1st monitoring 233.5 2.41 2.4 20 2nd monitoring 457.4 4.81 4.8 20 3rd monitoring 681.5 7.21 7.2 20 4th monitoring 902.3 9.61 9.6
고 찰
최근에 MDCT는 혈관 조영술 및 역동적인 검사에 이용
되고 있으며 이러한 CT 검사는 비침습적이며 더 적은 모 션 아티팩트를 획득하여 저렴한 비용으로 매우 민감한 영 상을 획득하고 있다(Napoli et al. 2004; Wintersperger et al. 2005). 이러한 CT 검사는 bolus tracking technique을 이용하 여 검사하고 있으며 동일한 영역에 관심영역을 설정하여 자 동주입기를 이용하여 조영제을 주입하고 조영제의 증강에 따라 문턱 값에 도달 여부를 확인하기 위해(McCollough et al. 2011) 모니터링 스캔은 반복적으로 이루어지고 환자는 방사선 선량에 노출된다(Nakajima et al. 1998).
기존에 보고된 CT 검사에서 bolus tracking technique을 이용한 선량에 대한 보고는 10, 20, 30 및 50mA에서 1.31, 2.65, 3.93 및 6.56mGy였다(Ishikawa et al. 2017).
Bolus tracking technique과 혈관조영검사의 유효선량에 대한 기존 보고는 bolus tracking technique에서 0.32±0.14 mSv를 보고하였고, 이러한 연구는 혈관조영검사에서 매개 변수인 관전압과 관전류를 조정하여 영상의 질에 관계없 이 선량을 감소하여 CT 검사에 적용할 수 있다고 보고하 였다(Matsumoto et al. 2018). 본 연구에서 두부 CTDI 팬텀 0.018mSv, 복부 CTDI 팬텀 0.066mSv로 혈관조영검사에서 bolus tracking technique에서 산출한 유효선량에 비해 적게
산출되었다. 이는 환자를 대상으로 혈관조영검사를 하였고, 120kVp, 50mAs를 적용하여 스캔하였으나(Matsumoto et al. 2018) 본 연구는 팬텀을 이용하여 측정하여 적게 산출된 것으로 생각된다. 본 연구에서는 이러한 선량감소를 위해 임상에 적용할 수 있는 근거를 마련하고자 두부 및 복부의 CTDI 팬텀을 적용 하여 선량을 측정하여 임상에서 적용할 수 있도록 자료를
제공하여 bolus tracking technique을 이용하여 선량을 감소 하는 데 의의가 있는 연구이다. 임상에서는 환자를 위한 CT 영상 검사에서 관전압을120 kVp을 사용하여 좋은 품질의 영상을 획득하고 있다(Heyer et al. 2007). 이에 본 연구에서는 다른 관전압을 적용하지 않고 120kVp를 CTDI 팬텀을 이용하여 모니터링 스캔에 따른 선량을 산출하였다. Kweon 등의 보고에서도 관전압 120kVp, 20mAs를 적용 하여 폐색전증 CT 검사에서 bolus tracking technique을 적
용한 폐색전증 CT 검사에서 조영제 상지를 이용한 검사에 서는 모니터링이 1.8회였고, 하지를 이용한 모니터링은 9.3 회로 이러한 CT 검사의 조영제 주입에 따른 bolus tracking technique을 이용한 조영제 주입의 모니터링의 횟수를 줄 여 CT 검사를 하여 선량 감소를 위해 노력해야 한다고 보 고하였다(Kweon et al. 2009). 그러므로 연구의 목적에 따라 bolus tracking technique의 선량을 측정하는 데 의의가 있다.
선량감소를 위한 CT 검사에서 적용할 수 있는 bolus tracking technique의 연구는 아래와 같은 연구의 제한점이 있다. 첫째, 임상에서 실제 환자를 대상으로 실험한 자료가 아닌 가상의 두부 및 복부 CTDI 팬텀을 적용하여 선량을 측정하여 추후 실제 환자의 선량을 측정하는 연구가 필요하 다. 둘째, 관전압을 고정된 120kVp로 하나의 관전압을 적용 하였고, 관전류도 20mAs로 설정하여 연구하였다. 관전압을 다양한 80, 100, 140kVp 및 여러 종류의 관전류를 적용하여 선량을 측정하는 연구가 필요하다. 기존 연구에서도 관전압 과 관전류를 100kVp, 50mA와 120kVp, 30mA로 설정하여 혈관조영술에 적용하였을 때 영상이 유의미한 차이가 없어 관전압을 낯춘 100kVp를 이용하여 선량감소를 위해 권고 하기도 했다(Kweon et al. 2017; Moynihan et al. 2017).
이러한 연구의 제한점을 적용하여 추후에 추가적인 연구
Absorbed dose
(μGy)
Fig. 6. Radiation dose for the bolus tracing technique of monitoring in CT scanning.
1st monitoring
가 필요하다. 세 번째는 CTDI 팬텀을 이용하여 선량감소를 목적으로 연구한 분야를 실제적으로 임상에서 환자를 대상 으로 bolus tracking technique을 적용한 CT검사에서 주입
된 조영제의 HU를 측정하여 조영제 농도가 설정된 문턱 값
에 도달하여 선량감소가 실제 이루어지는지를 추후 연구 할 필요가 있다. 이러한 CTDI 팬텀과 관련된 bolus tracking technique의 연구 제한점을 참고하여 추가적으로 연구하여 추후에 보고하고자 한다.
결 론
CT 검사에서 적용되는 bolus tracking technique에서 모니 터링에 따른 유효선량은 두부 팬텀은 0.018mSv였고, 복부 팬텀에서는 0.066mSv로 산출되었다. 모니터링에 따른 방사 선 선량이 저선량이어도 환자를 대상으로 하는 임상에서는 모니터링에 따른 선량을 저감하는 데 유효하게 기초 자료로 적용할 수 있다.
참 고 문 헌
Christner JA, Kofler JM and McCollough CH. 2010. Estimat-ing effective dose for CT usEstimat-ing dose-length product com-pared with using organ doses: consequences of adopting International Commission on Radiological Protection pub-lication 103 or dual-energy scanning. AJR Am. J. Roentge-nol. 194(4):881-889.
Dinkel HP, Fieger M, Knüpffer J, Moll R and Schindler G. 1998. Optimizing liver contrast in helical liver CT: val-ue of a real-time bolus triggering techniqval-ue. Eur. Radiol.
8(9):1608-1612.
Heyer CM, Mohr PS, Lemburg SP, Peters SA and Nicolas V. 2007. Image quality and radiation exposure at pulmonary CT angiography with 100- or 120-kVp protocol: prospec-tive randomized study. Radiology 245(2):577-583.
Irie T, Suzuki S, Yamauchi T and Kusano S. 1995. Prediction of the time to peak hepatic enhancement to optimize con-trast-enhanced spiral-CT. Acta. Radiol. 36(2):154-158. Ishikawa Y, Urikura A, Yoshida T, Takiguchi K and Nakaya Y.
2017. Radiation dose optimization for the bolus tracking technique in abdominal computed tomography: usefulness of real-time iterative reconstruction for monitoring scan. Radiol. Phys. Technol. 10(2):155-160.
Jessen KA, Shrimpton PC, Geleijns J, Panzer W and Tosi G. 1999. Dosimetry for optimisation of patient protection in computed tomography. Appl. Radiat. Isot. 50:165-172. Kim MS, Lee JW, Kim SG and Kweon DC. 2017. Radiation
dose and image quality assessment of the bolus timing method for CT angiography. Iran. J. Radiol. 14(2):e31918. Kirchner J, Kickuth R, Laufer U, Noack M and Liermann D.
2000. Optimized enhancement in helical CT: experienc-es with a real-time bolus tracking system in 628 patients. Clin. Radiol. 55(5):368-373.
Kweon DC and Lee YG. 2016. Detection for contrast media extravasation using bolus tracking systems of CT. J. Inst. Electron Inf. Eng. 53(9):1435-1440.
Kweon DC, Jung JE, Ryu YH and Chung WK. 2009. Compari-son radiation dose with upper and lower limbs of automated injection of contrast media with a bolus tracking system in pulmonary embolism MDCT. J. Radiat. Ind. 3(4):232-328. Matsumoto JKN, Assuncao-Jr AN, Dantas Junior RN,
Arau-jo-Filho JAB, Andrade SS, Nomura CH and Parga JR. 2018. Radiation dose reduction by adjusting bolus tracking parameters in a 320-detector row scanner. J. Cardiovasc. Comput. Tomogr. 12(4):312-315.
McCollough CH, Leng S, Yu L, Cody DD, Boone JM and McNitt-Gray MF. 2011. CT dose index and patient dose: they are not the same thing. Radiology. 259(2):311-316. Moynihan WA, Bowden L, Kiely P and O’Brien JM. 2017. A
comparison of 100kvp versus 120kvp CTPA acquisition with direct comparisons of test bolus and bolus tracking at same and different voltages in a multi detector 64 slice ct scanner. Int. J. Radiol. Radiat. Ther. 4(2):363-368.
Nakajima Y, Yoshimine T, Yoshida H, Sakashita K, Okamoto M, Kishikawa M, Yagi K, Yokota J and Hayakawa T. 1998. Computerized tomography angiography of ruptured cere-bral aneurysms: factors affecting time to maximum con-trast concentration. J. Neurosurg. 88(4):663-669.
Napoli A, Fleischmann D, Chan FP, Catalano C, Hellinger JC, Passariello R and Rubin GD. 2004. Computed tomography angiography: state-of-the-art imaging using multidetec-tor-row technology. J. Comput. Assist. Tomogr. 28(Suppl 1):S32-45.
Shrimpton P. 2004. Assessment of patient dose in CT. In: EUR. European guidelines for multislice computed tomography funded by the European Commission 2004: contract num-ber FIGMCT2000-20078-CTTIP. Luxembourg, Luxem-bourg: European Commission, 2004: Appendix C.
Shrimpton PC, Hillier MC, Lewis MA and Dunn M. Doses from computed tomography(CT) examinations in the UK: 2003 review. Chilton, UK: National Radiological Protec-tion Board, 2005: report NRPB-W67.
Wintersperger B, Jakobs T, Herzog P, Schaller S, Nikolaou K, Suess C, Weber C, Reiser M and Becker C. 2005. Aor-to-iliac multidetector-row CT angiography with low kV settings: improved vessel enhancement and simultaneous reduction of radiation dose. Eur. Radiol. 15(2):334-341.
Received: 30 June 2019 Revised: 16 July 2019 Revision accepted: 29 July 2019