서 론
CT(computed tomography)에서는 조영제를 이용하여 환 자의 진단에 활용되고 있다. 이러한 조영제는 주입에 따른 부작용을 수반한다. 수용성 및 비이온성 조영제가 신장을 통 해 배설하고 있다. 이러한 배설은 신장이 중요한 역할을 하 고 있다.사구체여과율(eGFR; estimated glomerular filtration rate)
은 신장의 기능을 나타내는 척도로서 신장에 적정투여용량 결정을 위한 방법으로 이러한 사구체여과율은 신장이 일정 한 시간에 특정물질을 완전히 제거할 수 있는 혈장량으로 정의하고 있으며, 신장의 기능 평가에 대한 중요한 척도로 활용되고 있다(Song et al. 2008). 임상에서는 몸에서 생성되 어 배설되는 크레아티닌(creatinine)의 혈장농도를 통해 사 구체여과율을 평가하고 있다. 만성 신부전은 전세계적으로 증가하고 있는 추세이고(Lysaght et al. 2002), 미국에서 만
조영제 증강
CT
검사 환자에서
eGFR
을 적용한 부작용 분석
김 명 성1· 권 대 철2,* 1국립암센터 영상의학과, 2신한대학교 바이오생태보건대학 방사선학과Analysis of eGFR Calculator in Patients
Undergoing Contrast Media Enhanced CT Examination
Myeong Seong Kim
1and Dae Cheol Kweon
2,*
1Department of Radiology, National Cancer Center, Goyang 10408, Republic of Korea 2Department of Radiological Science, College of Bioecological Health, Shinhan University,
Uijeongbu 11644, Republic of Korea
Abstract - The purpose of this study was to investigate creatinine and estimated glomerular
filtra-tion rate(eGFR) in patients with CT using eGFR, and to provide a baseline data to prevent
con-trast induced nephropathy(CIN) To provide basic data. Patients who visited the hospital for CT
examination were injected with contrast medium and examined for side effects. Contrast medium injection rate, injection rate, adverse reations, type of contrast agent, sex, and creatinine were en-tered into eGFR. The study of side effects of contrast media was conducted with the consent of the patients and the adverse effects following contrast injection were investigated according to the study ethics guidelines. Twenty-four patients with adverse drug reactions were included in the CT scan.
Contrast medium was injected from a minimum of 80ml to a maximum of 120ml, and the
injec-tion rate per second was from 1.7ml·s-1 to 4.5ml·s-1. Among the patients, creatinine was
mea-sured variously according to the patient. In regression analysis of creatinine according to eGFR,
R2 showed a distribution of 0.747 and showed a linear relationship of inverse. We investigated
ret-rospectively the creatinine and eGFR of patients with CT using eGFR to prevent side effects of con-trast agents and provide basic data. In the case of adverse effects in the CT concon-trast agent, eGFR showed an inverse linear relationship in regression analysis according to creatinine.
Key words : Computed tomography, Creatinine, eGFR, Contrast media
─ 9 ─
Technical Paper
* Corresponding author: Dae Cheol Kweon, Tel. +82-31-870-3411, Fax. +82-31-870-3419, E-mail. [email protected]
에서 2010년은 60,300명으로 증가하고 있다(Murray et al. 2013). 최근 연구에서는 만성 신부전이 말기신부전의 진행 뿐만 아니라 심혈관 질환의 위험을 증가시킨다는 보고도 있
다(Keith et al. 2004; Vanholder et al. 2005).
CT검사에서 조영제 부작용을 줄이기 위해 여러 방법으로 신장기능을 사전에 검사하여 크레아티닌 및 신기능검사로 환자의 상태여부를 확인한다. 조영제가 환자의 신장기능에 미치는 영향을 평가하기 위한 방법으로는 사구체여과율이 주로 적용되어 사용되고 있다(Kim et al. 2012). 조영제는 혈관 내에 투여하여 인체 내 혈관이나 연부 조 직 기관을 대조도 높게 보기 위하여 사용되는 약물로서 대 부분의 배출이 신장에서 이루어진다. 대부분의 조영제 약물 은 수시간에서 수일 내에서 배출이 되지만 인체에 남아 있 는 동안 신장(조영제 주입 후 24시간에서 5일 이내 peaking up to creatinine level) 신장에 독성 물질로 작용하여 조영제
투여환자 중 5~20%는 급성신장손상(acute kidney injury)
에 대한 유병률을 보고하였다(McCullough 2008).
본 연구의 목적은 CT검사 환자에서 eGFR을 이용하여 후
향적으로 크레아티닌 및 사구체여과율을 조사하여 임상에서
CIN(contrast induced nephropathy)의 조영제 부작용을 예방
하는 기초자료 제공하고 CT 조영제 부작용의 예방 효과를 연구하여 기초 데이터를 제공하고자 한다.
대상 및 방법
1. 사구체여과율 사구체여과율은 인체의 신장이 1분 동안에 깨끗하게 걸러 주는 혈액의 양으로 정의하며 신장의 기능을 평가하는 가장 중요한 수치이다. 정상적인 콩팥기능을 가진 사람의 사구체 여과율은 분당 90~120ml 정도이고, 하루에 180liter로 분당 125ml의 혈장을 여과하며 나이, 성별, 몸무게 등에 따라 사 람마다 차이를 보인다(Stevens et al. 2006). 나이가 들면 정 도의 차이는 있지만 일년에 0.75ml·min-1 정도로 감소하는 것이 일반적인 현상으로 고혈압 환자는 저하 속도가 더 빠 른 경우가 흔하게 발생한다(Coresh et al. 2003). 신장의 기능에서 사구체 기능, 여과 기능을 나타내는 중 요한 지표로서 사구체여과율은 정상치는 100ml·min-1이다. 신장에 이상이 있으면 사구체여과율이 감소한다. 임상에서 는 내인성 크레아티닌의 청소율을 구함으로써 사구체여과율 을 계산한다. 사구체여과율은 신기능 평가에 중요한 지표이 며, 임상에서는 혈청 크레아티닌(S.Cr)을 기초로 한 공식을적용하여 보정하였다(Cockcroft et al. 1976; Levey et al.
2000). =186(S.Cr in μmol·l ×0.011312) ×(age) ×(0.742 if female) (1) 크레아티닌청소율(Ccr: creatinine clearance)을 계측할 때 에는 혈청 크레아티닌(S.Cr: serum creatinine)을 이용한 경 우에 여자에서 계산된 크레아티닌청소율의 85%이다. 사구 체여과율은 다음과 같은 수정된 Modification of Diet in Renal Disease(MDRD) 공식을 이용하여 간접적으로 GFR 을 계산하여 신기능을 예측한다(Levey et al. 1999). 사구체여과율(GFR) =186×Scr-1.154×age-0.203×(0.742 if female) (2) 2. 대상 및 방법 CT검사를 위해 내원한 환자를 대상으로 조영제 주입하여 검사하고 부작용에 대해 조사하였다. CT검사를 위해 국립 암센터 영상의학과에 내원한 환자 중에서 조영제 부작용이 발생한 환자 24명(남 8명, 여 16명)을 대상으로 크레아티닌 을 입력하여 eGFR를 계산하였고, 나이, 체중, 키, 성별, BMI
(body mass index), 조영제 종류, 조영제 주입속도, 조영제 주
입 용량, 부작용의 증상을 조사하였다. 조영제 부작용에 대
한 분석은 기록을 후향적으로 분석하였다. 연구는 환자의 동
의를 획득하여 CT검사에서 조영제 주입 후에 발생하는 부
작용을 조사하였다.
검사에 사용된 조영제는 Bonorex® 300(iohexol, Centrial
Medical Service, Seoul, Korea), Pamiray® 300(iopamidol,
Dongkook Pharm., Seoul, Korea), Iomeron® 300(iomeprol,
Bracco, Milan, Italy), Ultravist® 300(iopromide, Schering
AG, Berlin, Germany), Genetix로 총 5종류로 주입하였다.
CT검사를 위한 조영제 용량은 최저 80ml에서 최대 120ml
로 주입하였고, 초당 주입량은 1.7ml·s-1에서 최대 4.5ml·s-1
을 자동주입기를 이용하여 주입하였다.
조영제 부작용이 발생한 환자는 eGFR(using the short
ver-sion of the Modification of Diet in Renal Disease GFR
calcu-lator)을 이용하여 30~90ml/min/1.73m2 사이의 신장 기능
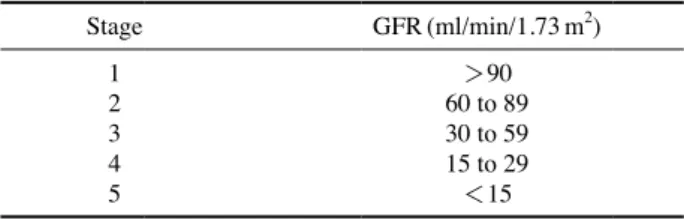
을 반영하여 산출하였고(Levey et al. 2006), CKD(chronic
kidney disease) stage는 Table 1과 같이 분류하였다.
Table 1. Stage of CKD(chronic kidney disease)
Stage GFR(ml/min/1.73m2) 1 >90 2 60 to 89 3 30 to 59 4 15 to 29 5 <15
Table 2.
Summary of adverse reaction for injection of contrast media
Identifier Creatinine (mg ·dl -1 ) Age W eight (kg) Height (m) Gender BMI eGFR Contrast media Flow rate (ml ·s -1 ) Volume (ml) Symptom 1 0.8 53 60 158 F 37.97 79.7 Bonorex ® 2 80 Urticaria 2 0.8 47 52.7 145 F 36.34 81.7 Pamiray ® 4.5 100 Dizziness, Chill 3 1.2 70 50.8 154.7 F 32.83 47.2 Iomeron ® 1.7 11 5
Cough, Itching, Urticaria
4 0.8 43 52 158.4 F 32.82 83.2 Iomeron ® 3.0 11 0
Flush, Hypermia, Itching, Urticaria
5 0.9 53 57 150 F 38 69.6 Iomeron ® 2.0 11 0 Urticaria 6 0.9 69 48.5 163 M 29.75 88.9 Ultravist ® 3.0 120 Dyspnea 7 0.8 51 58 165 F 35.15 80.4 Bonorex ® 1.8 11 0
Vomiting, Orbital edema
8 0.7 65 52.8 157.5 F 33.52 89.3 Ultravist ® 300 1.8 80 Dizziness, W eakness 9 1.3 72 72 164.6 M 43.74 57.7 Ultravist ® 300 1.8 80 Flush, Dyspnea 10 1.3 81 58 164 M 35.36 56.3 Ultravist ® 300 2.0 90 Dyspnea 11 0.9 42 68 158 F 43.03 73 Ultravist ® 2.0 11 0
Itching, Facial edema
12 1.2 49 51 159 F 32.07 50.7 Ultravist ® 2.0 11 0 Dizziness 13 0.6 56 45 160 F 28.12 109.9 Ultravist ® 2.0 80 Dizziness 14 1.2 35 45 160 F 28.12 54.3 Pamiray ® 1.7 80 Dyspnea 15 1.1 72 72 164.6 M 43.74 69.9 Pamiray ® 1.7 50 Dyspnea, Abdominal pain 16 1.1 65 59.8 156.8 M 38.13 71.4 Ultravist ® 1.8 90 Dizziness, Urticaria 17 0.9 54 43.3 156.9 F 27.59 69.3 Iomeron 3.5 120
Urticaria, Itching, Chill
18 0.8 73 52 151.6 F 34.30 74.7 Pamiray ® 3.0 120 Hypermia, Urticaria 19 0.8 55 65 153 F 42.48 79.2 Pamiray ® 2.0 90 W eakness 20 1 56 65 153 F 42.48 61 Ultravist ® 2.0 120 Urticaria, Dizziness 21 0.6 35 48.3 142.8 F 33.82 120.9 Ultravist ® 2.0 100 Dizziness, Dyspnea 22 1.4 44 62 164 F 37.80 43.4 Ultravist ® 2.5 90 Seizure 23 0.8 64 56 154 F 36.36 76.8 Ultravist ® 3.0 130 W eakness 24 1.1 57 67.8 172 M 39.41 73.3 Ultravist ® 2.0 120
Dizziness, Cold sweating
25 1.1 20 56.5 168 M 33.63 90.7 Pamiray ® 4.5 120 Urticaria 26 1 77 50 163 M 30.67 77 Ultravist ® 2.0 80 Chill 27 1.2 54 38.1 159 F 23.96 49.8 Bonorex ® 2.7 100 Dyspnea, Nausea 28 0.9 45 65 156 F 41.66 72 Genetix ® 2.0 80 Dyspnea Mean ±SD 0.97 ±0.21 55.6 ±14.2 56.12 ±8.8 158.28 ±6.52 35.46 ±5.33 73.2 ±17.7 2.35 ±0.77 99.46 ±18.97
3. 통계분석
혈청 크레아티닌에 따른 eGFR은 프로그램 Microsoft
Excel 2010(MS Excel; Microsoft, Redmond, MA, USA)을
사용하여 그래프를 그리고 추세선에 따른 회귀방정식을 산 출하였다. 로그 방정식 y=aln x+b으로 추세선을 표시하였 다. 이러한 로그 추세선은 방사선 선량의 변동률이 급격하게 증감한 후 일정한 값을 유지하는 경우에 적합한 곡선이다.
결 과
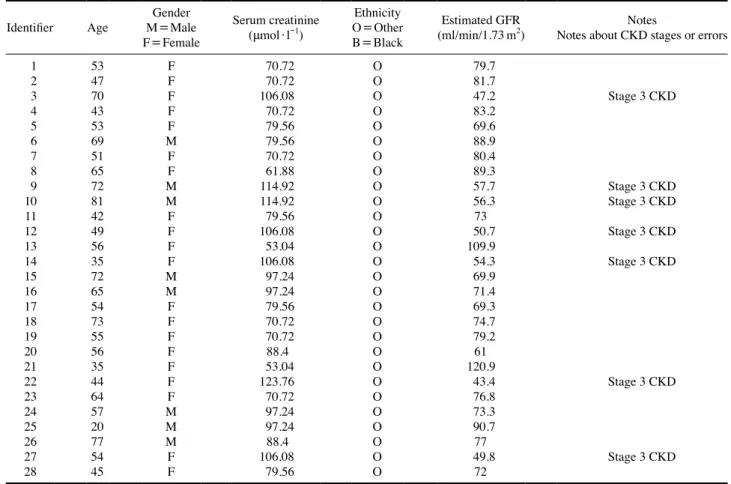
CT검사에서 조영제 주입에 따른 조영제 부작용이 발생 한 환자의 데이터의 결과는 Table 2와 같이 24명으로 조사 되었다. CT 조영제의 주입에 따른 부작용이 발생한 환자의 특성에서 크레아티닌은 0.97±0.21, 나이는 55.6±14.2, 체 중은 56.12±8.8, 키 158.28±6.52, BMI 35.46±5.33로 조사 되었다. CT 조영제의 부작용이 발생한 환자의 크레아티닌은 환자 에 따라 다양하게 분석되었다. CT검사 대상자의 조영제에 대한 부작용 발생 대상자의 크레아티닌과 eGFR 수치가 다 소 낮은 편이긴 하지만 나이, 신장, 몸무게, 성별, 조영제 종 류 및 주입 속도, 총량에 따라 관계가 없었다. 조영제 부작용이 발생한 환자의 eGFR calculator에 나이, 성별, 인종을 Estimation of Glomerular Filtration Rate
(GFR) using simplified Modification of Diet in Renal Disease
(MDRD) formula(Giles et al. 2007)을 적용한 eGFR
calcu-lator(Fig. 1)에 입력하여 eGFR 73.2±17.7ml/min/1.73m2
결과가 산출되었다. 결과에서 Stage of CKD(chronic kidney
disease)인 30~59ml/min/1.73m2는 7명으로 조사되었다
(Table 3).
CT 조영제에 대한 부작용이 발생한 환자의 데이터를 eGFR calculator에 입력하여 혈중 크레아티닌에 대한 eGFR
의 회귀분석에서 회귀식은 Y= -68.752X+140.05, 상관계 수(R2) 0.7024로 역의 선형관계를 보였다(Fig. 2).
고 찰
요오드 기반의 임상에 사용되는 조영제는 CT검사의 진단 에 중요한 역할을 하고 있으며 이러한 검사에서 조영제 부 작용이 발생하여 기존 연구에서는 역학 감시와 함께 조영제 에 대한 부작용에 대한 문서화 및 연구가 다양하게 진행되 Fig. 1. eGFR calculator.었다(Vogl et al. 2006; Kopp et al. 2008). 본 연구에서는 CT 검사에서 eGFR calculator를 이용하여 부작용이 발생한 환 자 24명을 대상으로 크레아티닌 및 사구체여과 등을 후향 적으로 조사하여 CT검사에서 조영제의 부작용을 예방하고 기초자료로 제공하기 위해 연구하였다. 사구체여과율은 혈청 크레아티닌, 나이, 인종 등을 eGFR 프로그램에 입력하여 산출하였다. 현대에 영상의학의 진단 기술의 발달과 함께 CT 조영제의 사용이 증가하고 있고, 임 상에서 진단에 적용되어 응용되고 있다. 미국 National
Kid-ney Foundation은 KidKid-ney disease/Dialysis outcome quality
improvement(K/DOQI) 지침은 신장의 사구체여과율을 기
준으로 CKD의 병기(stage)를 분류하였다. eGFR이 정상(90
ml/min/1.73m2 이상), 경도 감소(60~89ml/min/1.73m2), 중
등도 감소(30~59ml/min/1.73m2), 중증 감소(15~29ml/
min/1.73m2), 투석하는 신부전(<15ml/min/1.73m2)으로
정의하고 있다(National Kidney Foundation 2002; Levey et
al. 2003). 본 연구에서 CT 조영제 부작용 발생 환자의 평균 eGFR 73.2±17.7ml/min/1.73m2로 경도 감소로 정상 신기 능 이하로 볼 수 있고 seizure 반응을 보였던 환자의 경우 eGFR은 43ml/min/1.73m2로 낮은 결과 값을 나타냈다. 또 한 Stage of CKD가 3인 환자가 7명으로 조사되었다. 본 연 구 대상자 수로 eGFR 수치와 조영제 부작용 발생과의 연관 성을 관계를 단언할 수 없지만 인체에서 독성 물질을 걸러 주고 외부로 배출시키는 역할을 하고 있는 신장의 기능이 미약하다면 조영제로 인한 부작용 발생의 확률은 당연히 높
을 수 밖에 없을 것이다(National Kidney Foundation 2002;
Levey et al. 2003).
크레아티닌에 대한 eGFR에 대한 회귀분석에서 회귀식은
Table 3. Result summary of serum creatinine and eGFR
Identifier Age M=Male Gender
F=Female Serum creatinine (μmol·l-1) Ethnicity O=Other B=Black Estimated GFR
(ml/min/1.73m2) Notes about CKD stages or errorsNotes
1 53 F 70.72 O 79.7 2 47 F 70.72 O 81.7 3 70 F 106.08 O 47.2 Stage 3 CKD 4 43 F 70.72 O 83.2 5 53 F 79.56 O 69.6 6 69 M 79.56 O 88.9 7 51 F 70.72 O 80.4 8 65 F 61.88 O 89.3 9 72 M 114.92 O 57.7 Stage 3 CKD 10 81 M 114.92 O 56.3 Stage 3 CKD 11 42 F 79.56 O 73 12 49 F 106.08 O 50.7 Stage 3 CKD 13 56 F 53.04 O 109.9 14 35 F 106.08 O 54.3 Stage 3 CKD 15 72 M 97.24 O 69.9 16 65 M 97.24 O 71.4 17 54 F 79.56 O 69.3 18 73 F 70.72 O 74.7 19 55 F 70.72 O 79.2 20 56 F 88.4 O 61 21 35 F 53.04 O 120.9 22 44 F 123.76 O 43.4 Stage 3 CKD 23 64 F 70.72 O 76.8 24 57 M 97.24 O 73.3 25 20 M 97.24 O 90.7 26 77 M 88.4 O 77 27 54 F 106.08 O 49.8 Stage 3 CKD 28 45 F 79.56 O 72 140 120 100 80 60 40 20 0 y= -68.752x+140.05 R2=0.7024 0 0.2 0.4 0.6 0.8 1 1.2 1.4 1.6 Creatinine(mg·dl-1) eGFR
Fig. 2. Illustrate of log regression analysis of creatinine and eGFR
관계를 보였다. 크레아티닌이 높을수록 신사구체여과율이
높아지는 역의 상관관계를 나타내었다. 기존 연구에서 크레
아티닌과 eGFR의 상관계수는 0.80(Kim et al. 2007), 0.88
(Le Bricon et al. 2000)과는 차이를 보였으나, Newman et al. (1995)이 보고한 0.81과는 유사한 결과가 본 연구의 환자의 조사에서 산출되었다. 연구에 대한 기대효과는 만성 신부전에 대한 자료를 축 적하여 활용할 수 있고, 크레아티닌 및 GFR 조사로 임상에 서 조영제 부작용을 예방하는 연구 기대효과가 있다. 연구 의 제한점으로는 CT 조영제 주입에 따른 부작용이 발생한 환자를 대상으로 하여 정상 대조군과의 비교가 없어 추가적 인 연구가 필요하고, 환자에 대한 다양한 자료를 추가적으 로 광범위하게 후향적으로 연구하여 분석하여야 필요성이 제기된다.
결 론
CT검사에서 환자에게 사용되는 조영제로 인한 부작용 발 생은 eGFR 수치가 낮을 수록 발생확률이 높을 수 있다. 임 상에서 조영제 부작용을 예방하고 안전한 CT 조영제 사용 을 위하여 검사 전 환자의 eGFR 프로그램을 이용을 필수적 으로 고려하여야 한다.사 사
이 논문은 2019년도 국립암센터의 지원을 받아 수행된 연구임.참 고 문 헌
Cockcroft DW and Gault MH. 1976. Prediction of creatinine clearance from serum creatinine. Nephron. 16(1):31-41. Coresh J, Astor BC, Greene T, Eknoyan G and Levey AS. 2003.
Prevalence of chronic kidney disease and decreased kidney function in the adult US population: Third National Health and Nutrition Examination Survey. Am. J. Kidney Dis. 41(1): 1-12.
Giles PD and Fitzmaurice DA. 2007. Formula estimation of glomerular filtration rate: have we gone wrong? BMJ. 334 (7605):1198-1200.
Keith DS, Nichols GA, Gullion CM, Brown JB and Smith DH. 2004. Longitudinal follow-up and outcomes among a popu-lation with chronic kidney disease in a large managed care organization. Arch. Intern. Med. 22(164):659-663.
fecting glomerular filtration rate by contrast media in patients with coronary angiography. Korean J. Clin. Pharm. 22(2): 103-112.
Kim YH, Min WK and Rhew JS. 2007. Assessment of the accu-racy and precision of cystatin C-based GFR estimates and Cr-based GFR estimates in comparison with Cr51-EDTA GFR. Korean J. Lab. Med. 27(1):34-39.
Kopp AF, Mortele KJ, Cho YD, Palkowitsch P, Bettmann MA and Claussen CD. 2008. Prevalence of acute reactions to iopromide: postmarketing surveillance study of 74,717 pati-ents. Acta Radiol. 49(8):902-911.
Le Bricon T, Thervet E, Froissart M, Benlakehal M, Bousquet B, Legendre C and Erlich D. 2000. Plasma cystatin C is supe-rior to 24-h creatinine clearance and plasma creatinine for estimation of glomerular filtration rate 3 months after kidney transplantation. Clin. Chem. 46(8):1206-1207.
Levey AS, Bosch JP, Lewis JB, Greene T, Rodgers N and Roth D. 1999. A more accurate method to estimate glomerular fil-tration rate from serum creatinine: a new prediction equa-tion. Ann. Intern. Med. 130(6):461-470.
Levey AS, Coresh J, Balk E, Kausz AT, Levin A, Steffes MW, Hogg RJ, Perrone RD, Lau J and Eknoyan G. 2003. Nation-al Kidney Foundation practice guidelines for chronic kidney disease: evaluation, classification, and stratification. Ann. Intern. Med. 139(2):137-147.
Levey AS, Coresh J, Greene T, Stevens LA, Zhang YL, Hendrik-sen S, Kusek JW, Van Lente F; Chronic Kidney Disease Epi-demiology Collaboration. 2006. Using standardized serum creatinine values in the modification of diet in renal disease study equation for estimating glomerular filtration rate. Ann. Intern. Med. 145(4):247-254.
Levey AS, Greene T, Kusek I and Beck G. 2000. A simplified equation to predict glomerular filtration from serum creati-nine. J. Am. Soc. Nephrol. 11(15):155A.
Lysaght MJ. 2002. Maintenance dialysis population dynamics: current trends and long-term implications. J. Am. Soc. Neph-rol. 13(Suppl 1):S37-40.
McCullough PA. 2008. Contrast-induced acute kidney injury. J. Am. Coll. Cardiol. 51(15):1419-1428.
Murray CJ, Atkinson C, Bhalla K, Birbeck G, Burstein R, Chou D, Dellavalle R, Danaei G, Ezzati M, Fahimi A, Flax-man D, ForeFlax-man, Gabriel S, Gakidou E, Kassebaum N, Khatibzadeh S, Lim S, Lipshultz SE, London S, Lopez, MacIntyre MF, Mokdad AH, Moran A, Moran AE, Mozaf-farian D, Murphy T, Naghavi M, Pope C, Roberts T, Salo-mon J, Schwebel DC, Shahraz S, Sleet DA, Murray, Abra-ham J, Ali MK, Atkinson C, Bartels DH, Bhalla K, Birbeck G, Burstein R, Chen H, Criqui MH, Dahodwala, Jarlais, Ding EL, Dorsey ER, Ebel BE, Ezzati M, Fahami, Flaxman S, Flaxman AD, Gonzalez-Medina D, Grant B, Hagan H,
Hoffman H, Kassebaum N, Khatibzadeh S, Leasher JL, Lin J, Lipshultz SE, Lozano R, Lu Y, Mallinger L, McDermott MM, Micha R, Miller TR, Mokdad AA, Mokdad AH, Mo-zaffarian D, Naghavi M, Narayan KM, Omer SB, Pelizzari PM, Phillips D, Ranganathan D, Rivara FP, Roberts T, Samp-son U, Sanman E, Sapkota A, Schwebel DC, Sharaz S, Shi-vakoti R, Singh GM, Singh D, Tavakkoli M, Towbin JA, Wilkinson JD, Zabetian A, Murray, Abraham J, Ali MK, Alvardo M, Atkinson C, Baddour LM, Benjamin EJ, Bhalla K, Birbeck G, Bolliger I, Burstein R, Carnahan E, Chou D, Chugh SS, Cohen A, Colson KE, Cooper LT, Couser W, Criqui MH, Dabhadkar KC, Dellavalle RP, Jarlais, Dicker D, Dorsey ER, Duber H, Ebel BE, Engell RE, Ezzati M, Felson DT, Finucane MM, Flaxman S, Flaxman AD, Flem-ing T, Foreman, Forouzanfar MH, Freedman G, Freeman MK, Gakidou E, Gillum RF, Gonzalez-Medina D, Gosselin R, Gutierrez HR, Hagan H, Havmoeller R, Hoffman H, Ja-cobsen KH, James SL, Jasrasaria R, Jayarman S, Johns N, Kassebaum N, Khatibzadeh S, Lan Q, Leasher JL, Lim S, Lipshultz SE, London S, Lopez, Lozano R, Lu Y, Mallinger L, Meltzer M, Mensah GA, Michaud C, Miller TR, Mock C, Moffitt TE, Mokdad AA, Mokdad AH, Moran A, Naghavi M, Narayan KM, Nelson RG, Olives C, Omer SB, Ortblad K, Ostro B, Pelizzari PM, Phillips D, Raju M, Razavi H, Ritz B, Roberts T, Sacco RL, Salomon J, Sampson U, Schwebel DC, Shahraz S, Shibuya K, Silberberg D, Singh JA, Steen-land K, Taylor JA, Thurston GD, Vavilala MS, Vos T, Wag-ner GR, Weinstock MA, Weisskopf MG, Wulf S, Murray; U.S. Burden of Disease Collaborators. 2013. The state of US
health, 1990-2010: burden of diseases, injuries, and risk fac-tors. JAMA. 14(310):591-608.
National Kidney Foundation. 2002. K/DOQI clinical practice guidelines for chronic kidney disease: evaluation, classifi-cation, and stratification. Am. J. Kidney Dis. 39(2):S1-266. Newman DJ, Thakkar H, Edwards RG, Wilkie M, White T,
Grubb AO and Price CP. 1995. Serum cystatin C measured by automated immunoassay: a more sensitive marker of changes in GFR than serum creatinine. Kidney Int. 47(1): 312-318.
Song YH, Park SH, Seo YH, An JY, Kim KH and Park PW. 2008. Relation between microalbuminuria and estimated glomerular filtration rate by creatinine and cystatin C. J. Lab. Med. Qual. Assur. 30(2):259-265.
Stevens LA, Coresh J, Greene T and Levey AS. 2006. Assessing kidney function: measured and estimated glomerular filtra-tion rate. N. Engl. J. Med. 354(23):2473-2483.
Vanholder R, Massy Z, Argiles A, Spasovski G, Verbeke F and Lameire N. 2005. Chronic kidney disease as cause of car-diovascular morbidity and mortality. Nephrol. Dial. Trans-plant. 20(6):1048-1056.
Vogl TJ, Honold E, Wolf M, Mohajeri H and Hammerstingl R. 2006. Safety of iobitridol in the general population and at-risk patients. Eur. Radiol. 16(6):1288-1297.
Received: 16 January 2019 Revised: 4 February 2019 Revision accepted: 27 February 2019