Journal of the Korea Institute for Structural Maintenance and Inspection Vol. 17, No. 6, November 2013, pp.070-076
http://dx.doi.org/10.11112/jksmi.2013.17.6.070
pISSN 2234-6937 eISSN 2287-6979
강거더 연속교에 대한 충격계수에 관한 실험적 연구
Traffic Induced Dynamic Load Factors on Continuous Steel Girder Bridges Based on Field Testing
엄 준 식1)* 최 종 대2)
Jun-Sik Eom Jong-Dae Choi
Abstract
The objective of the paper is to present the results of analytical and experimental studies dealing with dynamic load for continuous steel girder bridges due to normal truck traffic. Various bridge design codes specify dynamic load factor (defined as a fraction of static portion of live load) for short span structures at the level of about 0.3. However, there are not definite values specified for continuous brigdes. Therefore, it is an usual practice to use the code specified dynamic load factors for simple span bridges to continuous bridges without clear background. The field measurement results indicate that the actual dynamic load factors are less than 0.2 for a single truck, and less than 0.05 for two trucks side-by-side, regardless of positive and negative moment region.
Keywords : Dynamic load factor, Impact factor, Diagnostic load testing
1) 정회원, 상지대학교 건설시스템공학과 교수, 교신저자 2) 정회원, 상지대학교 건설시스템공학과 박사과정
* Corresponding author : [email protected]
• 본 논문에 대한 토의를 2013년 12월 31일까지 학회로 보내주시면 2014년 1월호에 토론결과를 게재하겠습니다.
Copyright Ⓒ 2013 by The Korea Institute for Structural Maintenance and Inspection. This is an Open Access article distributed under the terms of the Creative Commons Attribution Non-Commercial License (http://creativecommons.org/licenses/by-nc/3.0)which permits unrestricted non-commercial use, distribution, and reproduction in any medium, provided the original work is properly cited.
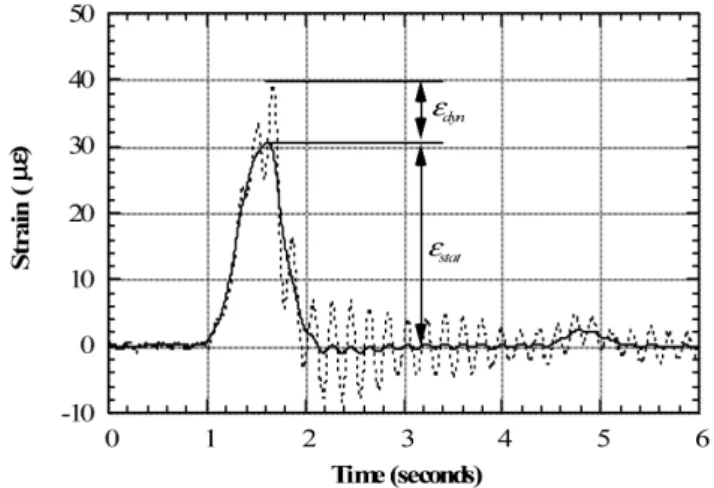
Fig. 1 Dynamic and Static Strain under a Truck at Highway Speed
1. INTRODUCTION
The time-variation of strain and stress due to a truck crossing the bridge depends on several factors. If a truck moves very slowly (at a crawling speed), then the strain and stress can be gradually increased to reach the maximum value, and then gradually decrease to zero when the truck is off the bridge. An example of the strain/stress as a function of time, recorded at a selected point, with peaks corresponding to axles, is shown in Fig. 1. However, at the regular highway speed, the actual values of stress can be affected by several factors. Dynamic load factors (DLF’s) are defined in several ways, as discussed in previous study (Bakht and Pinjarkar, 1989). In this study, the dynamic load factor was taken as the ratio of the maximum dynamic strain and the maximum static strain. Collected data were
filtered by applying numerical procedures to increase the
signal-to-noise ratio, and to reduce the effect of random,
and non-periodic noise.
Magnitude of strain/stress oscillates around the values corresponding to the crawling speed. This behavior is due to changing load and dynamic response of the bridge structure. In a typical girder bridge, the outside forces (wheel loads) are applied to the concrete slab, which distributes them to girders, and then they are transferred to foundations (via piers and abutments). The wheel forces can vary due to roughness of the riding surface and dynamic characteristics of the suspension system of the vehicle. In addition, this is combined with bridge dynamics, as the natural frequency of vibration of the bridge (often 4-8 Hz) can be close to the frequency of applied forces (1-2 Hz), as it can take less than a second for a truck to cross the bridge.
In the result, the bridge live load can be considered as a sum of static and dynamic components. The dynamic component is usually considered in form of the dynamic load factor, DLF, which is defined as a fraction of the static load, so that:
(1)
where: LL – static component of live load;
DL – dynamic component of live load.
LL and DL can be given in terms of moment, strain, or deflection.
The objective of the paper is to compare design code specified values of DLF with the results of previous analytical simulations and field measurements. The actual value of the dynamic load factor is based on the results of field tests.
2. DESIGN VALUE OF DYNAMIC LOAD
The code specified values of DLF vary depending on the documents. In general, for short span bridges, DLF is about 0.3, or even higher for some codes. It can be specified as a function of span length, natural frequency of vibration, type of component (beam, slab, joint, foundation), material, and so on.
Values of DLF specified in various bridge design codes are considerably different. In the Korean Standard Specification for Highway Bridges (2005):
(2)
and in the AASHTO Standard (2005):
(3)
where: L – span length (m).
For short span bridges (up to 12m) and reinforced concrete slabs, DLF = 0.30. DLF is less than 0.10 for the span exceeding 112 m.
In the new AASHTO LRFD Code (2013), live load is a superposition of HS20 truck (325 kN), and lane loading of 9.3 kN/m. DLF is specified as 0.33 of the truck effect, with no DLF applied to the lane load. In practice, this results in DLF = 0.3 for shorter spans.
In the first two editions of the Ontario Highway Bridge Design Code (OHBDC, 1991), dynamic load factor was specified as a function of natural frequency of vibration.
For bridges with span length up to 15m, this results in DLF = 0.30. In the third edition of OHBDC (1991), DLF
= 0.25, except of very short spans, with two and one axles governing, then DLF is 0.3 and 0.4, respectively.
In the Japanese bridge design code, the dynamic load factor corresponding to the design truck is given as a function of span:
(4)
For 10m span, DLF = 0.33.
In Eurocode (2003), the dynamic load is included in the specified live load, so no DLF is given.
The German code (DIN 1072) specifies DLF as a linear function of span:
(5)
Fig. 2 Simulated Values of DLF vs. Truck Weight for 5 Axle Trucks
Fig. 3 Simulated Values of DLF vs. Truck Weight for 3 Axle Trucks
Table 1 Selected Bridges
Bridge Number No. Of Spans No. of Lanes
Total Bridge
Length [m] No. of Girders Girder Spacing [m]
Year Constructed
Skew
Angle ADT
A 3 2 102 6 2.15 1982 1 164
B 3 2 111 6 2.50 1980 19 1460
C 4 2 138 6 2.50 1979 7 550
And for spans less than 12m, DLF = 0.3.
For all considered codes, there is no definite specification of dynamic load factors regading the continuous bridges.
3. ANALYTICAL MODELS
The analytical model was developed by Hwang and Nowak (1991) for simple span bridges. In their study, The bridge superstructure was treated as a prismatic beam.
Traffic was represented by two vehicles; a two axle truck and a three axle truck, with the suspension system modeled using actual measurement data. Roughness of the surface was also modeled using the actual measurements, with three categories: smooth, medium and rough.
In the study of Hwang and Nowak (1991), a computer program was developed for simulation of the dynamic load factor (DLF) for steel and prestressed concrete girder bridges.
The simulations clearly indicated that DLF decreases with the increasing truck weight. The results (Hwang and Nowak, 1991) are summarized in Fig. 2 for a five axle truck and
Fig. 3 for a three axle truck. This study aims to verify if the similar results can be seen for various types of continuous bridges, including varying side shapes.
4. BRIDGE SELECTION AND INSTRUMENTATION
This study is focused on steel continuous girder bridges.
All bridges carry two lanes. Detailed dimensions of selected bridges are illustrated in Table 1. The strain transducers were attached to the lower surface of the bottom flange of steel girders at midspan and at the support. A typical tansducer instrumenation is shown in Fig. 4. Strain transducers were connected to the SCXI data acquisition system from the National Instruments. The data acquisition system consists of a four slot SCXI-1000 chassis, one SCXI-1200 data acquisition module, two SCXI-1100 multiplexer modules, and one notebook computer with Labview software. For the normal speed tests, a sampling rate of 300 per second was used for calculation of dynamic effects. This is equivalent to 11.4 samples per meter at a truck speed of 95 km/h.
Fig. 5 shows the detailed cross-section and side elevation
Cross Section of Bridge A Side Elevation of Bridge A
Cross Section of Bridge B Side Elevation of Bridge B
Cross Section of Bridge C Side Elevation of Bridge C
Fig. 5 Details of Selected Bridges Fig. 4 Removable Strain Transducer instrumentation
of bridges tested.
5. LOADING
In Michigan, the United States, the maximum mid-span moment in medium span bridges is caused by 11-axle trucks, with gross vehicle weight (GVW) up to 730 kN
depending the axle configuration. The vehicles used in the analysis were fully loaded, three-unit, 11-axle trucks. A typical side-view of a truck used in the tests is shown in Fig. 6, and in Fig. 7, the axle configuration. Field test was performed under single truck loading, and two trucks side-by-side truck loading condition. In order to simulate static loading condition, trucks were at first driven at crawling speed. From the crawling speed test, LL’s in Eq.1 were collected, and this test was repeated multiple times to achieve accurate reading. The passage of truck tires were marked each time to prepare normal speed test.
In normal speed test, Trucks were carefully driven to
follow the marks made during crawling speed test, The
normal speed tests were also performed multiple times to
eliminate the variation of truck paths. Bridges may behave
differently, as speed changes. However, in this study,
trucks were carefully driven to achieve the legal maximum
speed limits to simulate real traffic condition.
Fig. 6 Typical Side-View of Trucks used in the test
Fig. 7 Axle Configuration of Trucks used in the test
Fig. 8 DLF’s measured at the maximum positive moment region
Fig. 9 DLF’s measured at the maximum negative moment region (over piers)
6. FIELD MEASUREMENT RESULTS
The objective of this study is to measure the actual
values of DLF, and compare them with design values.
Static and dynamic strains were measured, and DLF was
calculated using Eq. 1. For the tested bridges, the measured
dynamic load factors for one truck passage are shown in
Fig. 8 and Fig. 9 for each tested bridge. In the same figure,
DLF’s measured from two truck side-by-side loadings are
also shown. Values of DLF are plotted for each girder. In
the Figs 8 and 9, DLF’s are plotted for all load cases
involving normal speed. The Fig. 8 shows DLF’s measured
at the maximum positive moment region, and Fig. 9 for
negative moment (over piers). As shown in the figures,
dynamic load factors for exterior girders are high because
the static strains in these girders are very low. In other
words, large values of DLF in exterior girders correspond
to load cases with a single truck in the opposite lane
(resulting in very low static strain). This indicates that even
if the value of DLF’s are extremely high for exterior girder,
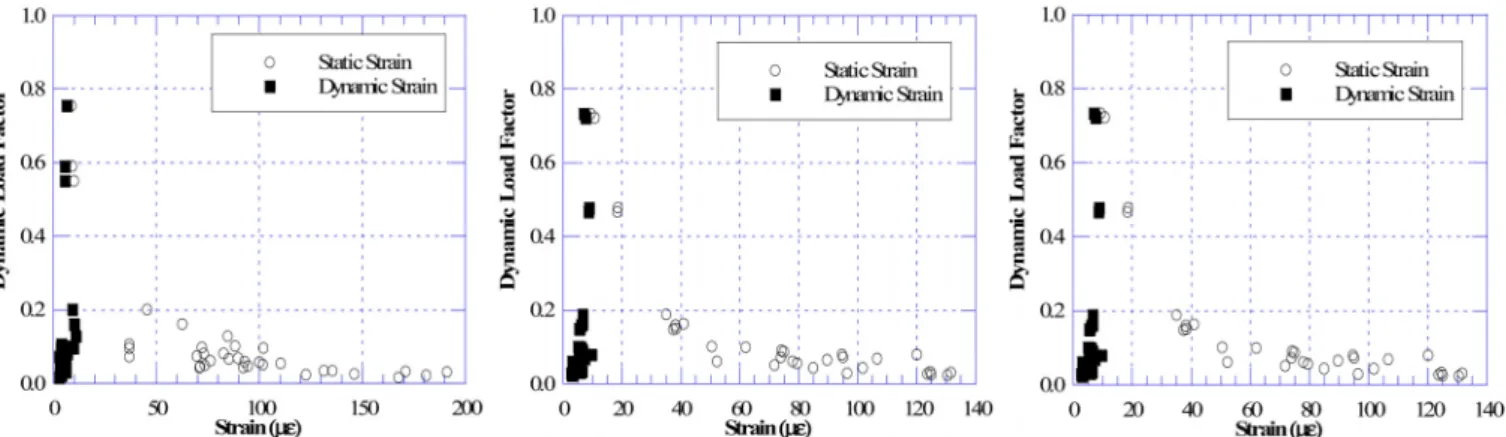
Fig. 10 Static and Dynamic Strain Vs. DLF’s measured at the maximum positive moment region
Fig. 11 Static and Dynamic Strain Vs. DLF’s measured at the maximum negative moment region (over piers)
this does not mean those girders are under greater stress because the absolute level of static load itself is very low.
The static and dynamic loads are plotted vs. DLF in Figs 10 and 11 for all tested bridges respectively. Fig. 10 indicates the static and dynamic strains compared to the DLF’s at the positive moment region, and Fig. 11 for negative moment region. It is clear that DLF decreases for larger static strain. Furthermore, it was observed that absolute values of the dynamic strain do not depend on static strain.
The open circles correspond to static strain, Ɛ
stat, and black solid squares correspond to dynamic strain, Ɛ
dyn. For each static strain value (open circle), the corresponding dynamic strain is denoted by solid square (the numbers of circles and squares are same). Dynamic strains remain nearly constant, while static strains increase as truck loading increases. This results in large dynamic load factors for low static strains.
The maximum value of DLF obtained from the measurements was 0.17 for a single truck, and less than 0.05 for two
trucks side-by-side. Therefore, the field tests confirmed the validity of prior analytical simulations. The measured DLF turned out to be even lower than analytically predicted by Hwang and Nowak (1991).
7. CONCLUSIONS
The dynamic load factors (DLF) obtained from the tests are summarized in Figs 7 and 8 for positive strains measured at the midspan and negative strains measured near support over pier. As shown in the figures, dynamic load factors for exterior girders are high because the static strains in these girders are very low. In other words, large values of DLF in exterior girders correspond to load cases with a single truck in the opposite lane (resulting in very low static strain).
The relationship between DLF, static and dynamic strains
is presented for positive and negative moments, respectively.
요 지
본 연구에서는 강거더 연속교에 대해 국내외 설계기준에 규정되어 있는 활하중으로 인한 충격계수를 실험을 통해 검증하였다. 대부분의 도로교의 설계기준에서는 도로교의 경우 충격계수를 약 0.3 정도의 값으로 규정하고 있으나, 연속교의 경우에는 명확한 규정 및 명시가 없 는 상황이다. 그러므로 단순교에 적용되는 충격계수를 연속교에 동일하게 적용하는 것이 일반적이다. 이 연구에서는 현장실험을 통해 연속 교의 충격계수가 단순교에 적용되는 경우와 같이 사용될 수 있는지를 검증하였다. 현장실험 결과 얻어진 충격계수는 2차선 교량에서 1대의 만재트럭이 통과했을 경우 가장 하중이 많이 작용한 거더에서 0.2 이내의 충격계수가 계측되었으며, 2개의 차선을 통시에 만재트럭이 통과 한 경우 그 충격계수는 0.05 이내의 값을 얻었다.