Evaluation of GSICS Correction
for COMS/MI Visible Channel Using S-NPP/VIIRS
Donghyun Jin
1)·Soobong Lee
2)·Seonyoung Lee
3)·Daeseong Jung
4)· Suyoung Sim
4)·Morang Huh
5)·Kyung-soo Han
6)†Abstract: The Global Space-based Inter-Calibration System (GSICS) is an international partnership sponsored by World Meteorological Organization (WMO) to continue and improve climate monitoring and to ensure consistent accuracy between observation data from meteorological satellites operating around the world. The objective for GSICS is to inter-calibration from pairs of satellites observations, which includes direct comparison of collocated Geostationary Earth Orbit (GEO)-Low Earth Orbit (LEO) observations. One of the GSICS inter- calibration methods, the Ray-matching technique, is a surrogate approach that uses matched, co-angled and co- located pixels to transfer the calibration from a well calibrated satellite sensor to another sensor. In Korea, the first GEO satellite, Communication Ocean and Meteorological Satellite (COMS), is used to participate in the GSICS program. The National Meteorological Satellite Center (NMSC), which operated COMS/MI, calculated the Radiative Transfer Model (RTM)-based GSICS coefficient coefficients. The L1P reproduced through GSICS correction coefficient showed lower RMSE and Bias than L1B without GSICS correction coefficient applied.
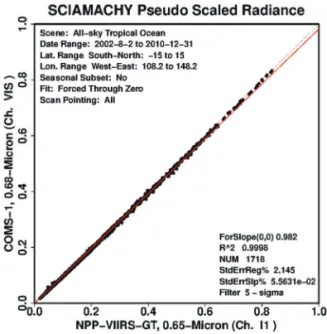
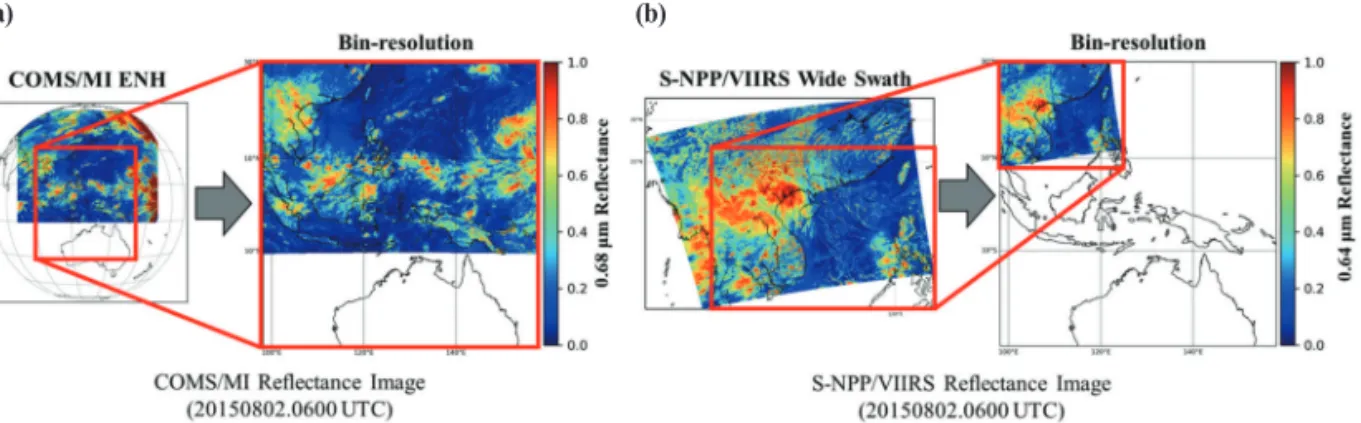
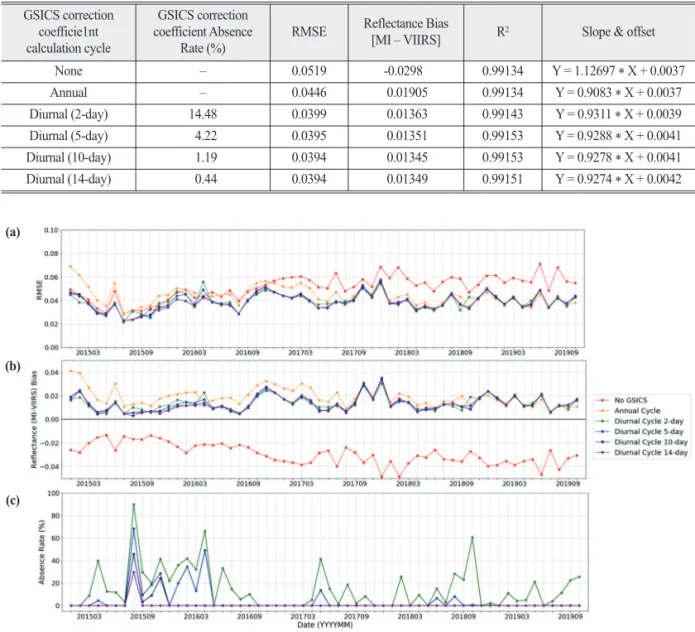
The calculation cycles of the GSICS correction coefficients for COMS/MI visible channel are provided annual and diurnal (2, 5, 10, 14-day), but long-term evaluation according to these cycles was not performed. The purpose of this paper is to perform evaluation depending on the annual/diurnal cycles of COMS/MI GSICS correction coefficients based on the ray-matching technique using Suomi-NPP/Visible Infrared Imaging Radiometer Suite (VIIRS) data as reference data. As a result of evaluation, the diurnal cycle had a higher coincidence rate with the reference data than the annual cycle, and the 14-day diurnal cycle was the most suitable for use as the GSICS correction coefficient.
Key Words: GSICS correction, Inter-calibration, Ray-matching technique, COMS/MI, S-NPP/VIIRS, SBAF
https://doi.org/10.7780/kjrs.2021.37.1.14 ISSN 2287-9307 (Online)
Letter
Received February 5, 2021; Revised February 16, 2021; Accepted February 18, 2021; Published online February 23, 2021
1)
PhD Candidate, Department of Spatial Information Engineering, Pukyong National University
2)
Researcher, Satellite Analysis Division, National Meteorological Satellite Center, Korea Meteorological Administration
3)
Senior Researcher, Satellite Analysis Division, National Meteorological Satellite Center, Korea Meteorological Administration
4)
Master Student, Department of Spatial Information Engineering, Pukyong National University
5)
Director, Research Center, Nano C&W Ltd. co.
6)
Professor, Department of Spatial Information Engineering, Pukyong National University
†