Publications of the Korean Astronomical Society pISSN 1225-1534
32: 263 ∼ 265, 2017 March eISSN 2287-6936
2017. The Korean Astronomical Society. All rights reserved. c https://doi.org/10.5303/PKAS.2017.32.1.263
MIR LUMINOSITY FUNCTION OF GALAXIES IN THE NEP-WIDE FIELD Seong Jin Kim
1,2, Hyung Mok Lee
1, Woong-Seob Jeong
2, and NEP team
1,2,31
Department of Physics and Astronomy, Seoul National University, Gwanak-gu, Seoul 151-742, Republic of Korea
2
Space Science Divison, KASI, 61-1, Whaam-dong, Yuseong-gu, Deajeon 305-348, Republic of Korea
3
Institute of Space and Astronautical Science, Japan Aerospace Exploration Agency, Yoshinodai 3-1-1, Sagamihara, Kanagawa 229 8510
E-mail: [email protected]
(Received August 28 2015; Revised October 25, 2016; Accepted October 25, 2016)
ABSTRACT
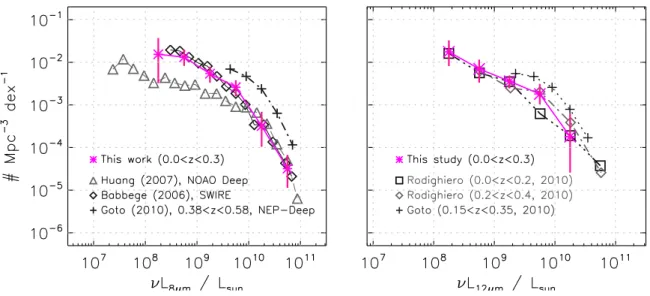
We present the mid-infrared (MIR) luminosity function (LF) of local (z < 0.3) star-forming (SF) galaxies in the North Ecliptic Pole (NEP) field. This work is based on the NEP-Wide point source catalogue and the spectroscopic redshift (z) data for ∼ 1700 galaxies obtained by the optical follow-up survey with MMT/Hectospec and WIYN/Hydra. The AKARI’s continuous 2 – 24 µm coverage and the spectroscopic redshifts enable us to determine the spectral energy distribution (SED) in the mid-infrared and derive the luminosity functions of galaxies. Our 8 µm LF finds good agreements with the results from SWIRE field over the wide luminosity range, while showing significant difference from the NOAO deep data in the faint end. The comparison with higher-z sample shows significant luminosity evolution from z > 0.3 to local universe. 12 µm LF also shows a clear indication of luminosity evolution.
Key words: infrared: galaxies – galaxies: luminosity function
1. THE NEP-WIDE DATA
The NEP-Wide Survey covered a wide (5.4 deg
2) field and provides a huge number of extragalactic sources in the redshifts below z ∼ 1 (Matsuhara et al., 2006; Lee et al., 2009; Kim et al., 2012). Supplementary optical and ground-based near-IR data covering this NEP-Wide field (Hwang et al., 2007; Jeon et al., 2010) as well as the spectroscopic redshifts (spec-z) information (Shim et al., 2013) enable us to figure out spectral energy distribu- tions (SEDs) and spatial distribution of various types of galaxies.
Mid-IR luminosities are known to be sensitive to the star-forming activity because significant amount of lu- minosity generated by young stars can be reemitted in the infrared by heated dust and this reprocessed emis- sion accounts for most of the mid-IR luminosity (La- gache et al., 1999; Puget et al., 1996; Frenceschini et al., 2008). Here, we present the recent determination of mid-IR (8 µm and 12 µm) luminosity functions for local
http://pkas.kas.org
(z < 0.3) galaxies based on the multi-band data from the NEP-Wide point source catalogue covering from optical u
∗band to AKARI 24 µm band together with spectro- scopic redshift data for selected sample. This work com- plements the results from the NEP-Deep Survey (Goto et al., 2010), which derived LFs for more distant uni- verse (z > 0.3).
2. ANALYSIS AND METHODS
Among the infrared sources in the NEP-Wide Survey data (Kim et al., 2012), we used the spectroscopic sam- ple classified as ‘galaxy’ based on the analysis of emis- sion lines obtained by optical follow-up survey with MMT/Hectospec and WIYN/Hydra (Shim et al., 2013).
To find the best-fit model for these selected sample,
we performed SED fitting over all the available photo-
metric data with spectroscopic redshifts. For this, we
used the models from Polletta et al. (2007). AKARI’s
continuous filter coverage in the mid-IR part and the
redshifts determined by spectroscopic observations al-
263
264 S. J. KIM ET AL.
Figure 1. Left panel: 8 µm LFs of SF galaxies. The asterisk represents the LF of local (z < 0.3) galaxy sample in the NEP-Wide survey field (this work). Diamonds show the results from Babbege et al. (2006) based on the SWIRE data, the triangles from Huang et al. (2007, NOAO deep). The cross shows the LF for galaxies at higher z from NEP-Deep survey (Goto et al., 2010). Right panel: 12 µm luminosity functions of SF galaxies.
low us to avoid large uncertainties when we calculate K-corrections and luminosities.
After we computed the maximum redshift (z
max), where a source could be observed with the detection limits, we determined corresponding comoving volume V
maxfor each source. We collected the sources hav- ing the same luminosity ranges (∆L). Then, luminosity functions (Φ) were calculated using 1/V
maxmethod,
Φ(L) = 1
∆L X
i