Kor. J. Hort. Sci. Technol. 30(1):56-63, 2012 DOI http://dx.doi.org/10.7235/hort.2012.11069
CAPS Marker Linked to Tomato Hypocotyl Pigmentation
Hyoun-Joung Kim
1, Heung-Ryul Lee
1, Ji Young Hyun
1, Dong-Chan Won
2, Dong Oh Hong
2, and Chee Hark Harn
1*1
Biotechnology Institute, Nongwoo Bio. Co., Ltd., Yeoju 469-885, Korea
2
Breeding Institute, Nongwoo Bio. Co., Ltd., Yeoju 469-885, Korea
Abstract. Tomato hypocotyl can generally be one of two colors, purple or green. Genetically, this trait is controlled by a single dominant gene. Hypocotyl tissue specific color expression is one of many visible genetic marker sources used to select tomato progeny. However, the visible marker does not show a clear distinction between homozygous genotype and heterozygous genotype from the breeding lines. Therefore, to identify a hypocotyl pigmentation related marker, we screened DNA polymorphisms in thirteen tomato lines showing purple or green hypocotyls. The markers used for screening consisted of primer set information obtained from anthocyanin related genes, conserved ortholog set II (COS II) marker sets localized near anthocyanin related genes, and restriction fragment length polymorphism (RFLP) markers localized near COS II markers, which produce polymorphisms between purple and green tomatoes. One primer from a RFLP fragment resulted in a polymorphism on agarose gel electrophoresis. From the RFLP fragment, a cleaved amplified polymorphic sequence (CAPS) marker was developed to distinguish between purple and green hypocotyls. The genotypes of 135 F
2individuals were analyzed using the CAPS marker, and among them, 132 individuals corresponded to the phenotypes of hypocotyl pigmentation.
Additional key words: anthocyanin related gene, cleaved amplified polymorphic sequence, conserved ortholog set II
*Corresponding author: [email protected]
※ Received 13 July 2011; Revised 7 October 2011; Accepted 11 October 2011. This research was supported by a grant (308002-05-3-CG000) from the Ministry for Food, Agriculture, Forestry, and Fisheries, Republic of Korea.
Introduction
Pigmentation of flowers, fruits, leaves, stems, and roots is important for analyzing the phenotypic characteristics and determining the presence of nutritional antioxidants (Noda et al., 2000) in vegetables and ornamentals. Most pigments are regulated by genes encoding most of the enzymes in the anthocyanin biosynthetic pathway. Anthocyanin-related genes, such as anthocyanidin synthase (ans; Weiss et al., 1993), rhamnosyltransferase (rt; Brugliera et al., 1994), and anthocyanin-1 (an1; Quattrocchio et al., 1993), have been isolated in petunia and their regulation has been characterized.
In tomato, the genes responsible for coloration, such as chalcone synthase (chs; O’Neill et al., 1990), dihydroflavonol 4-reductase (dfr; Bongue-Bartelsman et al., 1994), and anthocyanin1 (ant1; Mathews et al., 2003), have been cloned.
Thirteen color genes, including chs, dfr, and ans, have been located on the genetic map of tomato (de Jong et al., 2004).
In addition, morphological markers related to anthocyanin
mutations, such as anthocyaninless (a), entirely anthocyaninless (ae), anthocyanin free (af), anthocyanin gainer (ag), and albescent (alb), were designated on the tomato map (Tanksley et al., 1992). All of these reported genes and mutations are related to the pigmentation of the fruit or whole plant.
However, there is no data indicating which anthocyanin- related gene directly regulates hypocotyl pigmentation in tomato without affecting other organs.
Purple and green coloration has been observed in the
tomato hypocotyl tissue. This type of hypocotyl pigmentation
may be a unique phenomenon since hypocotyl coloration
is not related to the pigmentation of other organs, such as
the flower, stem, leaf, or fruit. Based on the observations
of breeders at Nongwoo Bio Co., the green hypocotyl trait
is linked to important characteristics such as GMS (genetic
male sterility) and resistance to bacterial wilt, ToMV
(tobacco mosaic virus) and FCRR (fusarium crown and root
rot). Additionally, ToMV and FCRR resistance loci were
previously reported to be strongly linked to each other
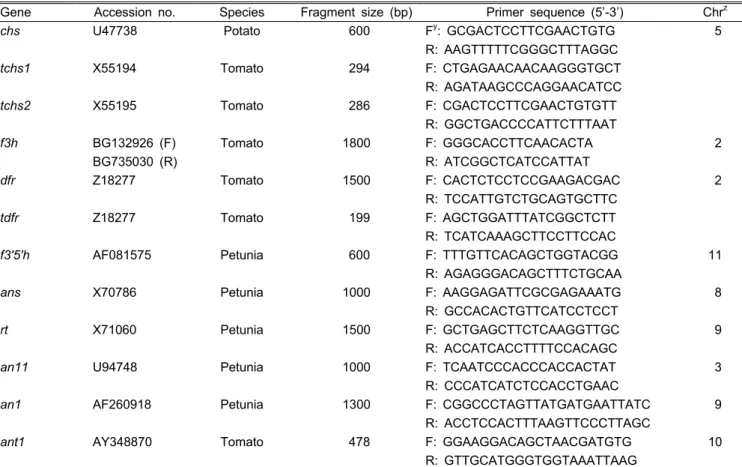
Table 1. Primers designed from anthocyanin related genes.
Gene Accession no. Species Fragment size (bp) Primer sequence (5’-3’) Chr
zchs
U47738 Potato 600 F
y: GCGACTCCTTCGAACTGTG 5
R: AAGTTTTTCGGGCTTTAGGC
tchs1
X55194 Tomato 294 F: CTGAGAACAACAAGGGTGCT
R: AGATAAGCCCAGGAACATCC
tchs2
X55195 Tomato 286 F: CGACTCCTTCGAACTGTGTT
R: GGCTGACCCCATTCTTTAAT
f3h
BG132926 (F) Tomato 1800 F: GGGCACCTTCAACACTA 2
BG735030 (R) R: ATCGGCTCATCCATTAT
dfr
Z18277 Tomato 1500 F: CACTCTCCTCCGAAGACGAC 2
R: TCCATTGTCTGCAGTGCTTC
tdfr
Z18277 Tomato 199 F: AGCTGGATTTATCGGCTCTT
R: TCATCAAAGCTTCCTTCCAC
f3'5'h
AF081575 Petunia 600 F: TTTGTTCACAGCTGGTACGG 11
R: AGAGGGACAGCTTTCTGCAA
ans
X70786 Petunia 1000 F: AAGGAGATTCGCGAGAAATG 8
R: GCCACACTGTTCATCCTCCT
rt
X71060 Petunia 1500 F: GCTGAGCTTCTCAAGGTTGC 9
R: ACCATCACCTTTTCCACAGC
an11
U94748 Petunia 1000 F: TCAATCCCACCCACCACTAT 3
R: CCCATCATCTCCACCTGAAC
an1
AF260918 Petunia 1300 F: CGGCCCTAGTTATGATGAATTATC 9
R: ACCTCCACTTTAAGTTCCCTTAGC
ant1
AY348870 Tomato 478 F: GGAAGGACAGCTAACGATGTG 10
R: GTTGCATGGGTGGTAAATTAAG
z
Tomato chromosome number for which the gene was mapped.
y
F, forward primer; R, reverse primer.
(Vakalounakis et al., 1997).
Tomatoes with purple hypocotyls have been used for constructing elite lines through selfing and backcross in tomato breeding. Breeders have used hypocotyl color as a visual marker to trace the resistant traits through the introgression of green hypocotyl tomatoes into elite breeding lines of purple ones. However, this visual marker is limited in its use to distinguish between homozygous and heterozygous genotypes. In addition, the identification of hypocotyl color is difficult when the hypocotyl is planted in soil. Therefore, a DNA marker associated with hypocotyl color could be effectively used to select for disease resistant genes and genotypes from progeny, thereby saving time, labor, and the cost of breeding steps.
In this study, we developed a CAPS marker for distinguishing purple and green hypocotyls using the candidate gene approach with anthocyanin-related genes, followed by an analysis of COS II markers and RFLP markers linked to the anthocyanin-related genes. This CAPS marker could be used as a selectable genetic marker in a marker assistant selection (MAS) system for the identification of purple or green genotypes at any stage of tomato breeding.
Materials and methods
Plant Materials
Ten purple hypocotyl and three green hypocotyl tomato lines were used in the development of DNA markers of purple and green color from the information on anthocyanin related genes and linked markers. Purple type (NWp1) and green type (NWg3) tomato lines were crossed, and an F
1plant from the cross was selfed to produce an F
2population. The parents, the F
1plant, an F
2population, and a BC
1F
1population, which was produced from a cross of the F
1plant and NWg3, were used for genetic analysis. One hundred and thirty five plants from the F
2population were randomly selected to confirm the developed marker. Hypocotyl pigmentation was determined by visually scoring two to three leaves of tomato seedlings.
Primer Design
Primer sets deduced from anthocyanin related genes (de
Jong et al., 2004), producing more than 500 bp in size, were
used for screening as PCR based markers. The other PCR
primers (Table 1) for anthocyanin related genes were
designed using Primer3 Input (http://frodo.wi.mit.edu/primer3)
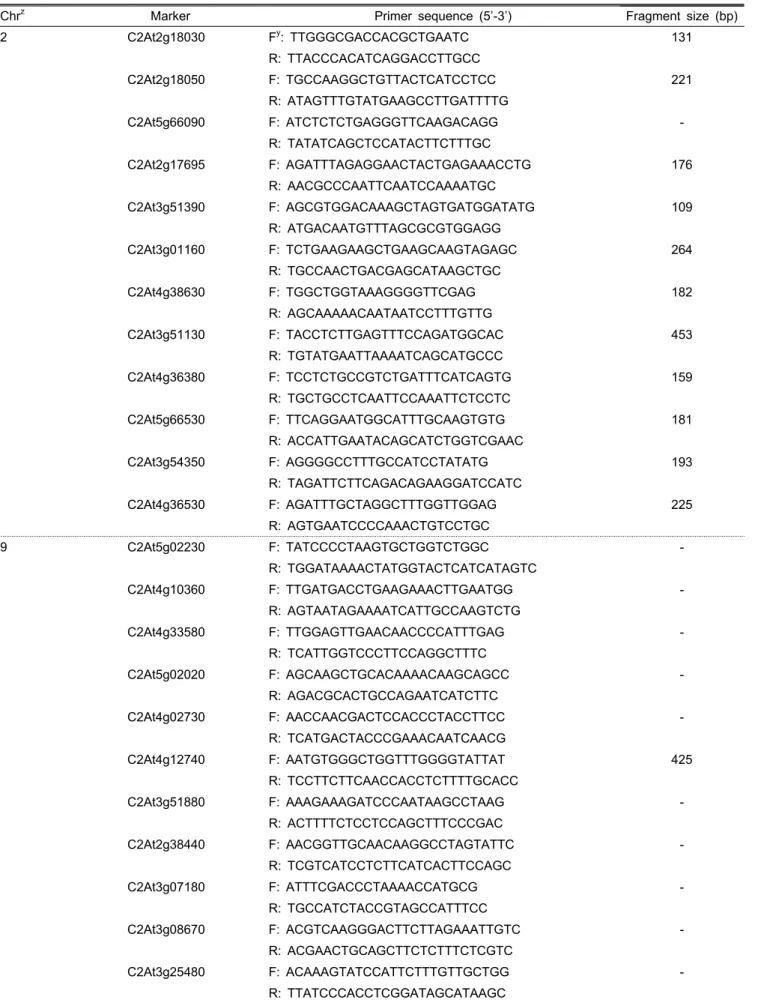
Table 2. COS II markers localized near anthocyanin related genes.
Chr
zMarker Primer sequence (5’-3’) Fragment size (bp)
2 C2At2g18030 F
y: TTGGGCGACCACGCTGAATC 131
R: TTACCCACATCAGGACCTTGCC
C2At2g18050 F: TGCCAAGGCTGTTACTCATCCTCC 221
R: ATAGTTTGTATGAAGCCTTGATTTTG
C2At5g66090 F: ATCTCTCTGAGGGTTCAAGACAGG -
R: TATATCAGCTCCATACTTCTTTGC
C2At2g17695 F: AGATTTAGAGGAACTACTGAGAAACCTG 176
R: AACGCCCAATTCAATCCAAAATGC
C2At3g51390 F: AGCGTGGACAAAGCTAGTGATGGATATG 109
R: ATGACAATGTTTAGCGCGTGGAGG
C2At3g01160 F: TCTGAAGAAGCTGAAGCAAGTAGAGC 264
R: TGCCAACTGACGAGCATAAGCTGC
C2At4g38630 F: TGGCTGGTAAAGGGGTTCGAG 182
R: AGCAAAAACAATAATCCTTTGTTG
C2At3g51130 F: TACCTCTTGAGTTTCCAGATGGCAC 453
R: TGTATGAATTAAAATCAGCATGCCC
C2At4g36380 F: TCCTCTGCCGTCTGATTTCATCAGTG 159
R: TGCTGCCTCAATTCCAAATTCTCCTC
C2At5g66530 F: TTCAGGAATGGCATTTGCAAGTGTG 181
R: ACCATTGAATACAGCATCTGGTCGAAC
C2At3g54350 F: AGGGGCCTTTGCCATCCTATATG 193
R: TAGATTCTTCAGACAGAAGGATCCATC
C2At4g36530 F: AGATTTGCTAGGCTTTGGTTGGAG 225
R: AGTGAATCCCCAAACTGTCCTGC
9 C2At5g02230 F: TATCCCCTAAGTGCTGGTCTGGC -
R: TGGATAAAACTATGGTACTCATCATAGTC
C2At4g10360 F: TTGATGACCTGAAGAAACTTGAATGG -
R: AGTAATAGAAAATCATTGCCAAGTCTG
C2At4g33580 F: TTGGAGTTGAACAACCCCATTTGAG -
R: TCATTGGTCCCTTCCAGGCTTTC
C2At5g02020 F: AGCAAGCTGCACAAAACAAGCAGCC -
R: AGACGCACTGCCAGAATCATCTTC
C2At4g02730 F: AACCAACGACTCCACCCTACCTTCC -
R: TCATGACTACCCGAAACAATCAACG
C2At4g12740 F: AATGTGGGCTGGTTTGGGGTATTAT 425
R: TCCTTCTTCAACCACCTCTTTTGCACC
C2At3g51880 F: AAAGAAAGATCCCAATAAGCCTAAG -
R: ACTTTTCTCCTCCAGCTTTCCCGAC
C2At2g38440 F: AACGGTTGCAACAAGGCCTAGTATTC -
R: TCGTCATCCTCTTCATCACTTCCAGC
C2At3g07180 F: ATTTCGACCCTAAAACCATGCG -
R: TGCCATCTACCGTAGCCATTTCC
C2At3g08670 F: ACGTCAAGGGACTTCTTAGAAATTGTC -
R: ACGAACTGCAGCTTCTCTTTCTCGTC
C2At3g25480 F: ACAAAGTATCCATTCTTTGTTGCTGG -
R: TTATCCCACCTCGGATAGCATAAGC
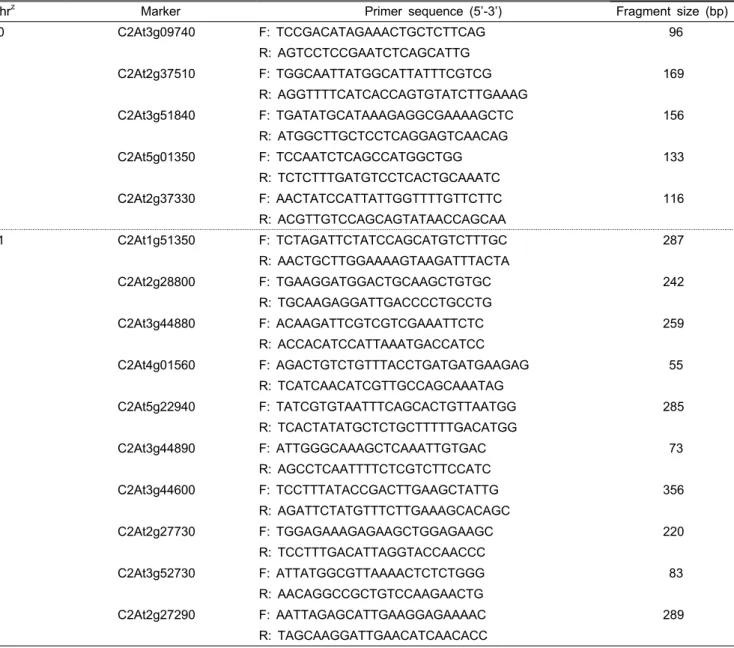
Table 2. Continued.
Chr
zMarker Primer sequence (5’-3’) Fragment size (bp)
10 C2At3g09740 F: TCCGACATAGAAACTGCTCTTCAG 96
R: AGTCCTCCGAATCTCAGCATTG
C2At2g37510 F: TGGCAATTATGGCATTATTTCGTCG 169
R: AGGTTTTCATCACCAGTGTATCTTGAAAG
C2At3g51840 F: TGATATGCATAAAGAGGCGAAAAGCTC 156
R: ATGGCTTGCTCCTCAGGAGTCAACAG
C2At5g01350 F: TCCAATCTCAGCCATGGCTGG 133
R: TCTCTTTGATGTCCTCACTGCAAATC
C2At2g37330 F: AACTATCCATTATTGGTTTTGTTCTTC 116
R: ACGTTGTCCAGCAGTATAACCAGCAA
11 C2At1g51350 F: TCTAGATTCTATCCAGCATGTCTTTGC 287
R: AACTGCTTGGAAAAGTAAGATTTACTA
C2At2g28800 F: TGAAGGATGGACTGCAAGCTGTGC 242
R: TGCAAGAGGATTGACCCCTGCCTG
C2At3g44880 F: ACAAGATTCGTCGTCGAAATTCTC 259
R: ACCACATCCATTAAATGACCATCC
C2At4g01560 F: AGACTGTCTGTTTACCTGATGATGAAGAG 55
R: TCATCAACATCGTTGCCAGCAAATAG
C2At5g22940 F: TATCGTGTAATTTCAGCACTGTTAATGG 285
R: TCACTATATGCTCTGCTTTTTGACATGG
C2At3g44890 F: ATTGGGCAAAGCTCAAATTGTGAC 73
R: AGCCTCAATTTTCTCGTCTTCCATC
C2At3g44600 F: TCCTTTATACCGACTTGAAGCTATTG 356
R: AGATTCTATGTTTCTTGAAAGCACAGC
C2At2g27730 F: TGGAGAAAGAGAAGCTGGAGAAGC 220
R: TCCTTTGACATTAGGTACCAACCC
C2At3g52730 F: ATTATGGCGTTAAAACTCTCTGGG 83
R: AACAGGCCGCTGTCCAAGAACTG
C2At2g27290 F: AATTAGAGCATTGAAGGAGAAAAC 289
R: TAGCAAGGATTGAACATCAACACC
z
Chromosome number.
y
F, forward primer; R, reverse primer.
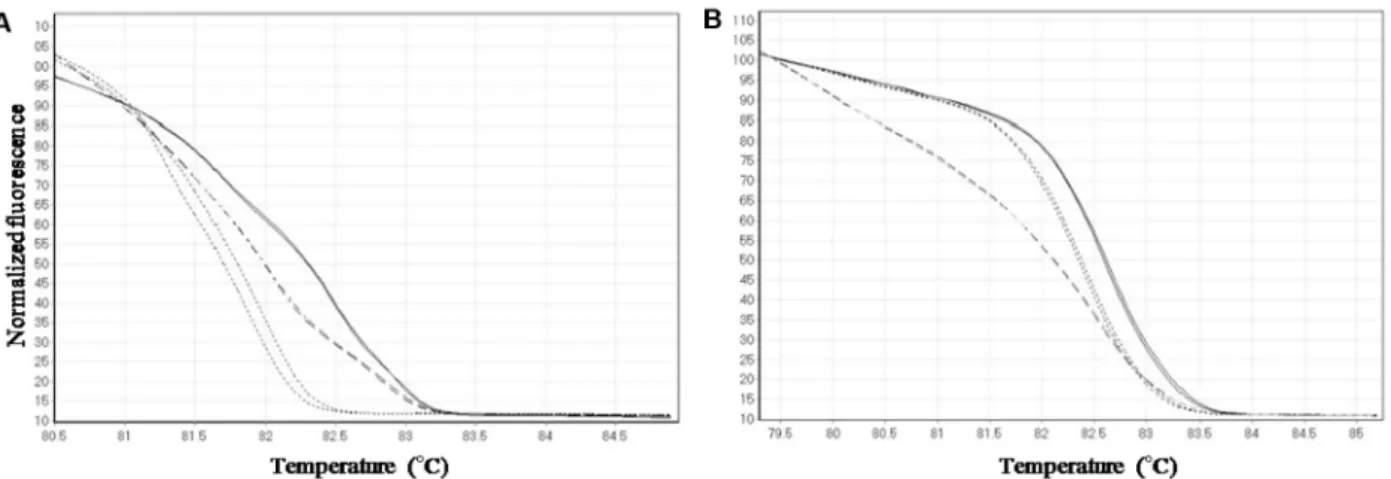
after checking if the PCR product contained intron sequences using Intron Finder (http://solgenomics.wur.nl/tools). The anthocyanin related gene sequences originated from potato, petunia, and tomato. The COS II markers (Table 2), which are localized close to the anthocyanin related genes on the tomato genetic map, were selected from the Sol Genomics Network (http://solgenomics.wur.nl). Sequences of the RFLP probe (Table 3), which are localized close to the COS II markers producing polymorphisms, were used for primer design. All designed primers were used to develop a DNA marker for the identification of either a purple or a green hypocotyl in ten purple and three green hypocotyl tomatoes using a high resolution melting (HRM) technology based assay.
Genomic DNA Preparation, PCR, and Distance Calculation Genomic DNA was extracted as described by Kang et al. (2001). PCR reactions were performed in a 20 µL volume containing 1X buffer, 0.2 mM dNTPs, 0.5 mM each of forward and reverse primer, 20 ng of genomic DNA, and 0.5 units of Taq DNA polymerase (Genet Bio Inc., Korea, Cat. No.
G1000). A Mastercycler (Eppendorff, USA) was used under the following conditions: denaturation at 94℃ for 5 min;
35 cycles of 94℃ for 30 s, 55℃ for 30 s, and 72℃ for 30 s; and a final elongation at 72℃ for 5 min. PCR products were separated by 1.5% agarose gel electrophoresis. PCR bands from a Hy primer set (Table 3) were loaded after digestion by Hpa II at 37℃ for 2 h.
A HRM technology based assay was performed using a
Table 3. Primers designed from RFLP fragments localized near COS II markers.
Marker Primer sequence (5’-3’) Fragment size (bp) CD3 F
z: GTTCGTGGACGACCAGTTCT 176
R: AATCTTGCCATTCCATCCAA
Hy F: GAAGCCCTCCTCTATAGTTTCC 414 (cLET2D4) R: GGTCCTGAAATGTCCGATTC
TG79 F: GGGGAACCCTCTGGAATAAA 223 R: AAGGAGAAATGGGGAAAACG
cLED11L12 F: AGGCTTCATAGGAGCAGCAG 195 R: GAAAATGTGGGAACGGTGTC
cTOB9B13 F: AAAGTGTATTTGCGGGTTCG 230 R: ATCGCCGTAAGCACTTGACT
cTOB1K3 F: CCCAACCGTTCACTCTCCTA 218 R: TCCATTGACCCGAATATCGT
z
F, forward primer; R, reverse primer.
Fig. 1. Hypocotyls showing purple (A) and green (B) color.
Table 4. Segregation of purple or green color of tomato hypocotyls.
Plant material
No. of phenotype
Expected ratio Purple:
Green
ϰ
2 P Purple GreenNWp1 20 0 1:0
NWg3 0 20 0:1
F1 (NWp1 × NWg3) 20 0 1:0
F2 (NWp1 × NWg3) 120 40 3:1 0.000 1.000 BC1F1 (F1 × NWg3) 40 41 1:1 0.024 0.912