22(4) : 270-274 (2016)
https://doi.org/10.20307/nps.2016.22.4.270
270
Effect of Extraction Conditions of Green Tea on Antioxidant Activity and EGCG Content: Optimization using Response Surface Methodology
Mun Jun Kim, Jong Hoon Ahn, Seon Beom Kim, Yang Hee Jo, Qing Liu, Bang Yeon Hwang, and Mi Kyeong Lee*
College of Pharmacy, Chungbuk National University, Cheongju 28644, Korea
Abstract − Green tea, the leaves of Camellia sinsneis (Theaceae), is generally acknowledged as the most consumed beverage with multiple pharmacological functions including antioxidant activity. This study was performed to analyze the effect of extraction conditions of green tea on its antioxidant effects using DPPH assay.
Three extraction factors such as extraction solvent (EtOH, 0 - 100%), extraction time (3 - 15 min) and extraction temperature (10 - 70oC) were analyzed and optimized extraction condition for antioxidant activity of green tea extract (GTE) was determined using response surface methodology with three-level-three-factor Box-Behnken design (BBD). Regression analysis showed a good fit of data and the optimal conditions of extraction were found to be 57.7% EtOH, 15 min and 70oC. Under this condition, antioxidant activity of experimental data was 88.4%
which was almost fit to the ideal value of 88.6%. As epigallocatechin gallate (EGCG) is known for the major ingredient for antioxidant activity of green tea, we investigated the effect of EGCG on antioxidant activity of GTE.
EGCG showed antioxidant activity with the IC50 value of 4.2µg/ml and a positive correlation was observed between EGCG content and the antioxidant activity of GTE with R² = 0.7134. Interestingly, however, GTE with 50 – 70% antioxidant activity contain less than 1.0µg/ml of EGCG, which is much lower than IC50 value of EGCG. Therefore, we suppose that EGCG together with other constituents contribute to antioxidant activity of GTE. Taken together, these results suggest that green tea is more beneficial than EGCG alone for antioxidant ability and optimal extraction condition of green tea will be useful for the development of food and pharmaceutical applications
Key words − Green tea, Optimization, Response surface methodology, Antioxidant activity, Epigallocatechin gallate
Introduction
The leaves of Camellia sinsneis (Theaceae), commonly called as green tea, is one of the most popular beverage for a long time. Green tea is generally used as a beverage to help digesting, shortening their sleep, clearing the head and eyes and detoxifying the body. Diverse beneficial effects to prevent cancer, high cholesterol, allergy and diabetes are also reported.1-4 Epigallocatechin gallate (EGCG) is a characteristic constituent of green tea and is known to exert diverse effect of green tea.5-7
Oxidative stress is derived from the imbalance between the production of reactive oxygen species and antioxidant defenses and contributes to age-related symptoms and pathogenesis of many diseases such as cancer, diabetes, atherosclerosis, neurodegenerative diseases and osteoporosis.8-9 Therefore, consumption of antioxidant-rich fruits or botanical
extract are thought to enhance health and minimize the senescence and chronic diseases.10-12 Green tea also has been reported to exert beneficial effect against various diseases, in parts, via antioxidant effects.13-14
For use of green tea as a beverage or development as functional products, extraction procedure is required.
Many factors during extraction procedure such as extraction solvent, extraction time, extraction temperature and solid- liquid ratios determine efficacy of extract.15-16 Therefore, optimization of extraction condition is required for maxi- mum efficacy. Response surface methodology (RSM) is a useful statistical tool that can derive optimal condition by taking into several factors simultaneously. It consists of mathematical and statistical methods and derives optimal condition based on experimental data obtained from rationally designed experiment.17-19 Therefore, RSM is effective method for optimization of extraction condition, especially in case of several variables.
In the present study, we investigated the effect of extraction conditions of green tea on antioxidant activity using RSM. As EGCG is known for the major ingredient
*Author for correspondence
Mi Kyeong Lee, Ph.D., College of Pharmacy, Chungbuk National University, 1 Chungdae-ro, Cheongju 28644, Korea
Tel: +82-43-268-2818; E-mail: [email protected]
for antioxidant activity of green tea, we investigated the effect of EGCG content of green tea on antioxidant activity. Ultimately, optimized extraction condition for maximum antioxidant activity was suggested using RSM.
Experimental
Plant material− Dried green tea, the leaves of Camellia sinensis, was purchased from the local herbal market, Chungbuk, Korea in March 2015. They were identified by the herbarium of College of Pharmacy at Chungbuk National University, where a voucher specimen was deposited (CBNU201503-GT). EGCG was purchased from Sigma-Aldrich Chemical Co (St. Louis, MO, USA).
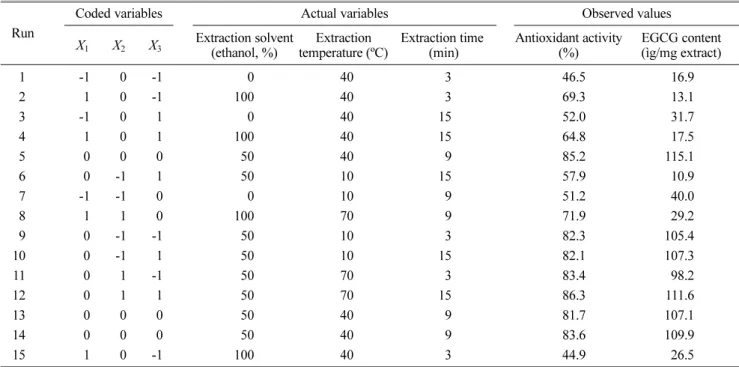
Experimental design for response surface methodo- logy− A Box-Behnken design (BBD) with three variables and three levels using Minitab17 software (Eretec Inc.) was chosen to optimize the extraction conditions for GTE.
Extraction solvent (X1), extraction time (X2) and extraction temperature (X3) were chosen for independent variables.
The ranges of these variables were determined as extraction solvent (X1,ethanol ratio as 0,50 and 100%), and extraction time (X2, 3, 9 and 15 min) extraction temperature (X3, 10, 40, and 70 ºC) on the basis of a preliminary single factor experiment. The variables were coded at three levels (-1, 0, and 1) and the complete design consisted of 15 experimental points including three replication of the center points (all variables were coded as zero), as shown in Table 1. The antioxidant activity was selected as the
dependent responses.
Regression analysis was performed according to the experimental data; the mathematical model can be explained by the following equation:
Y is the response, β0 is the constant coefficient, βi are the linear coefficients, βii are the quadratic coefficients and βij are the interaction coefficients. The statistical significance of the coefficients in the regression equation was checked by analysis of variance (ANOVA). The fitness of the polynomial model equation to the responses was evaluated with the coefficients of R2 and the lack of fit was evaluated using F-test.
Y β0 βiXi
i 1=
∑3 βiiXi2 i 1=
∑3 βijXiXj 1 i j≤ ≤
∑3
+ + +
=
Table 1. A Box-Behnken design for independent variables and their responses
Run
Coded variables Actual variables Observed values
X1 X2 X3 Extraction solvent (ethanol, %)
Extraction temperature (ºC)
Extraction time (min)
Antioxidant activity (%)
EGCG content (ìg/mg extract)
1 -1 0 -1 0 40 3 46.5 16.9
2 1 0 -1 100 40 3 69.3 13.1
3 -1 0 1 0 40 15 52.0 31.7
4 1 0 1 100 40 15 64.8 17.5
5 0 0 0 50 40 9 85.2 115.1
6 0 -1 1 50 10 15 57.9 10.9
7 -1 -1 0 0 10 9 51.2 40.0
8 1 1 0 100 70 9 71.9 29.2
9 0 -1 -1 50 10 3 82.3 105.4
10 0 -1 1 50 10 15 82.1 107.3
11 0 1 -1 50 70 3 83.4 98.2
12 0 1 1 50 70 15 86.3 111.6
13 0 0 0 50 40 9 81.7 107.1
14 0 0 0 50 40 9 83.6 109.9
15 1 0 -1 100 40 3 44.9 26.5
Fig. 1. Chemical structure of EGCG.
Antioxidant activity− The antioxidant activity of GTE was evaluated by measuring the free radical scavenging activity using 2,2-diphenyl-1-picrylhydrazyl (DPPH)by measuring the absorbance at 517 nm.20 The relative radical scavenging activity (%) was calculated as [1-observed value of solution with sample and DPPH / observed value of solution with DPPH]× 100.
HPLC conditions for quantitation of EGCG− Analysis was performed using a Waters HPLC system equipped with Waters 600s pumps,a 996 photodiode array detector, and Waters Empower software using Pheno- menex Gemini-NX 5µ C18 110A (150 × 10.0 mm) for quantitation. Chromatographic separation was accomplished using acetonitrile with water (10:90 to 50:50) at a flow rate of 2.0 ml/min. The wavelength for detection was set at 291 nm.
Stock standard solution of EGCG was prepared in DMSO at a concentration of 1.0 mg/ml. Standard working solutions were prepared with serial dilution of1.0, 0.5, 0.25, 0.125, 0.0625 and 0.03125 mg/ml and used for a calibration curve. A good linearity of calibration curve for EGCG was achieved with a correlation coefficient of 0.9983.
For the preparation of GTE, 1 g of the dried powdered green tea were weighed accurately and extracted with 10 ml extraction solvent as indicated.
Result and Discussion
To maximize the antioxidant effect of green tea, the effects of three extraction variables, such as extraction solvent, extraction temperature and extraction time were
tested in this study. The ranges of these variables were selected through apreliminary single factor experiment as extraction solvent (X1, ethanol ratio as 0 - 100%), extraction time (X2, 3 - 15 min) and extraction temperature (X3, 40 - 70 ºC). Antioxidant effect of GTE was analyzed usinga Box-Behnken design (BBD) with three-level-three-factor, as shown in Table 1.
Multiple regression analysis of the experimental data yielded this second-order polynomial regression equations as follows:
Antioxidant activity (% of control)
= 55.409 – 1.245X1+ 0.116X2– 0.076X3+ 0.011X12– 0.024X22 + 0.001X32+ 0.008X1X2– 0.001X2X3 – 0.004X1X3
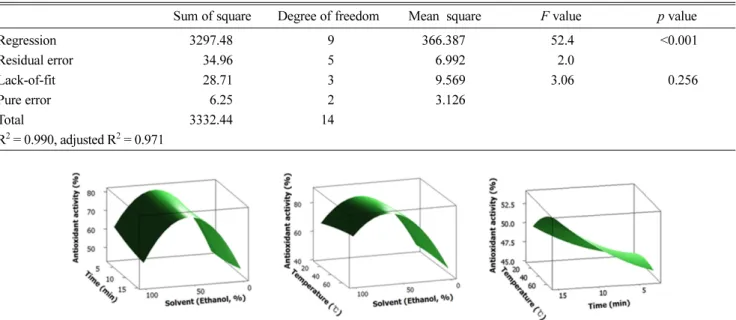
The significance of each coefficient was determined using t-tests and p-values (Table 2). ANOVA analysis of the regression equation was also used for the deter- mination of significance and suitability (Table 3). Greater F-values and smaller p-valueswere considered significant.
The quality of the model was also determined by lack of fit.
As shown in Table 2, the linear term of ethanol concentration (X1)and the quadratic term of ethanol concentration (X12) showed great importance for the antioxidant effect of green tea. However, other factors did not show any significant effects. Determination of the suitability was confirmed by an F-value of 52.4 and a p- value of < 0.001.The values of coefficient determination (R2) and the adjusted coefficient determination (adj. R2) of the predicted model in this response were 0.990 and 0.971, respectively, which suggested a high degree of correlation between observed and predicted values (Table 3).The relationship between every two variables in the Fig. 2. (A) HPLC chromatogram of EGCG and (B) HPLC chromatogram of GTE.
antioxidant effect was shown in three-dimensional response surface plots (Fig. 3).
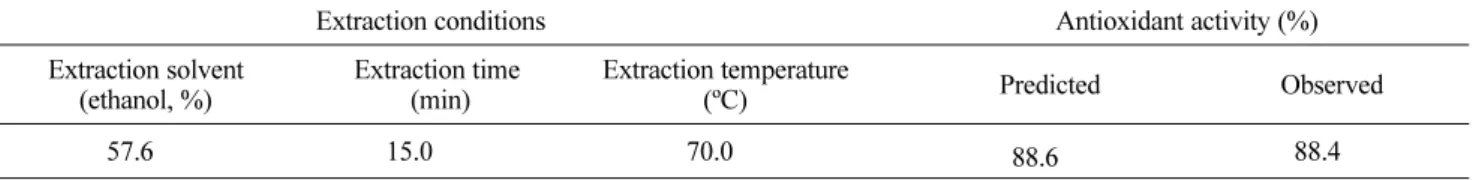
Based on these results, the optimal extraction conditions for maximum antioxidant effectwere suggested to be an extraction solvent (EtOH concentration) of 57.6%; an extraction temperature of 70ºC; and an extraction time of 15 min,which predicted 88.6% activity. GTEprepared under these conditions gave 88.4% activity, which was well-matched with predicted values (Table 4).
As EGCG is known for the major ingredient for antioxidant activity of green tea, we investigated the effect of EGCG content of GTE on antioxidant activity.
EGCG showed antioxidant activity with the IC50 value of 4.2µg/ml in our assay system. The EGCG content in GTE was greatly varied depending on extraction conditions
(Table 1). Therefore, correlations between antioxidant activity and EGCG content was analyzed. High correlation was observed between antioxidant activity and EGCT content, as demonstrated by the value of R2 was 0.7134 (Fig. 4). Interestingly, however, GTE with 50 – 70%
antioxidant activity contains less than 1.0µg/ml of EGCG, which is much lower than IC50 value of EGCG.
Green tea characteristically contains high contents of catechin derivatives. Catechin belongs to flavonoids and has the flavan skeleton with a hydroxyl group at C-3-ols.
It is well known for its diverse biological activities of green tea. In addition, it is converted to tannin by poly- merization. Green tea contains diverse catechin derivativs and (−)-epicatechin (EC), (−)-epigallocatechin (EGC), (−)- epicatechin-3-gallate (ECG) and EGCG are known as Table 2. Regression coefficients and their significances in the second-order polynomial regression equation forantioxidant activity of GTE
Coefficient Standarderror coefficient t value p value
Intercept 55.409 5.370 10.317 <0.001
X1 -1.245 0.079 -15.818 <0.001
X2 0.116 0.795 0.146 0.889
X3 -0.076 0.149 -0.509 0.632
X12 0.011 0.001 19.047 <0.001
X22 -0.024 0.038 -0.637 0.552
X32 0.001 0.002 0.588 0.582
X1X2 0.008 0.004 1.882 0.119
X1X3 -0.001 0.001 -1.457 0.205
X1X2 -0.004 0.007 -0.577 0.589
Table 3. ANOVA for response surface regression equation
Sum of square Degree of freedom Mean square F value p value
Regression 3297.48 9 366.387 52.4 <0.001
Residual error 34.96 5 6.992 2.0
Lack-of-fit 28.71 3 9.569 3.06 0.256
Pure error 6.25 2 3.126
Total 3332.44 14
R2= 0.990, adjusted R2= 0.971
Fig. 3. Response surface plotanalysis of extraction solvent (X1), extraction temperature (X2) and extraction time (X3) on antioxidant activity.
major constituents of green tea.21 All catechin derivatives of green tea are known for strong antioxidant activity in vitro and in vivo system.21-22 Among them, EGCG is the most abundant catechin of green tea and the most potent activity, which is followed by EGC > ECG > EC.23 Therefore, we suppose that EGCG is a major active constituents of GTE and other constituents of GTE also contribute to antioxidant activity of GTE.
Taken together, these results suggest that green tea has antioxidant ability and optimal extraction conditions of green tea will be useful for the development of food and pharmaceutical applications
Acknowledgement
This work was supported by the research grant of the Chungbuk National University in 2014.
References
(1) Zhang, L.; Pang, E.; Loo, R. R.; Rao, J.; Go, V. L.; Loo, J. A.; Lu, Q. Y. Proteomics 2011, 11, 4638-4647.
(2) Bornhoeft, J.; Castaneda, D.; Nemoseck, T.; Wang, P.; Henning, S.
M.; Hong, M. Y. J. Med. Food 2012, 15, 726-732.
(3) Rickman, C.; Lyer, A.; Chan, V.; Brown, L. Cur. Pharm. Biotechnol.
2010, 11, 881-886.
(4) Ramadan, G.; El-Beih, N. M.; Abd El-Ghffar, E. A. Br. J. Nutr.
2009, 102, 1611-1619.
(5) Du, G. J.; Zhang, Z.; Wen, X.D.; Yu, C.; Calway, T.; Yuan, C. S.;
Wang, C. Z. Nutrients 2012, 4, 1679-1691.
(6) Zhong, Y.; Chiou, Y. S.; Pan, M. H.; Shahidi, F. Food Chem. 2012, 134, 742-748.
(7) Steinmann, J.; Buer, J.; Pietschmann, T.; Steinmann, E. Br. J.
Pharmacol. 2013, 168, 1059-1073.
(8) Betteridge, D. J. Metabolism 2000, 49, 3-8.
(9) Yoshikawa, T.; Naito, Y. J. Japan Med. Ass. 2002, 45, 271-276.
(10) Gostner, J. M.; Becker, K.; Ueberall, F.; Fuchs, D. Food Chem.
Toxicol. 2015, 80, 72-79.
(11) García-Niño, W. R.; Zazueta, C. Pharmacol. Res. 2015, 97, 84-103.
(12) de Oliveira, C. C.; de Araújo C. V. M.; Ares, G.; Granato, D. Crit.
Rev. Food Sci. Nutr. 2015, 55, 1456-1473.
(13) Legeay, S.; Rodier, M.; Fillon, L.; Faure, S.; Clere, N. Nutrients 2015, 7, 5443-5468.
(14) Tsai, C. F.; Hsu, Y. W.; Ting, H. C.; Huang, C. F.; Yen, C. C. Food Chem. 2013, 136, 1337-1344.
(15) Zhang, W. M.; Huang, W.Y.; Chen, W. X.; Han, L.; Zhang, H. D.
Molecules 2014, 19, 16416-16427.
(16) Jeong, J. Y.; Jo, Y. H.; Kim, S. B.; Liu, Q.; Lee, J. W.; Mo, E. J.;
Lee, K. Y.; Hwang, B. Y.; Lee, M. K. Bioorg. Med. Chem. Lett. 2015, 25, 2269-2274.
(17) Jeong, J. Y.; Jo, Y. H.; Lee, K. Y.; Do, S. G.; Hwang, B. Y.; Lee, M.
K. Bioorg. Med. Chem. Lett. 2014, 24, 2329-2333.
(18) Bezerra, M. A.; Santelli, R. E.; Oliveira, E. P.; Villar, L. S.;
Escaleira, L. A. Talanta 2008, 76, 965-977.
(19) Ferreira, S. L. C.; Bruns, R. E.; Ferreira, H. S.; Matos, G. D.;
David, J. M.; Brandão, G. C.; Da Silva, E. G. P.; Portugal, L. A.; dos Reis, P. S.; Souza, A. S.; dos Santos, W. N. L. Anal. Chim. Acta 2007, 597, 179-186.
(20) Kim, S. B.; Jo, Y. H.; Liu, Q.; Ahn, J. H.; Hong, I. P.; Han, S. M.;
Hwang, B. Y.; Lee, M. K. Molecules 2015, 20, 19764-19774.
(21) Lambert, J. D.; Elias, R. J. Arch. Biochem. Biophys. 2010, 501, 65- 72.
(22) Senthil K. V.; Arulmathi, K.; Srividhya, R.; Kalaiselvi, P. Exp.
Gerontol. 2008, 43, 176-18.
(23) Jovanovic, S. V.; Hara, Y.; Steenken, S.; Simic, M. G. J. Am. Chem.
Soc. 1995, 117, 9881-9888.
Received June 30, 2016 Revised August 18, 2016 Accepted August 20, 2016 Table 4. Predicted and observed values of antioxidant activity yield under optimized conditions
Extraction conditions Antioxidant activity (%)
Extraction solvent (ethanol, %)
Extraction time (min)
Extraction temperature
(ºC) Predicted Observed
57.6 15.0 70.0 88.6 88.4
Fig. 4. Correlation of EGCG or EGCG content in GTE and with antioxidant activity.