Korean Circulation Journal
Introduction
Left ventricular (LV) diastolic function plays an important role in
Print ISSN 1738-5520 • On-line ISSN 1738-5555
Utility of Global Strain by Two-Dimensional and Three-Dimensional Speckle Tracking for Assessing Left Ventricular Diastolic Function:
Comparison with Pressure Wire Analysis
Sung-Hee Shin, MD, Sang-Don Park, MD, Seong-Il Woo, MD, Dae-Hyeok Kim, MD, Keum-Soo Park, MD, and Jun Kwan, MD
Division of Cardiology, Inha University College of Medicine, Incheon, Korea
Background and Objectives: We evaluated the utility of two-dimensional (2D) and three-dimensional (3D) left ventricular (LV) global myocardial deformity parameters for assessing LV diastolic function by comparing invasive measures of LV performance.
Subjects and Methods: Echocardiography and LV pressure were assessed in 39 patients. Myocardial LV longitudinal, circumferential, and radial deformations, as well as area strain, were evaluated utilizing 2D and 3D speckle tracking software. The 2D early diastolic strain rate (2D-SRe) was measured from the 3 apical and 3 short axis views. The 3D diastolic index (3D-DI) was calculated by the % change of global strain during the first one-third of the diastolic period. LV end diastolic pressure (LVEDP) and the rate of LV pressure change (dP/dt) were collected using a pressure-conducted catheter and tau was calculated.
Results: dP/dt
minwere related to early mitral annular velocity (e’), 2D-SRe
long,2D-SRe
radial, as well as 3D-DI
long, and 3D-DI
as. Additionally, LVEDP was associated with the ratio of mitral early diastolic velocity (E) to 2D-SRe
long, 2D-SRe
circ, 2D-SRe
radial, 3D-DI
long, 3D-DI
circ, and 3D-DI
as. E/2D- SRe
long, E/2D-SRe
radial, E/3D-DI
long, and E/3D-DI
aswere comparable with E/e’ in predicting patients with elevated LVEDP. Among those patients with E/e’ of 8 to 15, E/3D-DI
longprovided incremental value in identifying those with LVEDP ≥15 mm Hg.
Conclusion: 2D-SRe
long, 2D-SRe
radial, 3D-DI
long, and 3D-DI
aswere related to LV relaxation, and the ratios of E to those parameters were asso- ciated with LVEDP. In addition, among patients with indeterminate E/e’, E/3D-DI
longoffered incremental value in predicting elevated LVEDP, suggesting it may provide supplementary information in the evaluation of LV diastolic function. (Korean Circ J 2013;43:615-621) KEY WORDS: Diastole; Echocardiography; Ventricular pressure.
Received: March 22, 2013 Revision Received: August 1, 2013 Accepted: August 12, 2013
Correspondence: Sung-Hee Shin, MD, Division of Cardiology, Inha Univer- sity College of Medicine, 27 Inhang-ro, Jung-gu, Incheon 400-711, Korea Tel: 82-32-890-2200, Fax: 82-32-890-2447
E-mail: [email protected]
• The authors have no financial conflicts of interest.
This is an Open Access article distributed under the terms of the Creative Commons Attribution Non-Commercial License (http://creativecommons.
org/licenses/by-nc/3.0) which permits unrestricted non-commercial use, distribution, and reproduction in any medium, provided the original work is properly cited.
evaluating patients with various cardiac diseases, and provides a predictive value for potential future cardiovascular outcomes.
1-4)The assessment of LV diastolic function is necessary in a routine echo- cardiographic exam, and Doppler echocardiography has been widely used to assess LV diastolic function non-invasively.
5)6)However, there are several drawbacks that limit the use of these conventional meth- ods in clinical settings. Newly-developed speckle tracking methods enable the assessment of regional and global LV function in more detail, while the utility of these myocardial deformity measurements in assessing diastolic function is yet to be fully established.
7)8)We hypothesized that myocardial deformity measurements can provide additional information for the assessment of LV diastolic function.
To test this hypothesis, we compared myocardial deformity mea-
surements with invasively measured LV pressure and LV pressure-
derived diastolic parameters using pressure wire.
Subjects and Methods
Thirty seven consecutive patients who had undergone cardiac ca- theterization were enrolled. Hemodynamic data were additionally obtained using the pressure wire in those patients who had under- gone a coronary angiogram with a variety of clinical indications and who had provided informed consent. Echocardiography was per- formed within 24 hours of catheterization. Those patients with atrial fibrillation or other significant arrhythmia, suboptimal echocardio- graphic window, or pressure recording were excluded. This study was approved by an institutional review committee of the Inha Uni- versity Hospital.
Echocardiographic analysis
Baseline transthoracic echocardiograms were performed with a frame rate of 40-60 Hz. Patients with insufficient two-dimensional (2D) image quality for the following analyses were excluded at this stage. Standard echocardiographic parameters, including LV vol- umes and ejection fraction (EF), peak early (E) and late (A) mitral in- flow velocities, deceleration time of early mitral flow velocity (DT), and early mitral annular velocity (e’) at the septal annular site were analyzed at an offline analysis workstation. 2D and 3D speckle track- ing (Artida TM®, Tokyo, Toshiba) were utilized to measure LV myo- cardial longitudinal, circumferential, and radial deformation, as well as area strain. For 2D speckle tracking measurements, the software automatically tracked the motion through the cardiac cycle after tracing the subendocardium of the LV manually. Tracking quality was verified for each segment with manual adjustment as required.
2D LV global early diastolic longitudinal strain rate (2D-SRe
long) was averaged from the apical 4 chamber, 2 chamber, and long axis views, and circumferential (2D-SRe
circ) and radial strain rates (2D-SRe
radial) were averaged from the 3 parasternal short axis views at the level of the mitral valve, papillary muscle, and apex. In addition, three- dimensional (3D) full volume images were acquired with a volume rate of 20-30 volumes/second and 3D LV global longitudinal, cir- cumferential, radial, and area strains were assessed through 3D wall motion tracking. After adjusting the orientation of 2D planes and tracing LV endocardial and epicardial borders on long axis im- ages manually, the software algorithm tracked the contour from frame to frame throughout the cardiac cycle, and strain data were displayed. A 3D diastolic index (3D-DI) was calculated by % change of global strain during the first one-third of the diastolic period, and global 3D-DI of longitudinal (3D-DI
long), circumferential (3D-DI
circ), radial (3D-DI
radial), and area strain (3D-DI
as) were calculated by aver- aging them from 16 LV segments.
9)Thity seven patients were analyzable by 2D speckle tracking for 2D-SRe
longand 36 patients for 2D-SRe
circand 2D-SRe
radial. 34 patients
were found to be analyzable by 3D speckle tracking. The intraob- server variability was assessed in 5 randomly selected patients. The coefficients of variability were 8.2% for 2D-SRe
long, 9.0% for 2D- SRe
circ, 13.4% for 2D-SRe
radial, 11.3% for 3D-DI
long, 12.1% for 3D-DIe
circ, 15.1% for 3D-DI
radial, and 11.5% for 3D-DI
as, respectively.
Hemodynamic measurement by pressure catheter
Hemodynamic data were collected using a pressure wire catheter.
A 0.014” sensor-tipped pressure guide wire (PressureWire®, RADI medical system, Uppsala, Sweden) was introduced into the LV to measure LV end-diastolic pressure and end-systolic pressure and maximal and minimal rates of LV pressure change (dP/dt
maxand dP/dt
min). LV pressure and dP/dt were recorded for at least one re- spiratory cycle, calculated electronically for every beat and aver- aged over the period of measurement, after excluding any poor re- cording values.
Statistical analysis
Continuous variables were expressed as mean±standard devia- tion and categorical variables were expressed as numbers and per- centages. We categorized the patients in tertiles according to dP/dt
minlevel and applied a Wilcoxon rank sum test for trends across the ordered groups. Correlation analysis was used to compare echo- cardiographic measurements and invasively measured parameters.
Receiver operating characteristic curves were constructed and con- fidence intervals for areas under the curves (AUC) were calculated to compare the predictive values of the ratios of E to various echo- cardiographic measurements. For all tests, a p<0.05 was considered to be significant.
Results
Patients characteristics
Table 1 illustrates the baseline characteristics. The mean age of the 39 patients was 60±12 years (21 men). Among them, 14 patients were smokers, 11 patients had diabetes, 13 patients had hyperten- sion, and 8 patients had dilated cardiomyopathy. Mean indexed LV end-diastolic volume was 85±39 mL/m
2and mean left ventricular ejection fraction (LVEF) was 46±16%. 19 patients had EF ≥50% and 13 patients had regional wall motion abnormalities.
Echocardiographic parameters according to the degree of left ventricular relaxation markers
Patients with lower minimal rates of LV filling had higher e’, 2D- SRe
long, 2D-SRe
radial, 3D-DI
long, and 3D-DI
asthan those with higher dP/
dt
min(Table 2). Fig. 1 demonstrates a fair correlation between e’, 2D-
SRe
long, 3D-DI
long, or 3D-DI
asand dP/dt
min.
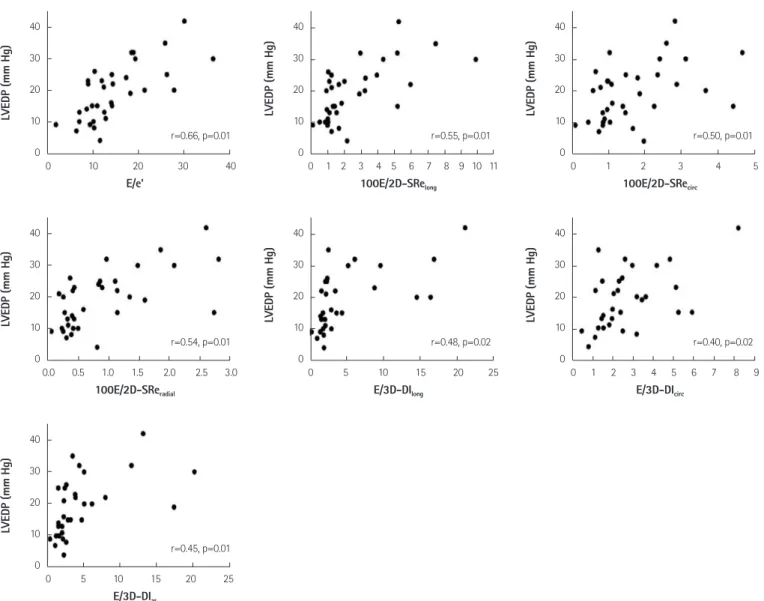
Predictive value of E to various echocardiographic parameters in identifying patients with elevated left ventricular end diastolic pressure
Left ventricular end diastolic pressure (LVEDP) had a significant cor- relation with E/e’ as well as E/2D-SRe
long, E/2D-SRe
circ, E/2D-SRe
radial, E/3D-DI
long, E/3D-DI
circ, and E/3D-DI
as(Fig. 2). Fig. 3 showed the com- parable predictive values of the ratios of E to 2D-SRe
long, 2D-SRe
radial, 3D-DI
long, and 3D-DI
as, which had acceptable correlations with the
marker of LV relaxation, as compared with E/e’. Although E/3D-DI
longhad the highest AUC among the variety of parameters, it did not offer any incremental value in addition to E/e’, which is commonly used to estimate LV filling pressure, in terms of identifying patients with LVEDP ≥15 mm Hg (p=0.31). However, in the 21 patients who had E/e’ of 8 to 15, E/3D-DI
longprovided some incremental value for predicting those patients with increased LVEDP (p=0.04) (Fig. 4).
E/2D-SRe
longshowed increased AUC to predict LVEDP in this popul- ation, despite not being statistically significant. Those patients with E/e’ of 8 to 15 had more preserved LVEF than those with E/e’ <8 or
>15 (37.2±18.7% vs. 52.3±14.6%, p=0.007). 14 of 21 patients (67%) had LVEF ≥50% among patients with indeterminate E/e’.
Discussion
Left ventricular diastolic dysfunction can be a sensitive marker for cardiovascular disease and provides prognostic information in a variety of patients.
4)10-12)Determining LV filling pressure can prove cr-ucial in the diagnosis and treatment of patients with suspicious heart failure. Furthermore, abnormal LV diastolic filling pattern and elevated LV filling pressure predict worsened cardiovascular out- comes and the degree to which pressures can be reduced may pre- dict survival.
13)14)Over the past two decades, echocardiography has provided an important role in evaluating LV diastolic function. Tradi- tionally, Doppler echocardiography, including tissue Doppler imag- ing, has become widely used to assess LV diastolic function and dia- stolic filling pressure. Mitral inflow pattern is helpful in identifying patients with abnormal LV relaxation and predicting diastolic filling pressure. E’ is also commonly used to assess LV relaxation and filling pressure, since it is less dependent on preload. Prior studies have shown that E/e’ is a useful parameter in estimating LV diastolic Table 1. Baseline characteristics
Age (years) 60±12
Male (%) 21 (54)
Systolic blood pressure (mm Hg) 128±20
Diastolic blood pressure (mm Hg) 78±11
Heart rate (bpm) 74±11
Echocardiographic parameters
LVEDV (mL/m
2) 85.4±39.3
LVESV (mL/m
2) 43.8±14.9
LAD (mm) 43.4±7.8
LVEF (%) 46.0±16.4
E (cm/sec) 72.1±24.1
A (cm/sec) 72.9±23.6
DT (msec) 216.5±67.0
e’ (cm/sec) 5.6±1.7
Underlying disease (%)
Diabetes 11 (28)
Hypertension 13 (33)
Dilated cardiomyopathy 8 (24)
A: peak late mitral inflow velocity, DT: deceleration time, E: peak late mitral inflow velocity, e’: mitral annular velocity, LVEDV: left ventricular end-dia- stolic volume, LVEF: left ventricular ejection fraction, LVESV: left ventricular end-systolic volume
Table 2. Echocardiographic measurements according to the degree of minimal rate of left ventricular filling -dP/dt
min≤-1800 mm Hg/s
-1800<-dP/dt
min≤-1100 mm Hg/s
-dP/dt
min>-1100 mm Hg/s p for trends TDI
e’ 5.99±1.17 5.92±1.73 4.52±0.91 0.01*
2D STE
2D-SRe
long, S
-10.54±0.14 0.48±0.26 0.27±0.15 0.01*
2D-SRe
circ, S
-10.63±0.21 0.61±0.39 0.46±0.22 0.08
2D-SRe
radial, S
-11.60±0.49 1.31±0.92 1.03±0.84 0.02*
3D STE
3D-DI
long31.70±16.70 29.49±5.65 11.10±17.47 0.05*
3D-DI
circ35.84±13.13 38.14±28.55 32.09±15.87 0.18
3D-DI
radial38.51±17.08 38.56±19.73 35.09±30.41 0.30
3D-DI
as29.10±7.22 27.89±15.41 16.12±7.91 0.01*
*p<0.05. TDI: tissue Doppler imaging, 2D STE: 2D speckle tracking echocardiography, 3D STE: 3D speckle tracking echocardiography
pressure non-invasively.
15)16)However, E/e’ is less sensitive to in- creased filling pressure, especially when EF is preserved. E’ from sep- tal annulus, lateral annulus, or both has a limitation in terms of re- flecting LV global relaxation, especially among patients with regional wall motion abnormalities. In addition, it cannot specifically repre- sent intrinsic LV diastolic properties.
Recently, new technological advances in echocardiography, spe- ckle tracking echocardiography, enable a detailed assessment of LV systolic and diastolic function, including measuring myocardial de- formation in radial, circumferential, and longitudinal directions. While these deformation measurements have advantages in angle-inde- pendency and relative load-independency as compared with con- ventional Doppler measurements, the utility of strain and strain rate in assessing LV diastolic function remains uncertain and subject to further investigation. Prior animal studies presented the relationship between longitudinal early diastolic strain rate and myocardial stiff- ness and LVEDP.
17)18)Wang et al.
19)has shown that the ratio of mitral early diastolic strain rate during the isovolumic relaxation period was predictive of LV filling pressure with reasonable accuracy, par- ticularly for patients with normal EF and in those with regional ab- normalities. More recently, 3D speckle tracking has developed fur- ther to overcome the intrinsic limitations of 2D speckle tracking.
While 2D speckle tracking suffers the inherent limitations of 2D im- aging, such as the use of foreshortened images and geometric re- modeling, and has a problem in tracking out-of-motion adequately, 3D speckle tracking has a theoretical advantage in tracking the sp-
eckles in and out of the imaging planes.
20-22)When considering he- art movements in the 3D space, 3D speckle tracking may be a prom- ising technique for evaluating myocardial mechanics in a more ac- curate and complete way. In our study, we evaluated the utility of the measurements by 2D and 3D speckle tracking for assessing di- astolic function, and found that diastolic longitudinal strain and strain rate by 2D and 3D speckle tracking and the diastolic index of area strain were associated with the indices of LV relaxation and the ratios of mitral E to these parameters related to LVEDP. Furthermore, the ratio of mitral E to 3D-DI
longprovided additional information in predicting elevated LVEDP among those patients with E/e’ of 8 to 15, who were characterized as having more preserved LVEF. Deforma- tion parameters may be beneficial in assessing diastolic function by differentiating active myocardial movement from passive transla- tional or tethering motion and reflecting LV global relaxation, un- like tissue Doppler measurements. Although the ratio of E to 2D- SRe
longalso led to increased AUC in addition to E/e’ in this popul- ation, it did not reach the level of statistical significance in our data.
This may derive from the theoretical advantages of 3D speckle tr- acking in measuring more real deformation data from the 3D space through the acquisition of full volumetric dataset. However, the sample size was too small to draw conclusive statements in the present study. In addition, 3D speckle tracking has limitations in terms of its relatively low temporal and spatial resolution, although these limitations are expected to improve with technological ad- vances in the near future. Low temporal resolution, in particular, Fig. 1. Correlations between the echocardiographic parameters and the minimal rate of left ventricular filling.
3000
2000
1000
0
3000
2000
1000
0
3000
2000
1000
0
3000
2000
1000
0
3000
2000
1000
0 Em (cm/sec)
3D-DIlong
2D-SRelong, S-1
3D-DIas
2D-SReradial, S-1
-dP/dtmin (mm Hg/s)-dP/dtmin (mm Hg/s) -dP/dtmin (mm Hg/s)-dP/dtmin (mm Hg/s) -dP/dtmin (mm Hg/s)
0.0 2.5 5.0 7.5 10.0
0 10 20 30 40 50 60
0.00 0.25 0.50 0.75 1.00
0 10 20 30 40 50 60
0 1 2 3 4
r=0.41, p=0.02
40 30 20 10 0
40 30 20 10 0
40 30 20 10 0
40 30 20 10 0
40 30 20 10 0
40 30 20 10 0
40 30 20 10 0 E/e’
100E/2D-SReradial
E/3D-DIas
100E/2D-SRelong
E/3D-DIlong
100E/2D-SRecirc
E/3D-DIcirc
LVEDP (mm Hg)LVEDP (mm Hg)LVEDP (mm Hg) LVEDP (mm Hg)LVEDP (mm Hg) LVEDP (mm Hg)LVEDP (mm Hg)
0 10 20 30 40
0.0 0.5 1.0 1.5 2.0 2.5 3.0
0 5 10 15 20 25 r=0.66, p=0.01
r=0.54, p=0.01
r=0.45, p=0.01
r=0.55, p=0.01
r=0.48, p=0.02
r=0.50, p=0.01
r=0.40, p=0.02 0 1 2 3 4 5 6 7 8 9 10 11
0 5 10 15 20 25
0 1 2 3 4 5
0 1 2 3 4 5 6 7 8 9
Fig. 2. Correlations between the ratio of E to various echocardiographic measures and left ventricular end diastolic pressure (LVEDP).
Fig. 3. Receiver operating characteristics curves of the ratio of E to various echo measures in identifying patients with left ventricular end diastolic pressure ≥15 mm Hg.
1.00 0.75 0.50 0.25
0.00
1-specificity
Sensitivity
0.00 0.25 0.50 0.75 1.00
E/2D-SRelong: 0.77 E/3D-DIas: 0.85 Reference
E/3D-DIlong: 0.89 E/e’: 0.84
Fig. 4. Receiver operating characteristics curves of the ratio of E to various echo measures in identifying patients with left ventricular end diastolic pressure ≥15 mm Hg among those patients with E/Em 8 to 15.
1.00 0.75 0.50 0.25
0.00
1-specificity
Sensitivity
0.00 0.25 0.50 0.75 1.00
E/e’: 0.62 Reference
E/e’+E/3D-DI: 0.89