529
Age-Related Changes in Left Ventricular Torsion as Assessed by 2-Dimensional Ultrasound Speckle Tracking Imaging
Hyun Jik Lee, MD, Bong Soo Kim, MD, Jae Hoon Kim, MD, Hee Sang Jang, MD,
Byung Seok Bae, MD, Hyun Jae Kang, MD, Bong Ryeol Lee, MD and Byung Chun Jung, MD
Department of Cardiology, Fatima General Hospital, Daegu, KoreaABSTRACT
Background and Objectives
: The newly developed 2-dimensional ultrasound speckle tracking imaging (2D-STI) has enabled researchers to assess the changes of left ventricular (LV) rotation and torsion. The aims of the pre- sent study are to establish normal values and to examine the effect of advancing age on left ventricular torsion.
Subjects and Methods
: We enrolled 182 healthy persons in this study. After examined the standard clinical echo- cardiographic parameters, we obtained the degree of the LV rotation at the basal and apical levels of the short axis view with using a customized software program EchoPAC, GE.
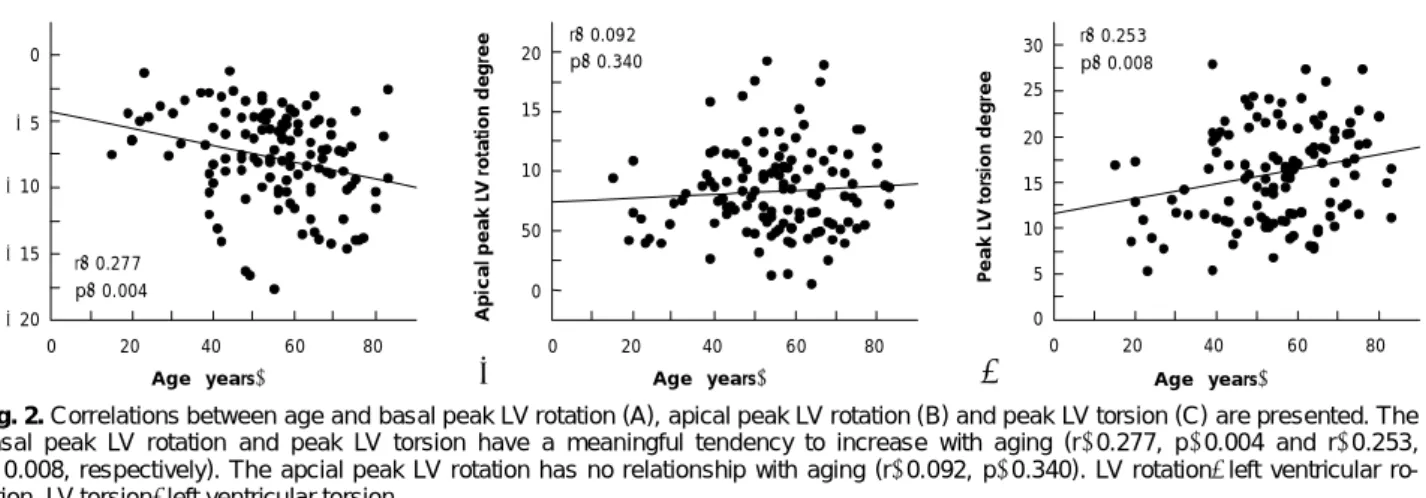
Results: Among the 182 healthy subjects, 109 healthy subjects were finally included (49 males and 60 females) due to the failure of obtaining reliable rotational patterns (feasibility: 59.8%). The basal and apical peak LV rotations during systole were 8.14±3.55 degrees and 8.48±3.70 degrees, respectively. The basal peak LV rotation and peak LV torsion had a tendency to increase with aging (r=0.277, p=0.004 and r=0.253, p=0.008, respectively). All the values of the basal LV rotation during sys- tole tended to increase with aging. The apical LV rotation had no relationship with aging throughout the entire cardiac cycle.
Conclusion: 2D-STI was a feasible methodology to measure the LV rotation. The peak LV torsion during systole shows statistically significant augmentation with advancing age, and this is mainly due to the in- creased basal LV rotation.
(Korean Circ J 2008;38:529-535)KEY WORDS:
Age factors; Echocardiography, Doppler; Left ventricle; Torsion.
Introduction
The recent advancements in echocardiographic imag- ing techniques have enabled the detection of tissue pixels and the sequential tracking of these acoustic markers, and this allows for new insights on the assessment of cardiac function. As one of these advancements, 2-di- mensional ultrasound speckle tracking imaging (2D- STI) has been developed and applied to assessing car- diac function with using new parameters such as the torsional change of the left ventricle (LV), which is de- fined as the wringing motion of the heart that’s imparted by contraction of its obliquely oriented spiral myocar- dial fibers. This has only been recognized to a limited extend with using the previously available conventional echocardiography.
1)The torsional changes of the LV are composed of two temporally-related components, according to the car- diac cycle. One is the active contraction or twisting of spirally arranged myocardial fibers during systole, and this is known to contribute to cardiac ejection and it is related with the isovolumic relaxation period. The other is the passive relaxation or untwisting of these fibers during diastole for accommodating atrial flow. On the other hand, aging is associated with subtle alterations of cardiac performance, and especially with the develop- ment of LV diastolic dysfunction, yet the causes of this are not fully understood.
2-4)Furthermore, the age-re- lated changes of LV torsion have not been fully evaluat- ed using 2D-STI.
Accordingly, the aims of the present study are 2- fold: 1) to establish normal values of LV torsion in a large group of healthy persons, and 2) to examine the effect of aging on LV torsion.
Subjects and Methods
Subjects
The subjects who underwent annual health exami-
Received: May 26, 2008 Revision Received: July 11, 2008 Accepted: July 17, 2008
Correspondence: Byung Chun Jung, MD,Department of Cardiology, Fatima General Hospital, 302-1 Sinam-dong, Dong-gu, Daegu 701-600, Korea Tel: 82-53-940-7214, 7459, Fax: 82-53-954-7417
E-mail: [email protected]
nations were consequently enrolled into the present study and these subjects were initially composed of 90 males and 92 females. Those subjects with valvular heart disease, left ventricular hypertrophy, hypertrophic car- diomyopathy, LV wall motion abnormality or a decre- ased left ventricular systolic function (LVSF) less than 50% were excluded. The subjects who had a history of coronary artery disease, hypertension, diabetes mellitus, pericardial effusion or atrial fibrillation, and those who presented with technical difficulties during their trans- thoracic echocardiographic examinations were also ex- cluded from the present study. After conventional echo- cardiographic study, 73 subjects were deemed unsuitable for 2D-STI study. Therefore 109 subjects were assessed for LV torsional changes with using 2D-STI. These stu- dy subjects were divided into quartiles according to age (Table 1).
Conventional echocardiographic study including the pulsed-wave and tissue Doppler imaging
Standard clinical echocardiographic examinations were done wherein the left ventricular ejection fraction (LVEF) and the wall-motion score were assessed. With using puls- ed-wave Doppler, the mitral inflow profiles such as the E-wave and A-wave, the E-deceleration time and the E/A velocity ratio were measured according to previously val- idated recommendations.
5)Tissue Doppler imaging of the septal mitral annulus (Sm) was also carried out with a 1-2 mm sample volume at the apical 4-chamber view.
The time interval between the peak of the R wave on the electrocardiogram and the aortic valve’s opening and closure, and the time from the R wave to the mitral valve’s opening and closure, were measured using pulse-wave Doppler from the LV outflow and inflow, respectively.
Echocardiographic study using 2-dimensional ultrasound speckle tracking imaging
For the purpose of performing 2D-STI, the LV short-
axis recordings were first obtained from three different levels such as the apical, mid-ventricular and basal levels, respectively, with using conventional 2-dimensional gray scale echocardiography (Vivid 7 scanner, GE Vingmed).
The transducer frequency (3.5 MHz), the sampling rates (70 to 110 frames per second) and the sector width (as narrow as possible) were adjusted for obtaining the op- timal speckle quality of the recordings. The customized software program EchoPAC, GE, which can automati- cally track the arbitrarily designated initial points frame by frame, with the assumption that the point is to be lo- cated at the closest region in the next frame, was applied for assessing the LV rotation.
To obtain the data for the degree of rotation with us- ing 2D-STI, the endocardial borders of each short axis view in the end diastolic frames were manually traced, and the regions of interest were centripetally expanded.
After this, the computer software automatically perform- ed speckle tracking and it calculated the degree of ro- tation of each of the six segments and the average value of the degree of rotation, respectively.
The data was discarded when the degree of torsion was not obtained even in one segment or the pattern of tor- sion was erratic. The average values of the angular dis- placement were considered to be the LV rotation of each level, as was done in previous studies. LV torsion was de- fined as the difference between the apical LV rotation and the basal LV rotation, which means that the LV tor- sion was obtained by subtracting the basal LV rotation from the apical LV rotation. To adjust for the intersub- ject differences in the heart rate, the time sequence of a single measured cardiac cycle was normalized to the percentage of (i.e., at the end of diastole, t was 100%), which was named as the percentile time. The velocities of LV rotation and LV torsion were calculated from the differences between the values and the adjacent previ- ous values, which were departed by 5 percentile time, respectively, in the present study.
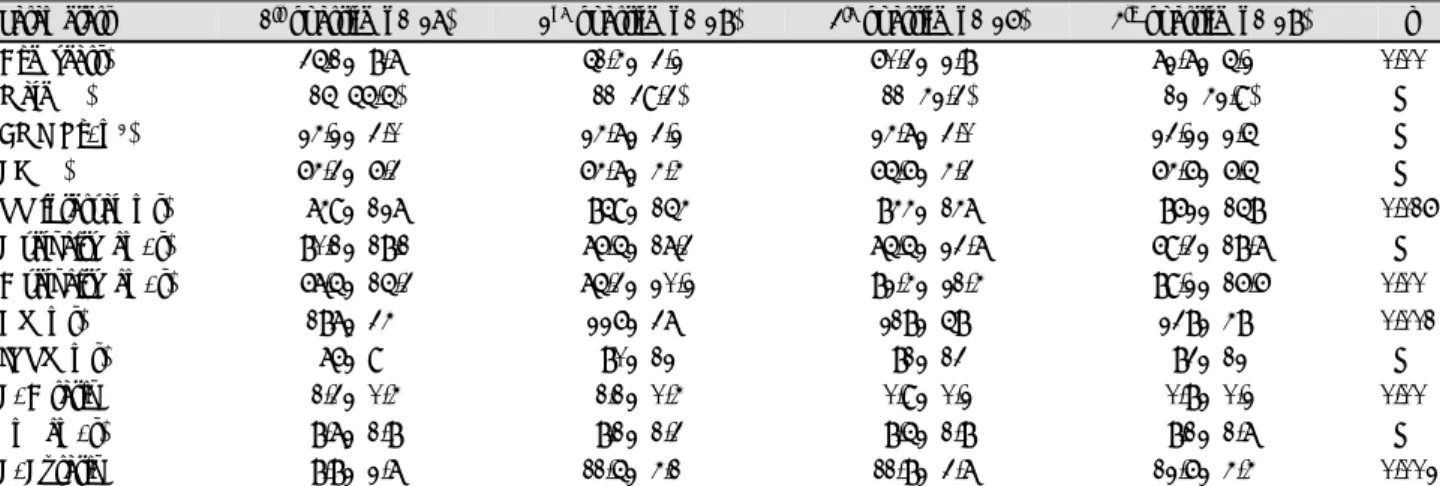
Table 1. Demographic and echocardiographic parameters of the different age groups
Parameters 1st quartile (n=27) 2nd quartile (n=28) 3rd quartile (n=26) 4th quartile (n=28) p
Age (years) 35.1±8.7 51.4±3.2 60.3±2.8 72.7±5.2 0.00
Male (%) 15 (55.5) 11 (39.3) 11 (42.3) 12 (42.9) NS
BMI (Kg/m2) 24.2±3.0 24.7±3.2 24.7±3.0 23.2±2.5 NS
EF (%) 64.3±6.3 64.7±4.4 65.6±4.3 64.6±6.5 NS
RR interval (ms) 749±127 859±154 844±147 862±158 0.016
E velocity (cm/s) 80.1±18.1 76.5±17.3 75.5±23.7 69.3±18.7 NS
A velocity (cm/s) 67.5±15.3 75.3±20.2 82.4±21.4 89.2±16.6 0.00
DT (ms) 187±34 226±37 218±58 238±48 0.001
IVRT (ms) 76±9 80±12 81±13 83±12 NS
E/A ratio 1.3±0.4 1.1±0.4 0.9±0.2 0.8±0.2 0.00
Sm (cm/s) 8.7±1.8 8.1±1.3 8.5±1.8 8.1±1.7 NS
E/E’ ratio 8.8±2.7 11.5±4.1 11.8±3.7 12.6±4.4 0.002
All values of the quartiles were tested by ANOVA, but the frequency of gender was tested with Chi-square tests.ٛBMI: body mass index, EF:
ejection fraction, DT: deceleration time, IVRT: isovolumic relaxation time, Sm: tissue Doppler imaging of the septal mitral annulus, NS:
not significant, RR: R wave to the next R wave in the electrocardiogram, ANOVA: analysis of variance
Statistical analysis
The data is presented as mean values±standard de- viations (SD) unless otherwise stated. The comparison of continuous data among quartiles was performed by analysis of variance (ANOVA) with post hoc analysis, and chi-square tests were used for comparing the cate- gorical data. To reveal the relationship of LV rotation or LV torsion with aging at each corresponding per- centile time, univariate regression analysis was applied Statistical Package for Social Science (SPSS) version 12.
Statistical differences were considered significant at a p<0.05.
Variability of the interobserver measurement was de- termined by having a second observer measure the LV rotation and LV torsion in 10 randomly selected sub- jects. Intraobserver variability was determined by having the observer repeatedly measure the LV rotation and LV torsion in 10 randomly selected subjects. The inter- observer variability and the intraobserver variability were calculated as correlation coefficients and they were expressed as mean values and SD of the differences be- tween the two measurements with using paired t-tests.
Results
The study’s feasibility with using 2-dimensional ultrasound speckle tracking imaging
Among the 182 healthy subjects who had been ini- tially considered as eligible for the present study because of the acceptable conventional echocardiographic image quality, 73 cases were proven to be inappropriate for as- sessing the angular displacement of the LV with using 2D-STI. Thus, 109 healthy subjects (49 males and 60 females) were finally included in this study. The study’s feasibility with using 2D-STI was about 59.8%.
This moderate feasibility was largely the result of the failure to obtain a reliable rotational pattern from the apical short axis view, and partially from failure to ob- tain a reliable rotation pattern from the basal short axis view or both. Especially the lateral segment, among the 6 observed segments, caused difficulties to assess the LV rotation at both planes.
Relationship with the conventional echocardiogra- phic parameters
The pulse-wave Doppler and tissue doppler imaging parameters were grouped into quartiles according to age;
the values for these parameters are presented as means and SDs. With aging, the peak A wave velocity, the dece- leration time (DT), and the E/E’ ratio were lengthened and significantly increased, whereas the E/A ratio was significantly decreased (Table 1).
Even thought the isovolumic relaxation time (IVRT), the peak E wave velocity and the Sm were not signifi- cantly different among the quartiles, all these values
showed a significant relationship with aging by univa- riate regression analysis (r=0.284, p=0.003; r=-0.255, p=0.008 and r=-0.228, p=0.010, respectively).
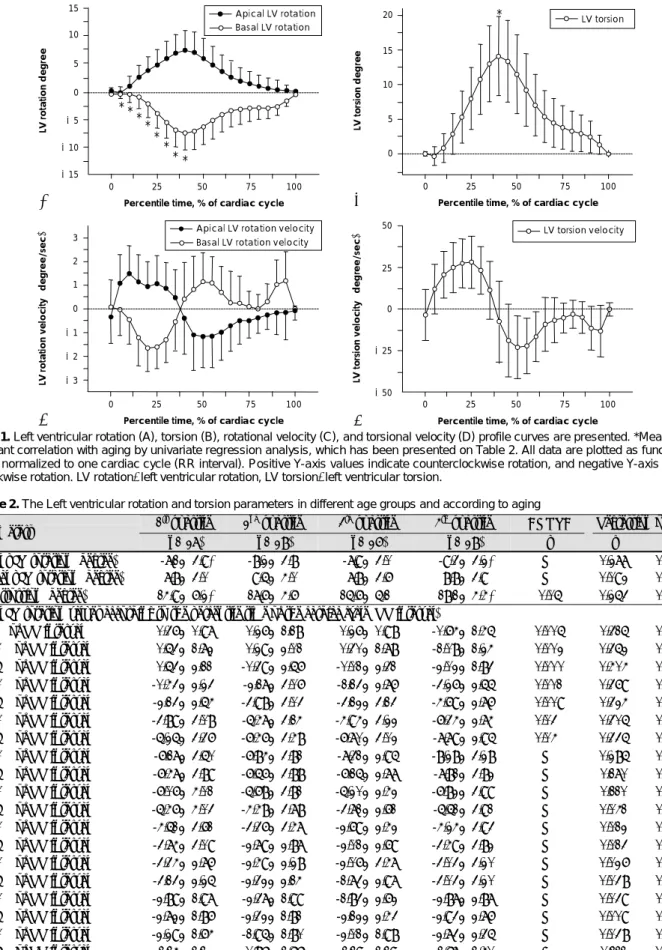
Left ventricular rotation and left ventricular torsion The LV rotation and the velocity of the LV rotation versus the percentile time profiles obtained in the basal and apical planes are shown in Fig. 1. As viewed from the apex, the movement of the spirally arranged myocardial fibers performed a wringing motion with an initial subtle counterclockwise rotation, and this was followed by the main clockwise rotation at the cardiac base, and at the same time, a reversed directional ro- tation at the LV apex. The systolic LV rotation showed the peak angular displacement (the peak LV rotation) at the later part of systole in both the basal and apical planes (the basal peak LV rotation: -8.14±3.55 degrees, and the apical peak LV rotation: 8.48±3.70 degrees).
Thus, the peak LV torsion developed near the end of systole (the peak LV torsion: 16.62±5.26 degrees and 42.35±7.94 percentile time).
During diastole, untwisting movements of the LV were grossly observed as a reversal of the angular dis- placement that occurred during systole. In detail, the changing diastolic pattern of the apical LV rotation sh- owed relatively smooth and gradual restoration to the baseline level, whereas that of the basal LV rotation ex- hibited a complex pattern with rapid partial restora- tion in early diastole, and this was followed by a plateau, and finally late residual restoration to the baseline level (Fig. 1A). These finding are more obvious when the velocity of basal LV rotation is compared to that of the apical LV rotation: the former shows distinctive early and late velocity changes, which intruded on the mid- plateau phase during diastole (Fig. 1C).
LV torsion presents a simple acceleration and dece- leration pattern that’s roughly in accordance with car- diac contraction and relaxation, respectively (Fig. 1B). The peak LV torsion occurred before aortic valve closure and not concurrently with it (aortic valve closing time:
47.71±9.58 percentile time). The velocity of LV tor- sion showed a positive peak value in mid-systole (2.80
±1.64 degree/s), and a negative peak value in early diastole (-2.31±1.97 degree/s)(Fig. 1D).
The effect of aging on the left ventricular rotation and left ventricular torsion
When comparing quartiles of the basal and apical peak LV rotation, respectively, there were no statistically signifi- cant differences. Yet the peak LV torsion showed a sig- nificant difference to increase depending on aging (p=
0.05). On the univariate regression analysis, the basal
peak LV rotation and the peak LV torsion both have a
meaningful tendency to increase with aging (r=0.277,
p= 0.004 and r=0.253, p=0.008, respectively: Table 2,
Table 2. The Left ventricular rotation and torsion parameters in different age groups and according to aging
1st quartile 2nd quartile 3rd quartile 4th quartile ANOVA Regression on age Parameters
(n=27) (n=28) (n=26) (n=28) p r p
Basal pLV rotation (degree) -7.1±3.9* -8.2±3.8 -7.9±3.0 -9.3±3.2* NS 0.277 0.004† Apical pLV rotation (degree) 7.8±3.0 9.5±4.0 7.8±3.6 8.8±3.9 NS 0.092 0.340 pLV trorsion (degree) 14.9±6.2* 17.6±4.6 15.6±5.1 18.1±4.4* 0.05 0.253 0.008† Basal LV rotation values according to the percentile time of the cardiac cycle (RR interval)
5% of RR interval 0.36±0.97 0.26±1.18 0.26±0.98 -0.64±1.45 0.005 0.315 0.001† 10% of RR interval 0.53±1.72 0.29±2.01 0.30±1.78 -1.08±1.24 0.002 0.352 0.000† 15% of RR interval 0.53±2.11 -0.39±2.56 -0.01±2.31 -2.02±1.83 0.000 0.404 0.000† 20% of RR interval -0.43±2.23 -2.17±3.06 -1.13±2.76 -3.26±2.55 0.001 0.369 0.000† 25% of RR interval -2.13±2.54 -3.98±3.03 -3.12±3.13 -4.69±2.76 0.009 0.324 0.001† 30% of RR interval -3.89±3.08 -5.47±3.14 -4.94±3.22 -6.34±2.74 0.03 0.305 0.001† 35% of RR interval -5.25±3.36 -6.46±3.48 -6.70±3.02 -7.79±2.95 0.04 0.335 0.000† 40% of RR interval -6.17±3.50 -6.84±3.81 -7.31±2.95 -8.28±3.28 NS 0.285 0.003† 45% of RR interval -6.47±3.89 -6.56±3.88 -6.15±2.77 -7.81±3.82 NS 0.170 0.076 50% of RR interval -6.06±4.01 -5.68±3.81 -5.20±2.42 -6.82±3.99 NS 0.110 0.257 55% of RR interval -5.46±4.03 -4.48±3.78 -3.71±2.61 -5.51±3.91 NS 0.041 0.668 60% of RR interval -4.51±3.61 -3.36±3.47 -2.69±2.42 -4.24±3.93 NS 0.012 0.897 65% of RR interval -3.74±3.09 -2.79±2.87 -2.01±2.69 -3.49±3.82 NS 0.013 0.895 70% of RR interval -3.34±2.76 -2.49±2.28 -2.06±3.47 -3.03±3.20 NS 0.026 0.780 75% of RR interval -3.13±2.25 -2.32±2.14 -1.73±2.97 -3.03±3.20 NS 0.038 0.693 80% of RR interval -2.89±1.97 -2.37±1.99 -1.83±2.62 -2.87±2.87 NS 0.039 0.687 85% of RR interval -2.72±1.86 -2.32±1.81 -2.12±2.43 -2.93±2.76 NS 0.009 0.925 90% of RR interval -2.29±1.64 -1.95±1.80 -2.01±1.98 -2.73±2.35 NS 0.038 0.696 95% of RR interval -1.14±1.12 -0.86±1.56 -1.19±1.19 -1.67±1.40 NS 0.111 0.253 100% of RR interval -0.06±0.33 -0.03±0.20 -0.02±0.05 -0.04±0.24 NS 0.001 0.991
*Means a significant difference on post-Hoc analysis after ANOVA testing, †Means a significant difference on univariate regression analysis for age. ANOVA: analysis of variance, NS: not significant, pLV rotation: peak left ventricular rotation, pLV torsion: peak left ventricular torsion Fig. 1. Left ventricular rotation (A), torsion (B), rotational velocity (C), and torsional velocity (D) profile curves are presented. *Means sig- nificant correlation with aging by univariate regression analysis, which has been presented on Table 2. All data are plotted as function of time normalized to one cardiac cycle (RR interval). Positive Y-axis values indicate counterclockwise rotation, and negative Y-axis values clockwise rotation. LV rotation: left ventricular rotation, LV torsion: left ventricular torsion.
Apical LV rotation Basal LV rotation 15
10 5 0 -5 -10 -15
LV rotation degree
0 25 50 75 100 Percentile time, % of cardiac cycle
Apical LV rotation velocity Basal LV rotation velocity 3
2 1 0 -1 -2
LV rotation velocity (degree/sec) -3
0 25 50 75 100 Percentile time, % of cardiac cycle
LV torsion 20
15 10 5 0
LV torsion degree
0 25 50 75 100 Percentile time, % of cardiac cycle
A B
C
LV torsion velocity 50
25
0
-25
-50
LV torsion velocity (degree/sec)
0 25 50 75 100 Percentile time, % of cardiac cycle
D
* * * *
* *
* *
*
upper panel, Fig. 2). Furthermore, all the values of the basal LV rotation during systole, which were measured before reaching the peak LV rotation, displayed a mean- ingful tendency of increase with aging, and they also exhibited differences in the mean values among the quartiles, with the differences minimal in the younger quartile and maximal in the elder quartile (Table 2, lower panel). The values of the basal LV rotation and LV tor- sion, as measured during diastole, were not affected by age. The apical LV rotation had no relationship with ag- ing throughout the entire cardiac cycle. The initial sub- tle counterclockwise rotation seen at the base was pre- dominantly noted in the younger quartile, and not in the elder quartile in the present study.
Measurement variability
The interobserver variability was r=0.99 for the api- cal and basal LV rotation (standard error of estimation:
0.19 and 0.17, respectively) and r=0.98 for the LV tor- sion (standard error of estimation: 0.20). The intra- observer variability was r=0.99 for the apical and basal LV rotation (standard error of estimation: 0.18 and 0.21, respectively) and r=0.98 for the LV torsion (standard error of estimation: 0.29).
Discussion
Controversy exists about to what extent the changes and adaptations of the cardiovascular system are a part of the natural aging process, and about the consequ- ences of disease on the cardiovascular system. However, aging is certainly associated with several changes and adaptations in the cardiovascular system: the vascular and ventricular wall thickness has a tendency to incre- ase, whereas arterial compliance, endothelial function and ventricular contractility all have a tendency to de- cline.
2)6)7)To some extent, these changes are also related to increased cardiovascular morbidity and mortality.
2)7)Furthermore, many of these age-related structural and functional changes of the heart can be reflected by changes of the echocardiographic parameters.
6)In the
present study, the values of the parameters of pulse- wave Doppler and tissue Doppler imaging were in agree- ments with the results of other previous studies that focused on the age-related changes of the heart.
Mechanisms of increased left ventricular torsion with aging during systole
The wringing or twisting motion of the heart as the apex rotates with respect to the base along the LV long axis can be viewed as the systolic LV component of LV torsion. The wringing or twisting motion of the heart is known to minimize the transmural gradients of myo- cardial fiber strain and oxygen demand.
8)The fibers across the LV wall have variable orientations: the sub- epicardial fibers are arranged in a left-handed helix pat- tern, the fibers of the midwall are circumferentially ori- ented and the subendocardial fibers are arranged with the right-handed helix pattern. Despite being partially counteracted by the subendocardial fibers, the subepi- cardial fibers mainly generate the LV torsion in the nor- mal heart. The LV systolic function is generally known to be well preserved with aging, although the LV dia- stolic function is altered.
In the present study, the systolic LV torsion had a ten- dency to increase with aging and this is in agreement with the previous tagged MRI studies
9-11)and a previous 2D-STI study.
12)These findings were mainly attributed to the increased basal LV rotation with aging, whereas the apical LV ro- tation had no correlation with aging. Similar findings were reported by Kim et al.,
13)even though there was no significant age-related change of LV torsion in their study. The augmented LV rotation and LV torsion with aging is related with subendocardial underperfusion, which results from an increased LV end diastolic pres- sure or subendocardial fibrosis, and this in turn dimi- nishes the counteractive motion of the subendocardial fibers against that of the subepicardial fibers. Addition- ally, the Sm is observed to decrease with aging. There- fore, it is possible that attenuation of the longitudi- nally-directed strain, which is represented as a decrease
r=0.253 p=0.008
Peak LV torsion degree
30 25 20 15 10 5 0
0 20 40 60 80 Age (years)
C
Basal peak LV rotation degree 0
-5 -10 -15
-20
0 20 40 60 80 Age (years)
A
r=0.277 p=0.004
Apical peak LV rotation degree
20 15 10 50
0
0 20 40 60 80 Age (years)
B
r=0.092 p=0.340
Fig. 2. Correlations between age and basal peak LV rotation (A), apical peak LV rotation (B) and peak LV torsion (C) are presented. The basal peak LV rotation and peak LV torsion have a meaningful tendency to increase with aging (r=0.277, p=0.004 and r=0.253, p=0.008, respectively). The apcial peak LV rotation has no relationship with aging (r=0.092, p=0.340). LV rotation: left ventricular ro- tation, LV torsion: left ventricular torsion.
of the Sm, relieves the resistance and facilitates the motion of the spirally arranged fibers, resulting in aug- mentation of the LV rotation and LV torsion.
Characteristics of the left ventricular rotation and left ventricular torsion during diastole
The diastolic component of LV torsion, which is the untwisting and reversely directed motion of the heart when compared with systole, occurred predominantly during the early diastolic phase in the study of Takeu- chi et al.
12)In the present study, the diastolic basal LV rotation and LV torsion have concordant aspects with the abovementioned previous study, whereas the dia- stolic apical LV rotation occurred with a more dispensed pattern. The reason for this could be that the inter- action of the diastolic LV movement with the mitral inflow is more intimately conjugated with the basal level rather than with the apical level because of the shorter anatomical distance. The velocity of the basal LV rotation resembled the mitral inflow pattern, in- cluding the mid-diastolic plateau period.
Although controversy exists regarding the decrease of the diastolic LV torsion or the untwisting that oc- curs with aging,
10)14)it seems quite likely that there is reduced diastolic LV torsion in the early rapid filling phase. But in our present study, there was no signifi- cant relationship between the diastolic LV torsion and aging, whereas the IVRT, DT and E/E’ ratio increased concurrently with the decreases of the peak E wave velo- city. This could be due to observational error that was related to the relatively small number of younger sub- jects, or to the complex features of the myocardial re- laxation process. Recent human catheterization studies
15)16)have failed to detect an age-related decline in the rate of the LV pressure fall (t) and these studies have suggested that other factors may contribute to the altered mitral inflow pattern that was detected by Doppler-based study in the elderly. Additionally, the subtle changes in the hemodynamic conditions, such as the left atrial pressure or the atrio-ventricular pressure gradient, are known to produce remarkable changes in the E wave velocity, IVRT and DT, but not in the t. Therefore, the LV rotation and LV torsion may be more relevant for reflecting t than are the Doppler-based parameters. Be- side these hemodynamic considerations, 2D-STI is still not sensitive to the multi-layers of the myocardium wh- erein each layer has a different direction of movement.
2D-STI may not separately recognize these layers and so this hinders presenting the subtle changes of the LV rotation and LV torsion with aging.
Relation between the left ventricular torsion and the minimal radial left ventricular diameter
The IVRT, which is defined as the duration from aor- tic valve closure to mitral valve opening, is associated
with the reverse LV rotation and untwisting LV torsion.
Interestingly, the minimal radial diameter of the LV was constantly observed around the aortic valve clos- ing time or even within the very early part of the IVRT (46.84±7.34 percentile time), and not at the point of the peak LV torsion. This finding suggests that a com- pensatory elongation of some regions of the heart sh- ould occur to allow shortening of the radial diameter in the closed chamber after reaching the peak LV tor- sion or during IVRT. In other words, some portion of the myocardium should keep contracting while most of the myocardium is already relaxing or untwisting after the peak LV torsion. This kind of heterogeneity in the myocardial contraction pattern was already sug- gested by a previous tagged MRI study.
11)Therefore, this finding supports that the lateral ascending seg- ment of the LV myocardium,
17)which is activated last in the sequence of LV contraction, may be responsible for this minimal radial diameter.
Study limitations
The limitations of the present study are similar to a few of the previous studies. There is still no gold stand- ard for measuring the LV rotation and LV torsion, even with the use of tagged MRI study. As a practical insight, the exact locations of the basal and apical planes vary from person to person so that inter-person comparison inevitably presents wide variance of the measured values. Furthermore, the basal and apical planes can not be obtained simultaneously, which may cause intrinsic error when calculating the LV torsion.
In conclusion, 2D-STI can be used to noninvasively quantify the LV rotation and LV torsion with moderate feasibility. The measurements are simple and reprodu- cible if the exact views of the basal and apical planes are acquired. LV torsion is significantly enhanced with aging and this is mainly due to the increased basal LV rotation. The minimal radial diameter, which is ob- served around the aortic valve closing time, may be as- sociated with delayed contraction of the lateral ascend- ing segment of the LV myocardium. There is a need to determine the relationship between the above findings and the diastolic dysfunction. Therefore this novel me- thod (2D-STI) will be helpful to allow detailed study of the systolic and diastolic functions in various car- diac diseases.
REFERENCES
1) Helle-Valle T, Crosby J, Edvardsen T, et al. New noninvasive method for assessment of left ventricular rotation: speckle track- ing echocardiography. Circulation 2005;112:3149-56.
2) Lakatta EG, Levy D. Arterial and cardiac aging: major share- holders in cardiovascular disease enterprises: part II. the aging heart in health: links to heart disease. Circulation 2003;107:
346-54.
3) Nagueh SF, Middleton KJ, Kopelen HA, Zoghbi W, Quinones
MA. Doppler tissue imaging: a noninvasive technique for evalu- ation of left ventricular relaxation and estimation of filling pres- sures. J Am Coll Cardiol 1997;30:1527-33.
4) Ommen SR, Nishimura RA, Appleton CP, et al. Clinical utility of Doppler echocardiography and tissue Doppler imaging in the estimation of left ventricular filling pressures: a comparative si- multaneous Doppler-catheterization study. Circulation 2000;102:
1788-94.
5) Quinones MA, Otto CM, Stoddard M, Waggoner A, Zoghbi WA.
Recommendations for quantification of Doppler echocardiogra- phy: a report from the Doppler Quantification Task Force of the Nomenclature and Standards Committee of the American Society of Echocardiography. J Am Soc Echocardiogr 2002;15:167-84.
6) Lakatta EG, Levy D. Arterial and cardiac aging: major share- holders in cardiovascular disease enterprises: part I. aging arteries:
a “set up” for vascular disease. Circulation 2003;107:139-46.
7) Arbab-Zadeh A, Dijik E, Prasad A, et al. Effect of aging and phy- sical activity on left ventricular compliance. Circulation 2004;
110:1799-805.
8) Taber LA, Yang M, Podzsus WW. Mechanics of ventricular tor- sion. J Biomech 1996;29:745-52.
9) Matter C, Nagel E, Stuber M, Boesiger P, Hess OM. Assessment of systolic and diastolic LV function by MR myocardial tagging.
Basic Res Cardiol 1996;91:23-8.
10) Oxenham HC, Young AA, Cowan BR, et al. Age-related changes in myocardial relaxation using three-dimensional tagged magnetic
resonance imaging. J Cardiovasc Magn Reson 2003;5:421-30.
11) Fonseca CG, Oxenham HC, Cowan BR, Occleshaw CJ, Young AA. Aging alters patterns of regional nonuniformity in LV strain relaxation: a 3-D MR tissue tagging study. Am J Physiol Heart Circ Physiol 2003;285:H621-30.
12) Takeuchi M, Nakai H, Kokumai M, Nishikage T, Otani S, Lang RM. Age-related changes in left ventricular twist assessed by two-dimensional speckle-tracking imaging. J Am Soc Echocar- diogr 2006;19:1077-84.
13) Kim HK, Sohn DW, Lee SE, et al. Assessment of left ventricular rotation and torsion with two-dimensional speckle tracking echo- cardiography. J Am Soc Echocardiogr 2007;20:45-53.
14) Hees PS, Fleg JL, Dong SJ, Shapiro EP. MRI and echocardio- graphic assessment of the diastolic dysfunction of normal aging:
altered LV pressure decline or load? Am J Physiol Heart Circ Phy- siol 2004;286:782-8.
15) Yamakado T, Takagi E, Okubo S, et al. Effects of aging on left ventricular relaxation in humans: analysis of left ventricular iso- volumic pressure decay. Circulation 1997;95:917-23.
16) Hoit BD, LeWinter M, Lew WY. Independent influence of left atrial pressure on regional peak lengthening rates. Am J Physiol 1990;259:H480-7.
17) Ballester-Rodes M, Flotats A, Torrent-Guasp F, et al. The sequ- ence of regional ventricular motion. Eur J Cardiothorac Surg 2006;29(Suppl 1):S139-44.