大훌훌放射線醫學륨훌훌 Vol. XlX. No. 4
,
1983한국 정상 성인의 복부장기의 조영제 투여전과 조영제 투여후의 CT ATTENUATION VALUES
고려의대 방사선과학 교실
전 혜 정·차 인 호·서 원 혁 - Abstract -
Computed Tomography Attenuation Values of Nonnal Upper Abdominal Organs in Korean before and
After Contrast Enhancement
Hae Jeong Jeon. M.D.
,
In Ho Cha,
M.D.,
WonHyuck Suh,
M.D.Department of Radi%gy
,
Co//ege of Medicine Korea University,
Seou/,
KoreaComputed Tomography (CT) is a highly accurate method of detecting and cJarifying the nature of space-occupying lesions within the liver and pancreatic disease.
It was found to be a reliable
,
non invasive method for detecting the lesion.A normal range of attenuation values were obtained from 71 CT examinations of the upper abdomen
,
that is liver
,
spleen,
pancreas,
aorta,
before and after contrast enhancement in whom no radiologic or laboratory abnormality of these organs were detected from March to September,
1983.The results were as follows;
1. the age distribution was from 28 years to 71 years. The sex ratio was 45 male to 26 female.
2. Mean Hounsfield Units (HU) in liver before contrast enhancement and after contrast enhancement Iiminute
,
3 minutes,
5 minutes,
10 minutes were 56.1t3.85,
75.0:1:4.77,
82.0:1:3.71,
84.3:1:2.76 and 88.2:!:3.95 HU respectively.3. Mean Hounsfield Units in pancreas before contrast enhancement and after contrast enhancement 1 minute
,
3 tninutes,
5 minutes,
10 minutes were 43.0:1:4.30,
66.5:t4.27,
71.2:t2.39,
74.4:t3.00 and 79.2:t 2.90 HU respectively.4. Mean Hounsfield Units in spleen before contrast enhancement and after contrast enhancement 1 minute
,
3 minutes,
5 minutes 10 minutes were 53.0:t4.31,
71.4:t2.84,
75.3:t2.70,
80.5:t3.04 and 83.2:t2.14 HU respectively.5. Mean Housfield Units in aorta before contrast enhancement and after contrast enhancement 1 minute
,
3 minutes
,
5 minutes 10 minutes were 45.1:t5.39,
86.7:t6.86,
92.5:t5.33,
106.8:t4.12 and 114.1:t5.02 H U respectively.6. The most significant finding was that the liver normaJly had the highest attenuation values of any of the organs measured.
When another viscera in upper abdomen had a attenuation value greater than that of the liver
,
this reflected abnormallesions.이 논문은 R:l년 12윌 9일에 채택되었음
n ι
%
1.
서 론CT(Cornputed Tαnography) 의 진단적 가치는 CT HU (Houns field 나Jits) 의 차이에 따라 달리 그려지는 영상을 얻는 데 있다. 그 att enuation -coe fficient s 는 곰 기를 -1000
,
물을 0,
뼈를+
1000으호 하고 각 장71 별로 그 밀도 차이에 따라 CT HU 가 다르기 때문에 가 능하다.저자는 복부 전산화 단층 촬영상에서 조영제 투여 전 과 조영제 투여 후에 시간에 따른 정상 복부장기의 HU 를 측정하여 평균치와 정상 범위를 얻었기에 이에 문헌 고찰과 함께 보고하는 바이 다
II.
대상 및 방법1983 년 3 월 2 일부터 1983 년 9 월 30 일 까지 7 개 윌 동안 고려대학교 부속 병원에서 복부전산화단층촬영 상 정상으로 판명된 71 례에서 시행했다.
HU측정은 간, 웨장, 비 장, 대동액에서 시행했고 일 정하게 네 장기가 동시에 디 보이는 level 에서 간은 오 른쪽 옆 뒷쪽 실칠에서 혈관이 지 나는 장소는 되도록 피 해서 측정했고 대통맥은 중앙 부분을, 비장은 왼쪽 뒷 쪽 설절에서, 퀘장은 봄체 부분을 측정했다 그래서 조 영제 투여 전과 60 % iothalamate meglumine 을 말초 정맥으후 2.5 ~ 3 cc/kg 씩 주엽하되 1/2 은 rapid bo.
lus injection하고 나머지 1/2 은 f UJ 1 dripping 을 했 으며 post enhancement 측정 은 b이us injection 분 3 분 5 분 10 분 간격으로 측정했다. C T scanrier 는
Table 1. Age and Sex Distribution Sex
Age Male Female Total (%)
20-29 3 2 5 (7)
30-39 7 2 9 (13)
40-49 8 11 19 (27)
50-59 15 7 22 (31)
60-69 8 4 12 (17)
70-79 3 0 3 (5)
Total (%) 45 (64) 26 (36) 71 (100)
(P>0.05)
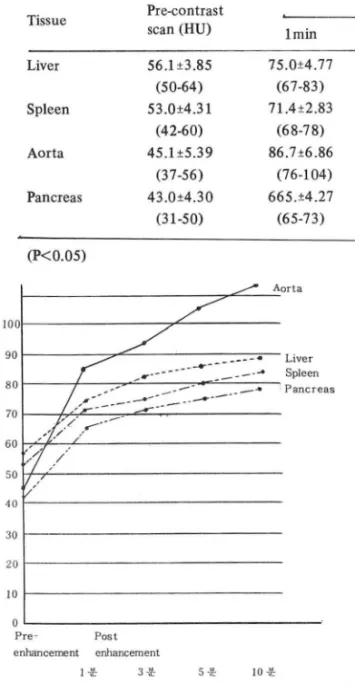
조영제 투여 후 I분에서 측정한 HU 는간의 경우 67 -83 이었고 mean 은 75 .0~4. 77, 비장은 68~78 이며 mean 은 7J.4 ~2.83 이었다. 대동맥은 76-104, mean 은 86.7 :!:6.86, 춰1 장은 65~73 mean은 66.5:!:4.27 이었다.
조영제 투여 후 3 분에서 측정한 HU는 간의 경우 75 -93 mean 82.0:!:3.71
,
비 장은 71-80 mean 15.3 :!:2.70, 대동맥은 80-101 mean 92.5 :!:5.33, 취l 장 은 67~76 mean 11.2 :!:2.39 이었다.조영제 투여 후 5 분에서 측정한 HU 는 간의 경우 81
~90 mean 은 84.3 :!: 2.16 이었고, 비 장은 14.ι-、、얘- a뻐n 은 80ι.5:!:3.0여4, 대동맥은 100-118 mean 은 106.8 :!:4.12 , 춰1 장은 69~82 mean 은 74.4 :!:3.00 이었다
초영제 투여 후 10 분에서 측정한 HU는 간의 경우 79~99 mean 88.2:!: 3.95, 비장은 80~87 mean은 83.2 :!:2.14, 대동맥은 101~120 mean 1J4.1:!:5.02 퀘장은 74~86 mean은 79.2 :!: 2.90 이었다 (Table 2, Siemens Scmatom 1I를 이용했으며 scan time은 5 초 Fig.l).
이었다.
ill. 성 ^~
...,
성별 분포는 남자가 64 %, 여자가 36 %였으며 연령 별 분포는 28세에서 75 세에 결쳐 분포하고 있었다 πa.
ble 1) • 한국 성인에 있어서 조영제 투여 전의 정상 간 의 CT HU 는 50 - 64 았고 mean value 는 56. 1:!:3. 85 였다. 정상 비장의 조영세 투여 전의 CT HU 는 42~
60 이었고 mean value 는 53.0 :!:4.31였다. 정상 웨장 의조영제 투여 전의 CT HU는 31~50 이었고 mean
value 는 43.0:!: 4.30 이었디 정싱 대동맥의 CT HU 는 37-56 이었고 mean value는 45.1 :!:5.39 이었다-
IV .
고 찰CT 는 1969 년 G . N. Hounsfield빅사기 고안한 이 례로 짧은 역사 속에서도 많은 발전을 거듭해 왔는데
CT의 HU 와 time-enhancement data 로서 정상 조직 과 비 정상 조직을 쉽게 구별할 수가 있다.
Darid H. Steph안IS1) 등은 정 상 간 실진의 HU는 상 복부의 비장 쉐장 콩팔등 다른 장기보다도 보통 더 높 으며 정 상 간 실 칠사이 의 a tt enuation values 의 range는
20~40 EMI units 정도라 했다 또 John R. Haaga2l 는 조영제 투여 전의 정상 취l장의 HU는 30~45 정도이 고 100 cc 의 Renografin을정맥 주엽 후에는 60 ~85
때
Table 2. Enhancement of human tissues after intravenous contrast media (M:t S.D.)
Pre-contrast Post Contrast enhancement (HU)
Tissue
scan (HU) lmin 3min 5 min 10 min
Liver 56.l:t3.85 75.0:t4.77 82.0:t3.71 84.3:t2.76 88.2:t3.95
(50-64) (67-83) (75-93) (81-90 (79-99)
Spleen 53.0:t4.31 71.4:t2.83 753.:t2.70 80.5:t3.04 83.2:t2.14
(42-60) (68-78) (71-80) (74-87) (80-87)
Aorta 45.1:t5.39 86.7:t6.86 92.5:t5.33 106.8:t4.12 114.1:t5.02
(37-56) (76-104) (80-107) 000-118) (101-120)
Pancreas 43.0:t4.30 665.:t4.27 71.2:t2.39 74.4:t3.00 79.2:t2.90
(31-50) (65-73) (67-76) (67.82) (74-86)
(P<0.05)
ζ르 Aorta
즈ι ζ=
「/
If--*::::::
//;.---:::=: --- ---_ ..
§繼,..--'
100
90 Liver
Spleen Pancreas
80
v ν 40
30 20 10
O
Pre Post
enhancement enhancement
l 훈 3 운 5 운 10운
Fig. 1. Time-Density curves in Aorta Liver Spleen Pancreas.
정도라고 측정했다. Robert J. Sta미ey3 , 4 ,5)등헤 의하 면 정 상에서 간이 춰l 장이나 콩팔 비 장보다는 약간 높은 density를 지니며 조영제 투여 전의 정상 간 실질의 HU
는 40-80 이었고 조영제 투여 후에는 dose-re 떠 ted fa- shion으로 1.20-140 HU까지 올라간다고 했다. 정상 간 은 담즙관을 제 외 하곤 hcmogenous absorpt ion att enu-
ation value를 지니냐 간암이나 전이 종양은 간 실질에 서 국소적 으로 dec reased densit y 나 loccJized bulging
low density mass 로 나타난다 6,7,8,9) 이 외에도 양 성 간 낭종, 농양, 만성 혈종 또는 명ycogen. fat,iron
등의 침 착시에도 HU를 간단히 진단할 수 있다 10 , 11 , 12 , 13 ,14)
Charles B. Mulhern l5,16,17) 등은 비 장의 attenuation value 는 측정 결과 간의 HU보다 항상 낮은 것이 정 상 인데 예를 들어서 간의 HU 가 15 이고 비장의 HU 가 25 라면 이 환자는 지방간 임을 판단할 수가 있다 Da ird A oppenheimer l8 ) 등은 간에서 조영서1 투여 후 1분 3 분 5 분 10 분에서 측정한 HU는 각각 2ti.8
:t
3.ti 19.9:t
2.5, 15.3:t
1.7, 10.2:t
1.5 이었고 비 정에서 는 31.4:t
3.7, 23.0:t
3.0, 16.6:t
3.0, 3.2:t
2.3 으 로 저자가 측정한 HU보다 모두 낮았는데 이들이 사용 한 CT 기기는 GE CTIT 8800 으로 scan tirne 3 초였 다.Victor C. Mategrano l9,20) 등은 초영제 투여 전의 간 비장, 춰1 장 대동맥의 HU를 각각 30 , 23 , 20 , 21로 측정 했는데 이 들은 Data General Eclipse S -200 C<mJlJ-
ter 를 이 용했다. 반연 William W. Scott 등이 Pfizer A. S.& E. Model 500 scanner플 이용해서 측정한조영 제 투여 전의 간의 HU 는 25 이고 조영제 투여 후에는
55 이었다 잉, 22) •
이와같이 저자가 측정한 각 장기의 HU 가 다른 저자 들의 것과 차이가 나는 것은 CT 기기의 종류 scan ti- me 조영제 투여 방법등이 다르기 때문인 것으로 사료 된다.
아직 까지 .contrast e마ancement CT를 촬영 시 조영
제의 주엽속도 주업경로 조영제의 농도에 대한 갓등 조 영제의 사용법이 완전히 정 련된 것이 없다 cont rast
enhancement 를 하연 혈 관과 같은 정 상 low density와 종양의 구별 이 가능하고 plain scan 상에 서 보이 지 않는 lesion 을 detect 할 수 있고 cys tic lesion 과 solid le- slon 의 구별。 l 가능하다 또한 conventional cOl1trast CT 보다 Dy며nic CT플 하면 종양의 vascularity 플 정 M
끼
’
와Ò'I 핑기한 수 있고 종양괴 정상 죠직 사이의 경계를 멍펙히 말 수 있으며 작은 종잉도 쉽게 발견할 수 있고 종양의 침윤정도를 쉽게 알 수 있기 때문에 진단에 더 욱유용하다
V. 결 론
저자는 1983년 3월부터 1983 년 9월까지 고려대학 교 부속병원에서 Somatom II CT 기기를 이 용한 복부 전 산화단층촬영 상 정 상으로 판명 된 71 례에서 조영제 투 여 후의 l 분 3 분 5 분 10분에서 복부 장기의 CT
HU를 측정하여 다음과 같은 결론을 얻었다.
1 . 측정한 복부 장기 중 간의 HU가 56.1 :!::3.85로 가장 높았고 그 다음 비 장 53.0 :!::4.31
,
대동맥 45.1 :!::5.39,
춰1장 43.0 :!::4.30 이었다2.
조영제 투여 후I
분에서 측정한 HU는 간의 경 우 67-83 이 었고 mean 은 75.0:!:: 4. 77,
비장은 67-78 이며 mean은 71.4 :!:: 2.83 이었다 대동맥은 76- 104 mean 은 8ti.7 :!:: 6. 8ö
,
훼 장은 65-73 mean 은 6ti.5 :!::4.27 이었다3. 조영제 투여 후 3분에서 측정한 HU는 간의 경 우 75-93 mean은 82.0 :!::3.
7I ,
비장은 71-80 me.an은 75.3 :!:: 2 .70
,
대동맥은 80-107 mean은 92.5 :!::5.33,
웨장은 67-76 mean 71.2 :!::2.39 이었다.4. 조영제 투여 후 5분에서 측정한 HU는 간의 경 우 81-90 mean은 84.3 :!:: 2.76 이었고, 비 장은 74-
87 mean은 80.5 :!::3 .04
,
대동맥은 100-118 mean 106.8 :!:: 4.12,
춰l장은 69-82 mean은 74.4 :!::3.UO 이 었다.5 . 조영제 투여 후 10분에서 측정한 HU는 간의 경 우 79-99 mean은 88.2 :!::3.95
,
비 장은 80- 87 me-an은 83.2 :!::2.14
,
대동맥은 101- 120 mean은 114.1 :!::5 .02,
취!장은 74-86 mean은 79.2:!:: 2.90 이 었다.REFERENCES
1. David H. Stephens
,
Patrick F. Sheedy,
Robert R.Hattery
,
et al: Computed Tomography of the Liver.Aj R 728: 5 79-59α ApriI7977.
2. john R. Haaga
,
Ralph j. Alfidl,
Margaret G. Zelch,
et al: Ccmputed Tomography of the Pancreas.
Radiology 720:’589-595
,
Sep. 7976.3. Robert j. Stanley
,
Stuart S. Sagel,
Robert GI Levitt:Computed Tomography of the 8ody. AjR 727:
53-6 끼 7976.
4. Adilson Prando
,
Sidney Wallace,
Michael E. Ber- nardino,
et al: Computed Tomographic Arterio- graphy of the Liver. Radiology 730:697-707,
March7979.
5. Daniel R. Biello
,
Robert G. Levitt,
Barry A. Siegel,
et al: Computed Tomography and Radionuclide Imaging of the Liver. Radiology 727: 759-763
,
Apri17978.
6. Albert A. Moss
,
john Schrumpt,
Pierre Schnyder,
et al: Computed Tomography of Focal Hepatic Lesions; A 81ind Clinical Evaluation of the Effect of Contrast Enhancement. Radiology 737:427- 430
,
May 7979.7. Tsutomu Araki
,
Yuji Itai,
Shigeru Furui,
et al:Dynamic CT Densitometry of Hepatic Tumors.
AjR 735:7037-7043
,
Nov. 7980.8. Francis Kunstlinger
,
Michael P. Federle,
Alber A.Moss
,
et al: Computed Tomography of Hepato- cellular Carcinoma. Aj R 734:437 -4 3ζ March 7980.9. Yuji Itai
,
junichi Nish~kawa, Akira Tasaka: Com- puted Tomography in the Evaluation of Hepato- cellular Carcinoma. Radiology 737: 765-770,
April7979.
10. Patricia A. Barnes
,
john L. Thomas,
Michael E.Bernardiono: Pitfalls in the Diagnosis of Hepatic Cysts by computed Tomography. Radiology 747:
729-733
,
October,
7987.11. Paul H. Barnet
,
Elias A. Zerhouni,
Robert L. White:Computed Tomography in the Diagnosis of Caver nous Hemangioma of the Liver. Aj R 734:439-44ζ March 7980.
12. Shimpei Tada
,
Kunihiko Fukuda,
Yutaka Aoyagi,
et al: CT of the A bdominal Malignancies. Aj R 735:455-467
,
Sep.7980.13. Wayne B. Wooten
,
Michael E. Bernardino,
Heavey M. Goldstein: Computed Tomography of Necrotic Hepatic Metastases. AjR 737:839-842,
November 7978.14. Charles B. Mulhern
,
Peter H. Arger,
Beverly G.Coleman
,
et al: Nonuniform Attenuation in Com- puted Tomography Study of the Cirrhotic Liver.Radiology 732:399-402
,
August 7979.15. Guy H. Marchal
,
Albert L. Baert,
Guy E. Wilms:CT of Noncystic Liver Lesions. AjR 735:57-65
,
july 7980.
c u c U
7 l
16. M.R. Violante
,
K. Mare,
H.W. Fischer: 8iodistribu- Contrast Agent for Computed Tomography of tion of a Particulate Hepatolienographic CT Con- the Liver and Spleen. Radiology 121 :491,
November trast Agent. Invest. Rad.: jan.-Feb. 1981. 1976.17. Victor C. Mategrano
,
jerry Petasnick,
john Clark: 20. William W. Scott,
Roger C. Sanders: Irregular Fatty Attenuation Values in Computed Tomography of Infiltration of the Liver. AjR 135:67-71,
july 1980.the Abdomen. Radiology 125:135-140
,
October 21. jean-Claude Ducommun,
Henry 1. Goldberg,
Melvyn1977. Korobkin: The Relation. of Liver Fat to Computed
18. David A. Oppenheimer
,
Stuart W. Young: Dia- Tomography Numbers. Radiology 130:511-513,
trizoate CT Distribution Kinetics. journal of Com- Feb. 1979.
puter Assisted Tomography 7(2):274-277
,
April 22. Ralph J. Alfidl,
john Haaga,
Thomas F. Meaney,
1983. et al: Computed Tomography of the Thorax and
19. Ralph J. Alfidl