http://dx.doi.org/10.4174/astr.2015.89.4.208 Annals of Surgical Treatment and Research
Risk factors and long-term outcomes of delayed graft function in deceased donor renal transplantation
Chang Ho Seo, Jeong Il Ju, Mi-Hyeong Kim, Kang Woong Jun, Sang-Hyun Ahn1, Jeong Kye Hwang2,
Sang Dong Kim3, Sun Cheol Park4, Bum Soon Choi5, Ji Il Kim, Chul Woo Yang5, Yong Soo Kim5, In Sung Moon
Department of Surgery, Seoul St. Mary’s Hospital, The Catholic University of Korea College of Medicine, Seoul, 1Department of Surgery, Yeouido St. Mary’s Hospital, The Catholic University of Korea College of Medicine, Seoul, 2Department of Surgery, Daejeon St. Mary’s Hospital, The Catholic University of Korea College of Medicine, Daejeon, 3Department of Surgery, Incheon St.
Mary’s Hospital, The Catholic University of Korea College of Medicine, Incheon, 4Department of Surgery, Uijeongbu St. Mary’s Hospital, The Catholic University of Korea College of Medicine, Uijeongbu, 5Department of Internal Medicine, Seoul St. Mary’s Hospital, The Catholic University of Korea College of Medicine, Seoul, Korea
INTRODUCTION
Delayed graft function (DGF), defined as the need for dialysis within the first week posttransplantation, occurs
in approximately 25% of deceased donor (DD) renal trans
plantation cases [13]. DGF is a wellknown complication associated with increased risk of acute rejection (AR) and poor longterm graft survival, but the impact of DGF on Purpose: The purpose of this study was to analyze the risk factors for delayed graft function (DGF) and determine its impact on the outcomes of deceased donor (DD) kidney transplantation (KT).
Methods: Between January 2000 and December 2011, we performed 195 DD renal transplants. After the exclusion of primary nonfunctional grafts (n = 4), the study recipients were divided into two groups—group I, DGF (n = 31, 16.2%); group II, non-DGF (n = 160, 83.8%). The following variables were compared: donor and recipient characteristics, patient and graft survival, postoperative renal function, acute rejection (AR) episodes, and the rates of surgical and infectious complications.
Results: Donor-related variables that showed significant differences included hypertension (P = 0.042), diabetes (P = 0.025), and prerecovery serum creatinine levels (P < 0.001). However, there were no significant differences in recipient- related factors. One significantly different transplant-related factor was positive panel reactive antibody (PRA > 20%, P = 0.008). On multivariate analysis, only the prerecovery serum creatinine level (P < 0.001; hazard ratio [HR], 1.814) was an independent risk factor for the development of DGF. A Cox multivariate analysis of risk factors for graft survival identified these independent risk factors for graft survival: nephron mass (donor kidney weight to recipient body weight ratio) index (P = 0.026; HR, 2.328), CMV infection (P = 0.038; HR, 0.114), and AR episode (P = 0.038; HR, 0.166).
Conclusion: In DD KT, an independent risk factor for DGF was the prerecovery serum creatinine level. Although there was a significant difference in graft survival between the DGF and non-DGF groups, DGF was not an independent risk factor for graft failure in this study.
[Ann Surg Treat Res 2015;89(4):208-214]
Key Words: Delayed graft function, Deceased donor renal transplantation
Reviewed January February March April May June July August September October November December
Received February 10, 2015, Revised April 15, 2015, Accepted May 6, 2015
Corresponding Author: Jeong Kye Hwang
Department of Surgery, Daejeon St. Mary’s Hospital, The Catholic University of Korea College of Medicine, 64 Daeheung-ro, Jung-gu, Daejeon 34943, Korea.
Tel: +82-42-220-9235, Fax: +82-42-220-9565 E-mail: [email protected]
Copyright ⓒ 2015, the Korean Surgical Society
cc Annals of Surgical Treatment and Research is an Open Access Journal. All articles are distributed under the terms of the Creative Commons Attribution Non- Commercial License (http://creativecommons.org/licenses/by-nc/4.0/) which permits unrestricted non-commercial use, distribution, and reproduction in any medium, provided the original work is properly cited.
posttransplant outcomes is not yet entirely clear. Recent studies provide conflicting conclusions regarding the impact of DGF on the outcome of renal transplantation [47]. The purpose of
this study was to analyze risk factors for DGF and determine its impact on the outcomes of DD kidney transplantation (KT).
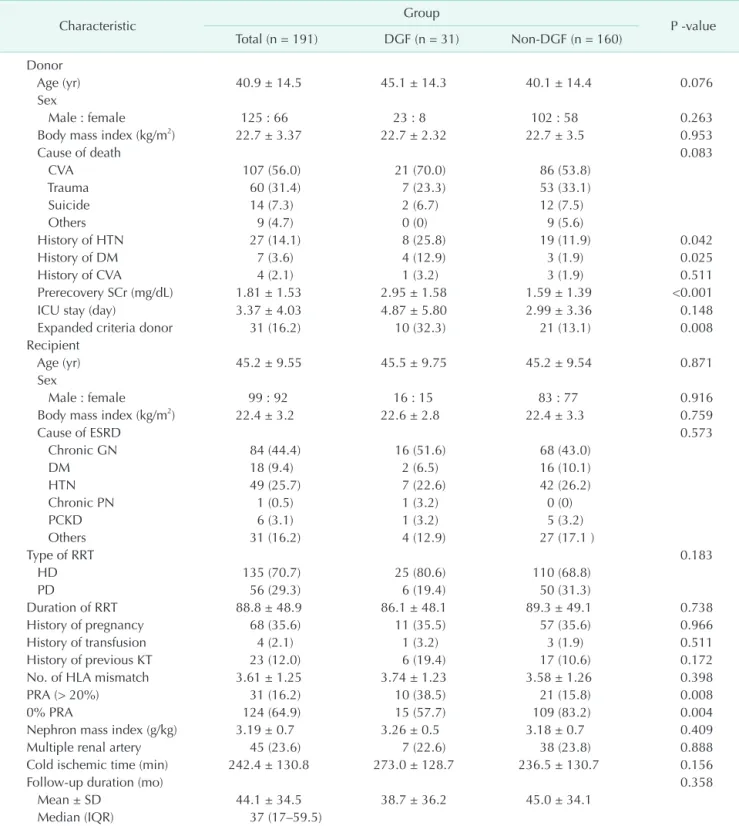
Table 1. Characteristics of study population according to delayed graft function (DGF)
Characteristic Group
P -value Total (n = 191) DGF (n = 31) Non-DGF (n = 160)
Donor
Age (yr) 40.9 ± 14.5 45.1 ± 14.3 40.1 ± 14.4 0.076
Sex
Male : female 125 : 66 23 : 8 102 : 58 0.263
Body mass index (kg/m2) 22.7 ± 3.37 22.7 ± 2.32 22.7 ± 3.5 0.953
Cause of death 0.083
CVA 107 (56.0) 21 (70.0) 86 (53.8)
Trauma 60 (31.4) 7 (23.3) 53 (33.1)
Suicide 14 (7.3) 2 (6.7) 12 (7.5)
Others 9 (4.7) 0 (0) 9 (5.6)
History of HTN 27 (14.1) 8 (25.8) 19 (11.9) 0.042
History of DM 7 (3.6) 4 (12.9) 3 (1.9) 0.025
History of CVA 4 (2.1) 1 (3.2) 3 (1.9) 0.511
Prerecovery SCr (mg/dL) 1.81 ± 1.53 2.95 ± 1.58 1.59 ± 1.39 <0.001
ICU stay (day) 3.37 ± 4.03 4.87 ± 5.80 2.99 ± 3.36 0.148
Expanded criteria donor 31 (16.2) 10 (32.3) 21 (13.1) 0.008
Recipient
Age (yr) 45.2 ± 9.55 45.5 ± 9.75 45.2 ± 9.54 0.871
Sex
Male : female 99 : 92 16 : 15 83 : 77 0.916
Body mass index (kg/m2) 22.4 ± 3.2 22.6 ± 2.8 22.4 ± 3.3 0.759
Cause of ESRD 0.573
Chronic GN 84 (44.4) 16 (51.6) 68 (43.0)
DM 18 (9.4) 2 (6.5) 16 (10.1)
HTN 49 (25.7) 7 (22.6) 42 (26.2)
Chronic PN 1 (0.5) 1 (3.2) 0 (0)
PCKD 6 (3.1) 1 (3.2) 5 (3.2)
Others 31 (16.2) 4 (12.9) 27 (17.1 )
Type of RRT 0.183
HD 135 (70.7) 25 (80.6) 110 (68.8)
PD 56 (29.3) 6 (19.4) 50 (31.3)
Duration of RRT 88.8 ± 48.9 86.1 ± 48.1 89.3 ± 49.1 0.738
History of pregnancy 68 (35.6) 11 (35.5) 57 (35.6) 0.966
History of transfusion 4 (2.1) 1 (3.2) 3 (1.9) 0.511
History of previous KT 23 (12.0) 6 (19.4) 17 (10.6) 0.172
No. of HLA mismatch 3.61 ± 1.25 3.74 ± 1.23 3.58 ± 1.26 0.398
PRA (> 20%) 31 (16.2) 10 (38.5) 21 (15.8) 0.008
0% PRA 124 (64.9) 15 (57.7) 109 (83.2) 0.004
Nephron mass index (g/kg) 3.19 ± 0.7 3.26 ± 0.5 3.18 ± 0.7 0.409
Multiple renal artery 45 (23.6) 7 (22.6) 38 (23.8) 0.888
Cold ischemic time (min) 242.4 ± 130.8 273.0 ± 128.7 236.5 ± 130.7 0.156
Follow-up duration (mo) 0.358
Mean ± SD 44.1 ± 34.5 38.7 ± 36.2 45.0 ± 34.1
Median (IQR) 37 (17–59.5)
Values are presented as mean ± SD or number (%).
CVA, cerebrovascular accident; HTN, hypertension; DM, diabetes; Scr, serum creatinine; ICU, intensive care unit; ESRD, end-stage renal disease; GN, glomerulonephritis; PN, pyelonephritis; PCKD, adult polycystic kidney disease; RRT, renal replacement therapy;
HD, hemodialysis; PD, peritoneal dialysis; KT, kidney transplantation; HLA, human leukocyte antigen; PRA, panel reactive antibody;
SD, standard deviation; IQR, interquartile range.
METHODS
In this retrospective study, we reviewed the medical records and electronic transplant registry of KT recipients at Seoul St. Mary's Hospital, The Catholic University of Korea, from January 2000 to December 2011. During that period, 786 KTs were performed. Specific exclusion criteria included pediatric recipients (<18 years of age), simultaneous kidneypancreas transplant recipients, all living donor KT, and primary nonfunctional grafts. A consecutive series of 191 DD kidney transplants were studied. DGF was defined as the need for dialysis within 1 week postrenal transplantation [8]. The study recipients were divided into two groups–group I, DGF (n = 31, 16.2%); group II, nonDGF (n = 160, 83.8%).
The antiinterleukin 2 receptor antagonist (basiliximab) was administered intravenously for induction therapy. Cyclosporine or FK 506, mycophenolate mofetil or mycophenolate sodium, and steroids were used as primary immunosuppressive agents.
The following variables were compared: donor and recipient characteristics, patient and graft survival, postoperative renal function (mean creatinine and Modification of diet in renal disease [MDRD]Glomerular Filtration Rates [GFR] levels at 1 and 6 months, and 1, 3, 5, and 7year posttransplant), AR episodes, and the rates of surgical and infectious complications.
Renal allograft loss was defined as resumption of ongoing dialysis. Patient deaths with functioning grafts were censored.
Cytomegalovirus (CMV) infection was defined based on a positive realtime PCR test.
Donor and recipient selection
No specific DD upper age limit was excluded from consideration, and these series included 12 transplants from DD ≥ 60 years old. All DDs older than 60 years and DDs 50 to 59 years of age that met two of the following criteria: (1) history of hypertension, (2) cerebrovascular accident as a cause of brain death, (3) final preprocurement serum creatinine (SCr) level >
1.5 mg/dL were classified as expanded criteria donors (ECDs) based on United Network for Organ Sharing definitions. At the time of transplantation, patients were selected on the basis of blood type compatibility, waiting time, HLA matching, and a negative crossmatch in accordance with Korean Network for Organ Sharing guidelines [9].
Statistical analysis
The unpaired ttest for continuous variables and the chi
square test for categorical variables were used to compare data between the two groups. All data were expressed as the mean ± standard deviation. The KaplanMeier method was used to compare patients and graft survival rates between the two groups. Data were censored at the time of death or at the last available followup. Graft survival was also evaluated
by multivariate analyses according to Cox regression with an enteredfashion of variables. Statistical significance was defined as P < 0.05. All statistical analyses were carried out with PASW Statistics ver. 18.0 (SPSS Inc., Chicago, IL, USA).
RESULTS
During that period, we performed 195 DD renal transplants on adult recipients. We excluded primary nonfunction grafts (n
= 4), the overall prevalence of DGF was 16.2% (n = 31). Of the 191 KTs, 51.8% were male recipients and 65.6% received a kidney from a male donor. The average recipient age was 45.1 ± 9.6 years, and the mean followup duration was 43.7 ± 34.3 months. Donors and Recipients characteristics are provided in Table 1.
DGF recipients had a higher proportion of panel reactive antibody (PRA > 20%) (P = 0.008), with a low number of 0%
PRA (P = 0.004), but other baseline characteristics (age, gender, body mass index, cause of endstage renal disease, type of renal replacement therapy, number of antigen mismatches, history of pregnancy and transfusions) were not significantly different between the two recipient groups.
Risk factors of delayed graft unction
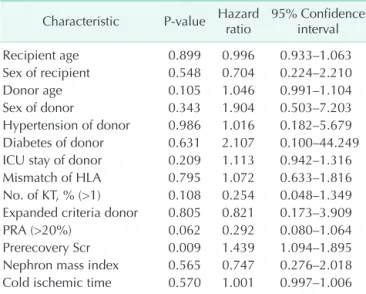
In the multivariate analysis, only the prerecovery SCr level (P < 0.001; HR, 1.814) was an independent risk factor for the development of DGF (Table 2).
Postoperation graft renal function
The SCr levels, mean MDRD GFR levels, and incidence of AR episodes were compared between the two groups as a measure
Table 2. Multivariate analysis for the risk factors of delayed graft function
Characteristic P-value Hazard ratio 95% Confidence interval
Recipient age 0.899 0.996 0.933–1.063
Sex of recipient 0.548 0.704 0.224–2.210
Donor age 0.105 1.046 0.991–1.104
Sex of donor 0.343 1.904 0.503–7.203
Hypertension of donor 0.986 1.016 0.182–5.679 Diabetes of donor 0.631 2.107 0.100–44.249 ICU stay of donor 0.209 1.113 0.942–1.316 Mismatch of HLA 0.795 1.072 0.633–1.816 No. of KT, % (>1) 0.108 0.254 0.048–1.349 Expanded criteria donor 0.805 0.821 0.173–3.909
PRA (>20%) 0.062 0.292 0.080–1.064
Prerecovery Scr 0.009 1.439 1.094–1.895 Nephron mass index 0.565 0.747 0.276–2.018 Cold ischemic time 0.570 1.001 0.997–1.006 ICU, intensive care unit; HLA, human leukocyte antigen; KT, kidney transplantation; PRA, panel reactive antibody; Scr, serum creati- nine.
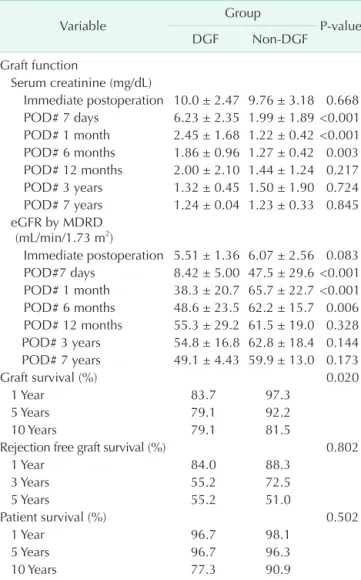
of graft function. The SCr levels and mean MDRD GFR level at 7 days, 1 month, and 6 months after transplantation were significantly lower in the nonDGF group but did not differ significantly after 12 months (Table 3). The incidence of an AR episode within 3 months posttransplant was 32.3% in the DGF group and 16.3% in the nonDGF group. This difference was significant (P = 0.037).
Infectious and surgical complications
The incidence of CMV infection was significantly higher in the DGF group (77.8% in the DGF vs. 55.6% in the nonDGF, P = 0.032).
Other infections did not differ remarkably between the two groups. When analyzing surgical complications types, the majority of complications in both groups were early (within 30 days after the KT) operative complications that were vascular, urologic, and
woundrelated (Table 4). The overall surgical complication rate between the groups was not different (P = 0.606).
Graft and patient survival
Graft survival rates at 1 year, 3 years, 5 years, and 10 years posttransplantation were 83.7%, 79.1%, 79.1%, and 79.1%, respectively, in the DGF group, and 97.3%, 92.2%, 90.6%, and 81.5%, respectively, in the nonDGF group. Patient survival rates at 1 year, 3 years, 5 years, and 10 years posttransplantation were 96.7%, 96.7%, 96.7%, and 77.3%, respectively, in the DGF group, and 98.1%, 96.3%, 96.3%, and 90.9%, respectively, in the non
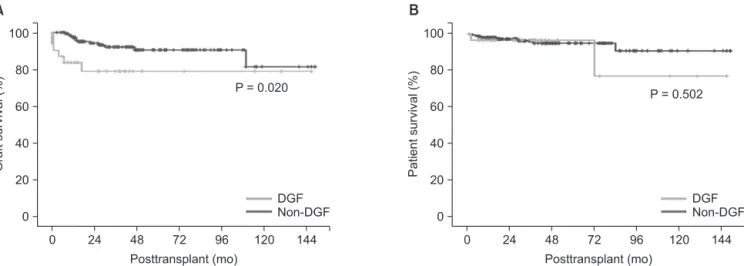
DGF group. There was a significant difference between the two groups in graft survival (P = 0.020) but no difference between the two groups in patient survival (P = 0.502). The overall cumulative grafts and patient survival rates in these groups are shown as KaplanMeier curves in Fig. 1.
Risk factors of graft survival
Using Cox logistic regression analysis, graft survival was clearly associated with nephron mass index (donor kidney to recipient body weight; Kw/Rw) at the time of transplantation, CMV infection, and AR episodes (Table 5).
DISCUSSION
DGF is a common immediate postoperative complication following deceaseddonor KT. DGF is primarily a result of ischemicreperfusion injury to the graft that is characterized Table 4. Infectious and surgical complications
Complication
Group
P-value DGF
(n = 31) Non-DGF (n = 160) Infectious complications
Viral infection
CMV infection 21 (77.8) 79 (55.6) 0.032
CMV disease 1 (3.2) 3 (1.9) 0.515
BKV infection 1 (3.2) 4 (2.5) 0.592 Herpes zoster infection 5 (16.1) 19 (11.9) 0.522 Bacterial infection 13 (41.9) 51 (31.9) 0.277 Fungal infection 3 (9.7) 6 (3.8) 0.164 Surgical complications 6 (19.4) 25 (15.6) 0.606
Vascular 1 (3.2) 2 (1.3)
Urologic 0 (0) 9 (5.6)
GI 0 (0) 3 (1.9)
Hematoma 2 (6.5) 1 (0.6)
Lymphocele 0 (0) 4 (2.5)
Wound infection 3 (9.7) 6 (3.8) Values are presented as number (%).
CMV real-time PCR < 500 copies/mL.
DGF, delayed graft function; CMV, cytomegalovirus; BKV, BK virus; GI, gastointestinal.
Table 3. Postoperative renal function of study groups
Variable Group
P-value
DGF Non-DGF
Graft function
Serum creatinine (mg/dL)
Immediate postoperation 10.0 ± 2.47 9.76 ± 3.18 0.668 POD# 7 days 6.23 ± 2.35 1.99 ± 1.89 <0.001 POD# 1 month 2.45 ± 1.68 1.22 ± 0.42 <0.001 POD# 6 months 1.86 ± 0.96 1.27 ± 0.42 0.003 POD# 12 months 2.00 ± 2.10 1.44 ± 1.24 0.217 POD# 3 years 1.32 ± 0.45 1.50 ± 1.90 0.724 POD# 7 years 1.24 ± 0.04 1.23 ± 0.33 0.845 eGFR by MDRD
(mL/min/1.73 m2)
Immediate postoperation 5.51 ± 1.36 6.07 ± 2.56 0.083 POD#7 days 8.42 ± 5.00 47.5 ± 29.6 <0.001 POD# 1 month 38.3 ± 20.7 65.7 ± 22.7 <0.001 POD# 6 months 48.6 ± 23.5 62.2 ± 15.7 0.006 POD# 12 months 55.3 ± 29.2 61.5 ± 19.0 0.328 POD# 3 years 54.8 ± 16.8 62.8 ± 18.4 0.144 POD# 7 years 49.1 ± 4.43 59.9 ± 13.0 0.173
Graft survival (%) 0.020
1 Year 83.7 97.3
5 Years 79.1 92.2
10 Years 79.1 81.5
Rejection free graft survival (%) 0.802
1 Year 84.0 88.3
3 Years 55.2 72.5
5 Years 55.2 51.0
Patient survival (%) 0.502
1 Year 96.7 98.1
5 Years 96.7 96.3
10 Years 77.3 90.9
Values are presented as mean ± standard deviation unless otherwise indicated.
DGF, delayed graft function; POD, postoperative day; eGFR, estimated glomerular filtration rates; MDRD, modification of diet in renal disease.
by postischemic acute tubular necrosis and interstitial inflammation [10]. Ischemic injury to allografts is the sum of possible transient warm ischemic intervals before or during removal from the donor and cold ischemia associated with preservation and storage. The prolonged exposure of the donor kidney to warm and/or cold ischemia increases the incidence of DGF and leads to a programmed process within the kidney, which may lead to chronic and progressive lesions [11,12].
In this study, the incidence of DGF was 16.2%, which was lower compared to what has been reported in recent studies [4,13,14]. In one US study, the reported incidence of DGF in DDs
increased over time despite progress in AR treatment, translating into a 40% decrease in longterm graft survival. Between 1985 and 1992, the rate of DGF in US scientific registries was 14.7%, but the incidence rose to 23% in 1998–2004 [2,15]. In the most recent reports, DGF occurred in all 2,409 US patients who underwent transplantation in 2008 (21.3%) [16]. In another recent study in Korea, the incidence of DGF was 17.6%, which was relatively similar to ours [7]. Two reasons for the low DGF incidence in Korea could be the short cold ischemic time (CIT), with a mean CIT of 4.05 ± 2.18 hours in the present study, and the population of Korea, which is comparatively homogeneous in race and ethnicity. According to the findings of previous studies, the risk factors of DGF were high levels of PRA, retransplantation, recipient and donor age, and CIT [2,17,18].
Despite the importance of CIT as a risk factor for DGF, the CIT was not different between the two groups in this study. The short ischemic time at our center is due to the fact that many of our recipients received kidneys from DDs managed in our hospital without the need for organ transport.
The purpose of this study was to analyze the risk factors of DGF and determine its impact on the outcomes of DD KT. We confirmed that the DGF rate correlates with the prevalence of diabetes mellitus in donors, ECD, a high level of PRA in the recipients (PRA > 20%), and prerecovery SCr level. However, using multivariate analysis, the preretrieval SCr (P < 0.001) was the only signifi cant risk factor for DGF. It was considered that a short CIT and a homogeneity of races and ethnicities could offset the risk of other donors, recipients, and immunologic factors for DGF.
This study evaluated the effect of DGF on clinical outcomes, longterm graft function, and survival. Some earlier studies suggested that the degree of DGF may be associated with worse graft outcomes [5,6,19]. Moreira et al. [6] reported that there was initially a significant difference regarding SCr, but this disappeared at 10 years. In this study, the SCr levels and Table 5. Results of Cox multivariate analysis of risk factors
for graft survival after deceased donor transplants
Characteristic P-value Hazard ratio 95% Confidence interval
Recipient age 0.445 1.029 0.956–1.108
Sex of recipient 0.961 1.031 0.302–3.517
Donor age 0.985 1.000 0.951–1.050
Sex of donor 0.279 2.529 0.471–13.570
Mismatch of HLA 0.312 1.362 0.749–2.477 History of previous KT 0.466 0.510 0.084–3.115 Expanded criteria donor 0.618 0.648 0.117–3.573
PRA (>20%) 0.148 0.366 0.094–1.426
Prerecovery Scr 0.072 1.373 0.972–1.938 Nephron mass index 0.026 2.328 1.106–4.900 Cold ischemic time 0.312 0.996 0.989–1.004 Surgical complication 0.071 0.313 0.089–1.103
CMV infection 0.038 0.114 0.015–0.888
Bacterial infection 0.839 0.884 0.269–2.902 Fungal infection 0.841 0.767 0.057–10.372
AR episode 0.038 0.166 0.030–0.905
DGF episode 0.151 4.531 0.576–35.610
HLA, human leukocyte antigen; KT, kidney transplantation; PRA, panel reactive antibody; Scr, serum creatinine; CMV, cytome- galovirus; AR, acute rejection; DGF, delayed graft function.
0
Posttransplant (mo) 100
80
60
40
20
0
Graftsurvival(%)
144
A
24 48 72 96 120
P = 0.020
DGF Non-DGF
0
Posttransplant (mo) 100
80
60
40
20
0
Patientsurvival(%)
144
B
24 48 72 96 120
P = 0.502
DGF Non-DGF
Fig. 1. Graft (A, P = 0.020) and patient survival (B, P = 0.502) in both groups. DGF, delayed graft function.
mean MDRD GFR levels at 7 days, 1 month, and 6 months after transplantation were significantly lower in the nonDGF group but did not significantly differ 1 year later. This effect was due to not only an adaptive ability, but also the removal from the data set of DGF recipients with a high creatinine level and grafts that failed beyond 1 year.
In addition to the SCr and MDRD GFR of graft function, the effect of DGF on longterm graft survival is more debatable. An earlier study reported that DGF was an independent risk factor for AR episodes, but had no independent effect on graft survival [17]. These data are similar to ours. In our study, graft survival rates at 1, 5, and 10year posttransplantation were 83.7%, 79.1%, and 79.1%, respectively, in the DGF group, and 97.3%, 90.6%, and 81.5%, respectively, in the nonDGF group. There was a significant difference between the two groups in graft survival (P = 0.020). It was considered that a higher incidence of an AR episode impacted on the longterm graft survival since AR episode was a clear risk factor for graft survival in our study, although rejectionfree graft survival was not significantly different between two groups.
However, on multivariate logistic regression analysis, DGF was not an independent risk factor of longterm graft survival.
Based on our results, (1) there was significant difference in graft function (SCr and MDRD GFR) between the two groups (DGF vs. nonDGF), but it disappeared at 1year posttransplantation, and (2) although there was a significant difference in graft survival between the two groups, DGF was not an independent risk factor for longterm graft failure. This is attributable to the fact that although DGF may affect early graft function, after recovering from DGF, it no longer becomes a significant independent risk factor of graft survival.
Our results are subject to the limitations inherent in observational and small population data in single center study. In addition, there are many combinations between transplantation factors that influence clinical outcomes but are not recognized in our study. Lastly, potential issues relating to the determination of AR, CIT, and graft loss include missing or incomplete data, sampling and technique errors, and subjective interpretation.
CONFLICTS OF INTEREST
No potential conflict of interest relevant to this article was reported.
1. Koning OH, Ploeg RJ, van Bockel JH, Groene
wegen M, van der Woude FJ, Persijn GG, et al. Risk factors for delayed graft function in cadaveric kidney transplantation: a prospective study of renal function and graft survival after preservation with University of Wisconsin solution in multi
organ donors. European Multicenter Study Group. Transplantation 1997;63:16208.
2. Ojo AO, Wolfe RA, Held PJ, Port FK, Schmouder RL. Delayed graft function: risk factors and implications for renal allo graft survival. Transplantation 1997;63:96874.
3. Yarlagadda SG, Coca SG, Garg AX, Doshi M, Poggio E, Marcus RJ, et al. Marked variation in the definition and diagnosis of delayed graft function: a systematic review. Nephrol Dial Transplant 2008;23:
29953003.
4. Miglinas M, Supranaviciene L, Mateikaite K, Skebas K, Kubiliene A. Delayed graft function: risk factors and the effects of early function and graft survival. Trans
plant Proc 2013;45:13637.
5. Grosso G, Corona D, Mistretta A, Zerbo D, Sinagra N, Giaquinta A, et al. Delayed graft function and longterm outcome in kidney transplantation. Transplant Proc 2012;44:187983.
6. Moreira P, Sa H, Figueiredo A, Mota A. Delayed renal graft function: risk factors and impact on the outcome of transplantation. Transplant Proc 2011;
43:1005.
7. Jung GO, Yoon MR, Kim SJ, Sin MJ, Kim EY, Moon JI, et al. The risk factors of delayed graft function and comparison of clinical outcomes after deceased donor kidney transplantation: singlecenter study. Transplant Proc 2010;42:7059.
8. Perico N, Cattaneo D, Sayegh MH, Remuzzi G. Delayed graft function in kidney transplantation. Lancet 2004;364:181427.
9. Kim MS, Kim SI, Kim YS. Current status of deceased donor organ recovery and sharing in Korea. J Korean Med Assoc
2008;51:68591.
10. Siedlecki A, Irish W, Brennan DC. Delayed graft function in the kidney transplant.
Am J Transplant 2011;11:227996.
11. Schroppel B, Legendre C. Delayed kidney graft function: from mechanism to trans
lation. Kidney Int 2014;86:2518.
12. Menke J, Sollinger D, Schamberger B, Heemann U, Lutz J. The effect of ischemia/
reperfusion on the kidney graft. Curr Opin Organ Transplant 2014;19:395400.
13. Ditonno P, Impedovo SV, Palazzo S, Bettocchi C, Gesualdo L, Grandaliano G, et al. Effects of ischemiareperfusion injury in kidney transplantation: risk factors and early and longterm outcomes in a single center. Transplant Proc 2013;45:26414.
14. Premasathian N, Avihingsanon Y, Ingsathit A, Pongskul C, Jittiganont S, Sumethkul V. Risk factors and outcome of delayed graft function after cadaveric kidney transplantation: a report from the Thai Transplant Registry. Transplant Proc
REFERENCES
2010;42:401720.
15. Tapiawala SN, Tinckam KJ, Cardella CJ, Schiff J, Cattran DC, Cole EH, et al.
Delayed graft function and the risk for death with a functioning graft. J Am Soc Nephrol 2010;21:15361.
16. Ommen ES, LaPointe Rudow D, Medapalli RK, Schroppel B, Murphy B. When good intentions are not enough: obtaining
followup data in living kidney donors.
Am J Transplant 2011;11:257581.
17. Boom H, Mallat MJ, de Fijter JW, Zwin
derman AH, Paul LC. Delayed graft function influences renal function, but not sur
vival. Kidney Int 2000;58:85966.
18. Humar A, Ramcharan T, Kandaswamy R, Gillingham K, Payne WD, Matas AJ. Risk factors for slow graft function after kidney
transplants: a multivariate analysis. Clin Transplant 2002;16:4259.
19. GiralClasse M, Hourmant M, Cantarovich D, Dantal J, Blancho G, Daguin P, et al.
Delayed graft function of more than six days strongly decreases longterm sur
vival of transplanted kidneys. Kidney Int 1998;54:9728.