Introduction
Chronic subdural hematoma (CSDH) is one of the most common types of intracranial (IC) hemorrhage that occurs at a rate of 1 to 2 per 100,000 per year.1,5,16) With advances in computed tomography (CT), brain scans, magnetic reso- nance imaging (MRI), and molecular biologic technologies,
the mechanisms of development, evolution, recurrence and risk factors of CSDH have been identified but needed to be confirmed. Brain atrophy is one of the high risks of CSDH especially in old age. Volume quantification of brain par- enchyme may provide better description of brain atrophy, as well as prediction of CSDH after head trauma, but it can be difficult and time consuming for all patients in practice.
There are many kinds of traditional indirect indices of brain atrophy but correlation between indirect indices and CSDH is little known.5,12,13) In this study, we evaluated brain atrophy of patients with head trauma by indirect indices (qualitative value) and its’ influence on CSDH. We tried to find reference value of indirect indices for predicting CSDH and to correlate indirect indices and volumetric analysis of brain CT (quantitative value).
Effectiveness of Cortical Atrophy Scale and Indirect Indices of Brain Atrophy to Predict Chronic Subdural Hematoma in Older Patients
Eun-Oh Jeong, MD, Seung-Won Choi, MD, Jeong-Wook Lim, MD, Hyon-Jo Kwon, MD, Seon-Hwan Kim, MD, Hyeon-Song Koh, MD, Jin-Young Youm, MD, and Shi-Hun Song, MD
Department of Neurosurgery, School of Medicine, Chungnam National University Hospital, Daejeon, Korea
Objective: To determine whether baseline cerebral atrophy can predict the rate of future chronic subdural hematoma (CSDH) after head trauma and compare indirect markers of brain atrophy with volumetric analysis of computed tomogra- phy (CT).
Methods: Single institution case-control study involving 1,476 patients who visited our hospital after head trauma from January 2009 to December 2014. Forty-one patients with delayed CSDH were identified and age, gender matched 41 pa- tients were selected as control group. Both volumetric analyze on CT and Evans index, frontal horn index, bicaudate ratio, sylvian fissure ratio and cortical atrophy scale of 82 patients were estimated by different raters and relationship of those factors with CSDH was analyzed.
Results: Every indirect indices except cortical atrophy scale were not enough to give a good estimate of CSDH. Brain at- rophy and cortical atrophy scale were predisposing factors of CSDH on multivariate analysis with statistical significance.
Conclusion: Brain atrophy was a potential prognostic factor of CSDH after trauma. In practice, patients with a value of cortical atrophy scale over moderate grade needed more attention for CSDH.
(Korean J Neurotrauma 2016;12(2):112-117) KEY WORDS: AnalysisㆍAtrophyㆍBrainㆍEvaluation studies as topicㆍHematoma, subdural, chronic.
Received: August 19, 2016 / Revised: October 4, 2016 Accepted: October 5, 2016
Address for correspondence: Seung-Won Choi
Department of Neurosurgery, School of Medicine, Chungnam National University Hospital, 282 Munhwa-ro, Jung-gu, Daejeon 35015, Korea
Tel: +82-42-280-7361, Fax: +82-42-280-7364 E-mail: [email protected]
cc This is an Open Access article distributed under the terms of Cre- ative Attributions Non-Commercial License (http://creativecommons.
org/licenses/by-nc/3.0/) which permits unrestricted noncommercial use, distribution, and reproduction in any medium, provided the original work is properly cited.
Korean J Neurotrauma 2016;12(2):112-117 https://doi.org/10.13004/kjnt.2016.12.2.112
Materials and Methods
Patients
A retrospective study was carried out on head trauma patients admitted in our hospital from January 2009 to De- cember 2014. Initially, 1,476 head trauma patients were found and 530 patients were over 65 years old. 304 patients of 530 patients were finally remained after following exclu- sion criteria;
1) Patient with initially diagnosed IC hematoma who re- quired surgery at admission.
2) Patients who underwent surgery within 7 days due to hematoma aggravation after head trauma.
3) Patients with initial Glasgow Coma Scale under 12.
4) Patients who had IC space-occupying lesion or brain edema.
5) Patients who had delayed CSDH within 3 weeks.
Among 304 patients who were not operated at acute or subacute phase, 41 patients had CSDH over 3 weeks after initial head trauma and classified as Group A. Gender and age matched (±5 years) 41 patients of 263 patients were randomly selected as a control group and classified as Group B. All patients’ medical records were reviewed in- cluding history of diabetes mellitus (DM), hypertension (HTN), cerebral infarction, cardiac disease, hematologic disease and epilepsy.
Volumetric analysis of CT (quantitative value)
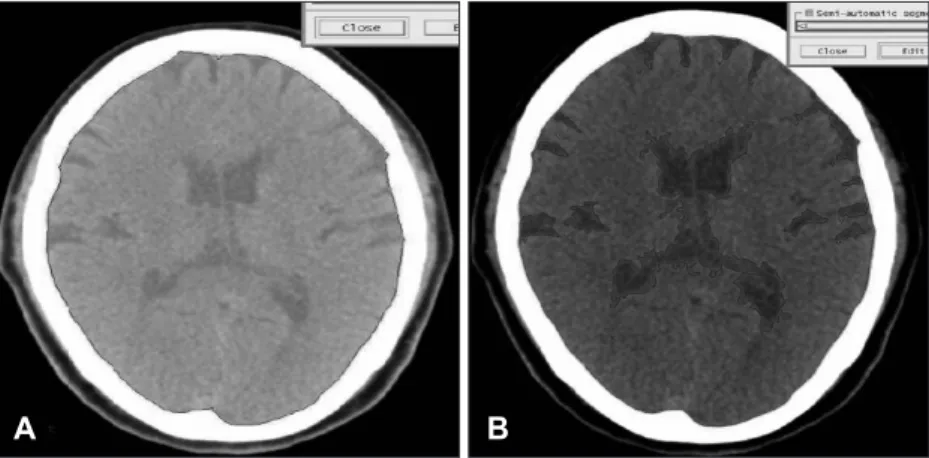
Volume measurement of Gamma-Plan program (Elekta instrument AB, Stockholm, Sweden) by sequential volume mapping was used to access quantitative volume of brain except cerebellum. Each slice was blindly analyzed by 2 neurosurgeons and 1 medical physicist and final evaluation was made by consensus between 3 raters. Brain atrophy in- dex was defined as the ratio of cerebrospinal fluid (CSF) volume to IC volume as expressed in percentage.4,19) [brain at-
rophy index (%)=(1-CSF volume/IC volume)×100] (Figure 1).
Indices of brain atrophy (qualitative value)
Similar to volumetric analysis, 3 raters measured the fol- lowing 5 traditional indirect indices of brain atrophy.
1) Evans index (EI)-Typically used as a measure of ven- tricle volume. EI is measured as the ratio of the maximal width of the frontal horns to internal width of cranium.3) Both diameters were measured in the same CT slice.
2) Frontal horn index (FHI)-FHI was measured as the ratio between the maximal width of both frontal horns and the width of the whole brain at the same level.15)
3) Bicaudate ratio (BCR)-Typically used as a measure of internal cerebral atrophy. The axial slice on which the cau- date nuclei produced the greatest amount of indentation on the lateral ventricles was identified, and the distance be- tween the 2 caudate apices was measured. This value was divided by the maximum width of the skull at the same lev- el as the caudate measurement.2,14)
4) Sylvian fissure ratio (SFR)-Typically used as a measure of external cerebral atrophy. The average of the maximum width of the 2 sylvian fissures on the section showing them at their widest was divided by the trans-pineal coronal inner table diameter.14)
5) Cortical atrophy scale-It was devised by Scheltens and colleagues.11) Scores 0-3 represent absent, mild, moderate and severe cortical atrophy, respectively. Mild changes are said to be present when there is sulci opening peripherally.
Moderate changes are seen when there is widening along the length of the sulcus. Severe atrophy is present when there is gyrus thinning. In this article, we assumed that pa- tients had cortical atrophy when cortical atrophy scale was over moderate grade (Figure 2).
Statistical analysis
Statistical analysis was carried out with the Windows ver-
A B
FIGURE 1. Volume measurement of Gamma-Plan program (Elekta instru- ment AB, Stockholm, Sweden) by se- quential volume mapping. (A) Black line contain Intracranial volume. (B) Black lilne contain cerebrospinal fluid volume.
sion of SPSS Version 20.0 (SPSS Inc., Chicago, IL, USA).
Student t-test and chi-square were utilized for difference between groups; in addition, linear regression was used to quantify the relationship between brain volume and indi- ces of brain atrophy. And linear regression with 95% confi- dence interval was used to identify the correlation between CSDH and indices of brain atrophy. A p-value of less than was considered as statistically significance.
Results
Patient characteristics
The mean age was 73.7 years Group A, and 78.2 years in Group B (p=0.059). Among 82 patients, 36 patients took an- tiplatelet agents; 19 patients of Group A and 17 patients of Group B and there was no statistically significant (p=0.522).
History of cerebral infarction showed higher percentage in Group A than Group B, with borderline significance (p=
0.083). Gender, DM, HTN, smoking, anticoagulation agent and history of heart disease, epilepsy, hematologic disease had no statistical significance between 2 groups. We sum- marized all results in Table 1.
Correlation between indirect indices and quantitative volume
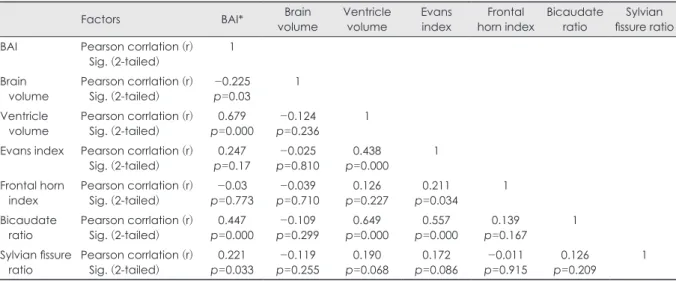
BCR and EI had significant and moderately strong cor- relation with ventricle volume (r=0.679, r=0.44, p=0.000, respectively). BCR (r=0.447, p=0.000) was the most signifi- cant influencing factor for brain atrophy, followed by EI (r=0.247, p=0.17), and SFR (r=0.221, p=0.033). BCR also had correlation with volume of cortical subarachnoid space, but correlation coefficient was low (r=0.247, p=0.02). On the other hand, there was no relationship between indirect indices and brain hemisphere volume. All results were shown in Table 2.
Volumetric analysis (quantitative value)
In quantitative study, brain volume was 1,158.1 mL in Group A and 1,130.6 mL in Group B (p=0.45). Ventricle vol- ume was 50.8 mL in Group A and 42.5 mL in Group B and volume of cortical subarachnoid space was 89.2 mL in Group A and 85.2 mL in Group B with no statistically sig- nificance, respectively (p=0.19, p=0.79). There was a high- er degree of brain atrophy index in Group A (9.08%) than Group B (6.38%), with statistical significance (p=0.003). All
A B C D
FIGURE 2. Brain computed tomography examples of cortical atrophy scale. (A) Absent atrophy. (B) Mild atrophy. (C) Moderate at- rophy. (D) Severe atrophy.
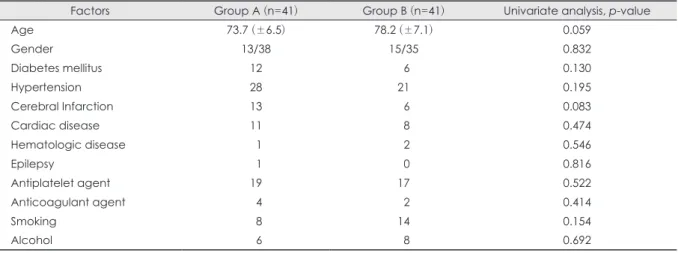
TABLE 1. Univariate analysis of factors on chronic subdural hematoma after trauma
Factors Group A (n=41) Group B (n=41) Univariate analysis, p-value
Age 73.7 (±6.5) 78.2 (±7.1) 0.059
Gender 13/38 15/35 0.832
Diabetes mellitus 12 06 0.130
Hypertension 28 21 0.195
Cerebral Infarction 13 06 0.083
Cardiac disease 11 08 0.474
Hematologic disease 01 02 0.546
Epilepsy 01 00 0.816
Antiplatelet agent 19 17 0.522
Anticoagulant agent 04 02 0.414
Smoking 08 14 0.154
Alcohol 06 08 0.692
results are shown in Table 3.
Indirect indices analysis (qualitative value)
EI was 0.24 of Group A and 0.25 of Group B and there was no statistical significance (p=0.348). FHI was 0.29 of Group A and 0.3 of Group B without statistical significance.
In BCR and SFR, there was higher tendency in Group A than Group B but, there was no statistical significance. On the other hand, cortical atrophy scale and brain cortical at- rophy had statistical significance (p=0.014, p=0.024, re- spectively). All results are shown in Table 3.
Cortical atrophy scale had statistically significant be-
tween Group A and B (p=0.014). In brain cortical atrophy (2 or 3 of cortical atrophy scale), there was 17 patients in Group A and 6 patients in Group B with statistical signifi- cance (p=0.024).
TABLE 3. Indirect indices and brain volume between chronic subdural hematoma and control groups
Factors Group A (n=41) Group B (n=41) p-value
Quantitative value
Brain (mL) 1158.1 1130.6 0.45
Ventricle (mL) 0050.8 0042.5 0.19
Cortical subarachnoid space (mL) 0089.2 0085.2 0.79
Brain atrophy index* (%) 0009.08 0006.38 0.003
Qualitative value
Evans index 0000.24 0000.25 0.348
Frontal horn index 0000.29 0000.30 0.357
Bicaudate ratio 0000.15 0000.14 0.417
Sylvian fissure ratio 0000.067 0000.056 0.181
Brain cortical atrophy scale 0.014
Normal 0007 0018
Mild 0017 0017
Moderate 0011 0006
Severe 0006 0000
Brain cortical atrophy† 0017 0006 0.024
*brain atrophy index: 1-brain volume/intracranial volume ×100%, †brain cortical atrophy: value of brain cortical atrophy scale over moderate grade
TABLE 4. Multivariate analysis of factors on chronic subdural hematoma after trauma
Factors p-value Exp (ß) 95% CI
Brain atrophy index* 0.029 3.1 1.092-11.853 Brain cortical atrophy† 0.042 2.02 0.721-4.8930
*brain atrophy index: 1-brain volume/intracranial volume ×100%,
†brain cortical atrophy: value of brain cortical atrophy scale over moderate grade. CI: confidence interval
TABLE 2. Pearson correlation between indirect indices and quantitative volume
Factors BAI* Brain
volume Ventricle
volume Evans
index Frontal
horn index Bicaudate
ratio Sylvian fissure ratio BAI Pearson corrlation (r)
Sig. (2-tailed) 1
Brain
volume Pearson corrlation (r)
Sig. (2-tailed) -0.225
p=0.03 1
Ventricle
volume Pearson corrlation (r)
Sig. (2-tailed) 0.679
p=0.000 -0.124
p=0.236 1
Evans index Pearson corrlation (r)
Sig. (2-tailed) 0.247
p=0.17 -0.025
p=0.810 0.438
p=0.000 1
Frontal horn
index Pearson corrlation (r)
Sig. (2-tailed) -0.03
p=0.773 -0.039
p=0.710 0.126
p=0.227 0.211
p=0.034 1
Bicaudate
ratio Pearson corrlation (r)
Sig. (2-tailed) 0.447
p=0.000 -0.109
p=0.299 0.649
p=0.000 0.557
p=0.000 0.139
p=0.167 1
Sylvian fissure
ratio Pearson corrlation (r)
Sig. (2-tailed) 0.221
p=0.033 -0.119
p=0.255 0.190
p=0.068 0.172
p=0.086 -0.011
p=0.915 0.126
p=0.209 1
*brain atrophy index: 1-brain volume/intracranial volume ×100%. BAI: brain atrophy index
Predisposing factors of CSDH
The multivariate analysis of the potential predisposing factors for the CSDH was done and there was statistically significant in brain atrophy index (p=0.029) and cortical at- rophy scale (p=0.042). Results were shown in Table 4.
Discussion
Patient characteristics
In initial study design, we tried to reduce the effect of oth- er factors on chronic subdural hemorrhage except for indi- rect indices. So, age and gender matched 41 patients were randomly selected as the control group. In chi-square anal- ysis, there was no statistically significant factors between 2 groups, and this can be considered that performance of random sampling was appropriate.
Brain atrophy
Recently, increasing of older peoples and patients had an- tiplatelet or anticoagulant treatment, CSDH patients have been increased. There are many reports that attempted to confirm predisposing factors, because CSDH patients are diagnosed after a few weeks from trauma. Among many predisposing factors, brain atrophy has been reported as re- liable factor.5,12,19)
Direct or indirect head trauma can cause injury of the bridging vein or Mittenzweig’s vessels, resulting in hema- toma in the subdural space. Subsequently, acute hemato- ma can undergo absorption through hemolysis or gradual enlargement to cause symptoms. In this process, brain atro- phy allows ease of separation of the dura-arachnoid inter- space on head trauma, with resultant fibrin deposits and ac- cumulation of serum and exudates that induce proliferation of granulation tissue on the inner dural surface. This pro- liferation of dura results in production of neo-membrane and subsequent growth of new vessels directly within the sub- dural space. The repeated micro-bleeding from these ves- sels cause CSDH.8,10,17,18)
Yang et al.19) analyzed degree of brain atrophy in 19 pa- tients of CSDH and 76 age-matched patients as control group and reported that there was higher degree of brain atrophy in CSDH group. In their study, mean brain atrophy index was 14.3% and even stronger predictor of CSDH especial- ly for younger patients under 65 years old. In our study an- alyzed older patients over 65 years old, mean brain atrophy index was 9.08% of CSDH patients with statistical signifi- cant and also predisposing factors for the CSDH.
Qualitative and quantitative volumetric analysis There are several previous studies to estimate part or to- tal volume of a structure or region of interest. Qualitative indices are useful in diagnosis and estimation of disease, but it is important to select an appropriate index depending on disease and purpose.
In order to estimate correlation between brain atrophy and indirect indices of brain atrophy, multiple linear regression analysis was conducted. BCR and SFR had positive corre- lation with brain atrophy index with statistically signifi- cant but other indices had no correlation. However, both indices had low correlation coefficient with brain atrophy index, so it seemed to be hard to give a good estimate of brain atrophy.
EI is usually used to estimate ventricle volume especial- ly for hydrocephalus.3) In 2005, the idiopathic normal pres- sure hydrocephalus (INPH) guidelines9) recommended that a value of EI above 0.3 on CT or MRI was defined as ven- tricular dilation. In our study, EI was even slightly higher in 0.25 of control group than 0.24 of CSDH group. EI had posi- tive correlation with quantitative ventricle volume but not in brain atrophy index.
Cortical atrophy scale is usually used in neurology to study degenerative neuronal disease.6) In initial analysis, there was no patient in control group who had severe grade of cor- tical atrophy scale. So it was hard to see there was mean- ingful result of cortical atrophy scale between 2 groups. In this regard, we divided patients based on value of cortical atrophy scale over 2 or not and there was statistical signifi- cance between 2 groups. Möller et al.7) reported that corti- cal atrophy scale was quantitatively validated and reliably reflected brain atrophy compared with volumetric analy- sis on MRI. In multiple regression analysis of 5 indirect in- dices and brain atrophy index, cortical atrophy and brain atrophy index had statistical significant. Cortical atrophy scale has shown to be a quick and reproducible method to assess the degree of atrophy in practice.
There were some limitations in our study due to its retro- spective nature. In radiologic features, MRI can be more appropriate for quantitative as well as qualitative evalua- tion, but brain CT is usually taken at the time of traumatic brain injury. Intra-rater reliability for cortical atrophy scale is high; however, there is a need to confirm inter-rater reli- ability.
Conclusion
Brain atrophy is a potential prognostic factor of CSDH after trauma. In practice, indirect indices are used to esti-
mate brain atrophy and cortical atrophy scale had better pre- diction of CSDH in qualitative and quantitative volumetric analysis. Careful image interpretation is needed for early diagnosis of CSDH.
■ The authors have no financial conflicts of interest.
REFERENCES
1) Ahmed E, Aurangzeb A, Khan SA, Maqbool S, Ali A, Zadran KK, et al. Frequency of conservatively managed traumatic acute sub- dural haematoma changing into chronic subdural haematoma. J Ayub Med Coll Abbottabad 24:71-74, 2012
2) Bermel RA, Bakshi R, Tjoa C, Puli SR, Jacobs L. Bicaudate ratio as a magnetic resonance imaging marker of brain atrophy in mul- tiple sclerosis. Arch Neurol 59:275-280, 2002
3) Evans W. An encephalographic ratio for estimating ventricular en- largement and cerebral atrophy. Arch Neurol Psychiatry 47:931- 937, 1942
4) Goldszal AF, Davatzikos C, Pham DL, Yan MX, Bryan RN, Resn- ick SM. An image-processing system for qualitative and quanti- tative volumetric analysis of brain images. J Comput Assist To- mogr 22:827-837, 1998
5) Jack A, O’Kelly C, McDougall C, Findlay JM. Predicting recur- rence after chronic subdural haematoma drainage. Can J Neurol Sci 42:34-39, 2015
6) Koedam EL, Lehmann M, van der Flier WM, Scheltens P, Pijnen- burg YA, Fox N, et al. Visual assessment of posterior atrophy de- velopment of a MRI rating scale. Eur Radiol 21:2618-2625, 2011 7) Möller C, van der Flier WM, Versteeg A, Benedictus MR, Wattjes
MP, Koedam EL, et al. Quantitative regional validation of the vi- sual rating scale for posterior cortical atrophy. Eur Radiol 24:397- 404, 2014
8) Markwalder TM. Chronic subdural hematomas: a review. J Neu- rosurg 54:637-645, 1981
9) Marmarou A, Bergsneider M, Klinge P, Relkin N, Black PM. The value of supplemental prognostic tests for the preoperative assess-
ment of idiopathic normal-pressure hydrocephalus. Neurosurgery 57:S17-S28, 2005
10) Sajanti J, Majamaa K. High concentrations of procollagen pro- peptides in chronic subdural haematoma and effusion. J Neurol Neurosurg Psychiatry 74:522-524, 2003
11) Scheltens P, Pasquier F, Weerts JG, Barkhof F, Leys D. Qualitative assessment of cerebral atrophy on MRI: inter- and intra-observer reproducibility in dementia and normal aging. Eur Neurol 37:95- 99, 1997
12) Son S, Yoo CJ, Lee SG, Kim EY, Park CW, Kim WK. Natural course of initially non-operated cases of acute subdural hemato- ma: the risk factors of hematoma progression. J Korean Neuro- surg Soc 54:211-219, 2013
13) Tugcu B, Tanriverdi O, Baydin S, Hergunsel B, Günaldı Ö, Ofluo- glu E, et al. Can recurrence of chronic subdural hematoma be pre- dicted? A retrospective analysis of 292 cases. J Neurol Surg A Cent Eur Neurosurg 75:37-41, 2014
14) van Zagten M, Kessels F, Boiten J, Lodder J. Interobserver agree- ment in the assessment of cerebral atrophy on CT using bicaudate and sylvian-fissure ratios. Neuroradiology 41:261-264, 1999 15) Walchenbach R, Geiger E, Thomeer RT, Vanneste JA. The value
of temporary external lumbar CSF drainage in predicting the out- come of shunting on normal pressure hydrocephalus. J Neurol Neurosurg Psychiatry 72:503-506, 2002
16) Winn HR. Youmans neurological surgery, ed 5. Philadelphia, PA:
W. B. Saunders, 2004
17) Yamamoto H, Hirashima Y, Hamada H, Hayashi N, Origasa H, Endo S. Independent predictors of recurrence of chronic subdural hematoma: results of multivariate analysis performed using a lo- gistic regression model. J Neurosurg 98:1217-1221, 2003 18) Yamazaki Y, Tachibana S, Kitahara Y, Ohwada T. Promotive fac-
tors of chronic subdural hematoma in relation to age. No Shinkei Geka 24:47-51, 1996
19) Yang AI, Balser DS, Mikheev A, Offen S, Huang JH, Babb J, et al. Cerebral atrophy is associated with development of chronic sub- dural haematoma. Brain Inj 26:1731-1736, 2012