2013, Vol. 57, No. 6
Printed in the Republic of Korea
http://dx.doi.org/10.5012/jkcs.2013.57.6.769
Rate Expression of Fischer-Tropsch Synthesis Over Co–Mn Nanocatalyst by Response Surface Methodology (RSM)
Mohsen Mansouri, Hossein Atashi*, Mir Mohammad Khalilipour, Naimeh Setareshenas, and Farhad Shahraki Department of Chemical Engineering, University of Sistan & Baluchestan, Zahedan 98164-161, Iran.
*E-mail: atashi.usb@gmail.com
(Received July 14, 2013; Accepted November 10, 2013)
ABSTRACT. The effect of operating conditions (temperature and the partial pressures of H2 and CO) on the reaction rate of Fischer–Tropsch synthesis (FTS) were investigated by carrying out experiments according to a Box-Behnken design (BBD), and were mathematically modeled by using response surface methodology (RSM). The catalyst used was a nano-structured cobalt/manganese oxide catalyst, which was prepared by thermal decomposition. The rate of synthesis was measured in a fixed-bed micro reactor with H2/CO molar feed ratio of 0.32–3.11 and reactor pressure in the range of 3–9.33 bar at space velocity of 3600 h−1 and a temperature range of 463.15–503.15 K, under differential conditions (CO conversion below 2%).
The results indicated that in the present experimental setup, the temperature and the partial pressure of CO were the most sig- nificant variables affecting reaction rate. Based on statistical analysis the quadratic model of reaction rate of FTS was highly significant as p-value 0.0002.
Key words: Fischer–Tropsch synthesis, RSM, Rate of CO consumption, Cobalt–manganese nanocatalyst
INTRODUCTION
The Fischer−Tropsch synthesis (FTS) is an interesting and promising pathway for the conversion of natural gas to transportation fuels.1 While process variables such as temperature, pressure, gas flow rate and ratio in the H2/CO feed are very important, the major determinants of reac- tion rate and product distribution are the catalyst used.
Among the candidate transient metals only Co and Fe based catalysts due to their cost, activity and selectivity have been developed for industrial uses.2 It is shown that the addition of Mn to Fe or Co catalysts leads to a sig- nificant increase in high olefin formation and a decrease in methane activity.3,4 Mixed metal catalysts are often capa- ble of activity, selectivity, or have a stability, that is unob- tainable with a single component and it is believed that bimetallic catalysts system due to the thermodynamic and kinetic limitations of the reaction are more able to raise the value of the light olefins.1,5
The rate description of the FT reaction is very impor- tant task for the industrial practice, being a prerequisite for the industrial process design, optimization and simula- tion. Rate of CO conversion values in the FTS have been achieved in various temperatures, pressures, catalyst weights and H2/CO molar ratios. If the used experimental data is enough, a reaction rate study will be reliable; in the rate of CO consumption study, the equation’s accuracy of chem-
ical reactions increases as the number of experimental data increases. Provision of the numerous data using the fixed bed micro-reactor is a time-consuming and costly proce- dure. Thus a mathematical model that can estimate the major experimental data will be very valuable and interesting in industry.
In recent years, design of experiments (DOE) and sta- tistical tools has been attracted researchers and several experimental studies have been conducted through DOE.6−11 DOE is a structured and systematized method of exper- imentation in which all factors are varied simultaneously over a set of experimental runs in order to determine the relationship between factors (i.e., interaction effects between experimental condition parameters) affecting the output response of the FTS process.
Having a variety of statistical tools, the response surface methodology (RSM) is an efficient procedure in scientific studies. This methodology is a collection of statistical tech- niques for designing of experiments, building the models, evaluating the effects of factors and searching for the opti- mum conditions. The purpose of RSM is establishing the systematic modeling, demonstrating and optimizing the behaviors via regression/statistical/graphical tools which lead to more efficient understanding of the complicated processes. In the last few years, RSM has been applied to optimize and evaluate interactive effects of independent factors in numerous chemical and biochemical processes
such as, wastewater treatment,12 CO2 adsorption,13 steam reforming of methanol,14 thermoacoustic refrigerator,15 tri- reforming of methane.16 Although statistical methodolo- gies and RSM have been used extensively in various sci- entific fields as well as catalysis science,6−9 a few studies for CO hydrogenation are based on statistical methodol- ogies.10,11 However, the rate of CO consumption and the effect of interaction of operating conditions using response sur- face methodology based on the Box-Behnken design (BBD) to develop model for reaction rate of FTS have not been reported.
The objective of this study is to assess the rate of the CO hydrogenation on nano-structured Co–Mn catalyst which was prepared by thermal decomposition of [Co(NH3)4CO3]MnO4 precursor. The individual and mutual effects of the exper- imental variables, temperature and the partial pressures of H2 and CO, on the reaction rate in the FTS were investigated using the statistical design of experiments and RSM.
Empirical mathematical models for the rate expression of FTS as function of the most significant rate expression of FTS variables have been developed and validated based on regression techniques.
MATERIALS AND METHODS Catalyst Synthesis and Characterization17
The catalyst used in the present study was prepared using a thermal decomposition precursor as follows. An aqueous solution (60 ml) of ammonium carbonate (20 g) was added to a concentrated aqueous NH3 (60 ml), and the mixture was stirred at room temperature for 30 min. To this solution was then added an aqueous solution (30 ml) of Co(NH3)2.6H2O (15 g) and the resulting solution was stirred at room temperature for 1 h. Then, 8 ml of 30% hydro-
gen peroxide was dropwise added into the solution, stirring continuously. The final solution was filtered and left for slow evaporation in air until water-soluble [Co(NH3)4CO3]NO3 crystals were obtained. KMnO4 (1 mmol) was added to a solution containing [Co(NH3)4CO3]NO3 (1 mmol) in 100 ml water and the mixture was stirred for several minutes. The precipitates ([Co(NH3)4CO3]MnO4 precursor) were recov- ered by centrifugation and washed by distilled water and then dried in ambient air at 30oC overnight. In order to obtain the final nano-catalyst, the precursor was calcined at 400oC in static air in the electric furnace for 4 h. The gray powder, nano-structured Co–Mn oxide catalyst was formed and kept in desiccator.
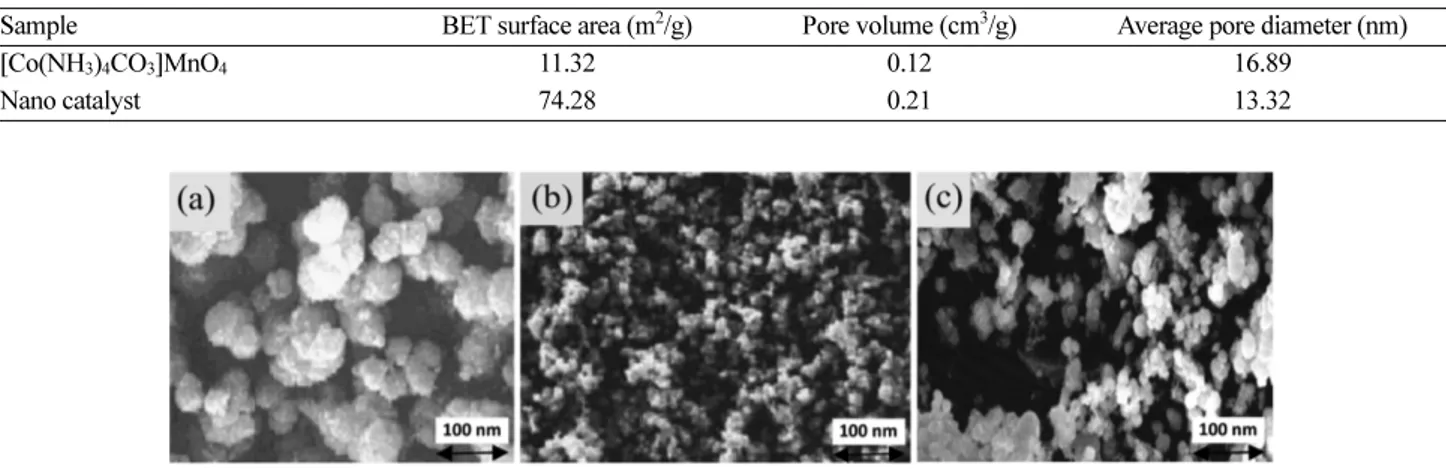
Physical properties and SEM images of precursor and calcined catalysts (before and after the reaction) are shown in Table 1 and Fig. 1, respectively. The SEM observations have shown differences in morphology of precursor and calcined catalysts (before and after the reaction) and indicate that these materials are made of nano-metric particles.
Catalyst Testing
A schematic representation of the experimental setup is shown in Fig. 2. Fischer–Tropsch synthesis was carried out in a fixed-bed micro-reactor made of stainless steel with an inner diameter of 20 mm. All gas lines to the reac- tor bed were made from 1/4 stainless steel tubing. Three mass flow controllers (Brooks, Model 5850E) equipped with a four-channel read out and control equipment (Brooks 0154) were used to adjust automatically the flow rate of the inlet gases (CO, H2, and N2 with purity of 99.99%). The mixed gases in the mixing chamber passed into the reac- tor tube, which was placed inside a tubular furnace (Atbin, Model ATU 150-15) capable of producing a temperature up to 1500 ºC and controlled by a digital programmable Table 1. Physical properties of the precursor and nanocatalyst
Sample BET surface area (m2/g) Pore volume (cm3/g) Average pore diameter (nm)
[Co(NH3)4CO3]MnO4 11.32 0.12 16.89
Nano catalyst 74.28 0.21 13.32
Figure 1. SEM micrographs of (a) precursor, (b) calcined catalyst before the test, and (c) calcined catalyst after the test.
controller (DPC). The reactor tube was constructed from stainless steel tubing; internal diameter of 9 mm, with the catalyst bed situated in the middle of the reactor. The reac- tion temperature was controlled by a thermocouple inserted into catalyst bed and visually monitored by a computer equipped with software. Some thermocouples inserted in the catalyst bed for monitoring the inlet, outlet and bed temperatures by a DPC. The meshed catalyst (1.0 g) was held in the middle of the reactor using quartz wool. It consist of an electronic back pressure regulator which can control the total pressure of the desired process using a remote control via the TESCOM software package integration that improves or modifies its efficiency that is capable for working on pressure ranging from atmospheric pressure to 34 bar. The catalyst was pre-reduced in situ atmospheric pressure in a flowing H2–N2 stream (N2/H2= 1, flow rate of each gas = 30 ml/min) at 300 ºC for 12 h before synthesis gas exposure.
The catalysts were extremely fine particles so intraparticle diffusion could be neglected. The gas hourly space velocity (GHSV) increased to the value in which the CO conver- sion was almost the same for a variety of catalyst weight which indicates that external diffusion can be neglected above this GHSV. Hence, the experiments for the rate expres- sion were conducted free from internal and external mass transfer limitations. Experiments were carried out with mixtures of H2, CO and N2 in a temperature range of 463.15–503.15 K, H2/CO molar feed ratio of 0.32/1–3.11/1, pressure range of 3–9.33 bar and GHSV= 3600 h–1 after 10–15 h of reaction to obtain a steady-state activity. Reac- tant and product streams were analyzed on-line using a gas chromatograph (Varian, Model 3400 Series) equipped
with a 10-port sampling valve (Supelco company, USA, Visi Model), a sample loop, flam ionization detector (FID) and thermal conductivity detector(TCD). The contents of the sample loop were injected automatically into a packed column (Hayesep DB, Altech Company, USA, 1/8 OD, 10 m long, and particle mesh 100/120). Helium was employed as a carrier gas for optimum sensitivity (flow rate = 30 ml/
min). The calibration was carried out using various calibration mixtures and pure compounds obtained from American Matheson Gas Company (USA). GC control and collec- tion of all chromatograms were performed via an IF-2000 Single channel data interface (TG Co, Tehran, Iran) using Windows® environment. Typically, the experimental reaction rate was determined as follows:
(1) and
(2) where, rCO is CO consumption rate (mol CO gcat−1 min−1), NCO,in and NCO,out are CO molar flow rates of feed and effluent stream (mol min−1), respectively. W is catalyst mass (g), νin represents the volumetric flow rate of feed gas (cm3 min−1), PCO0 is inlet CO partial pressure (bar), T is temperature (K) and R is the general gas constant (cm3 bar mol−1 K−1).
Experimental Design and Response Surface Regression RSM is a collection of mathematical and statistical tech- niques for empirical model building. By careful design of experiments, the objective is to develop quadratic model for independent parameters and to test response surface model by analysis of variance (ANOVA). In this method the response and independent variables are defined by input and output variable respectively. An experiment is a series of tests, called runs, in which changes are made in the input variables in order to identify the reasons for changes in the output response. By cognizance of significant factors from previous works or carrying out factorial design, the math- ematical model could be developed by using more com- plex experimental designs such as central composite designs (CCD), the BBD, Doehlert matrix and three-level full fac- torial design.18 Ferreira et al.19 showed that the BBD method where the factor number is higher than 2 is much more efficient in comparison to other response surface designs for the quadratic model. The most important feature of BBD is avoiding of suggesting runs which all factors are
rCO
– NCO in, –NCO out, ---W
=
NCO in, νinPCO0 ---RT
= Figure 2. Schematic representation of the reactor used. (1) Gas
cylinders, (2) pressure regulators, (3) needle valves, (4) mass flow controllers, (5) monometers, (6) non-return valves, (7) ball valves, (8) tubular furnace, (9) reactor, (10) catalyst bed, (11) trap, (12) condenser, (13) silica gel column, and (14) gas chro- matograph (GC).
simultaneously at their highest or lowest levels. For a prob- lem involving k factor (independent variable) BBD date point consist of 2k(k1) + C0 points (where k is number of fac- tors and C0 is the number of central points). By linear regression the BBD method use the experimental result to determine the coefficients of the second-degree polyno- mial equations.
Analysis of variance (ANOVA) was used for graphical analyses of the data to obtain the interaction between the process variables and the responses. The quality of the fit polynomial model was expressed by the coefficient of determi- nation R2, and its statistical significance was checked by the Fisher’s F-test in the same program. Model terms were evaluated by the P-value (probability) with 95% confidence level. Three-dimensional plots and their respective con- tour plots were obtained for reaction rate of FTS based on effects of the three variables (temperature, partial pressure of CO and partial pressure of H2) at three levels.
As shown in Fig. 3, this rotatable experimental plan was carried out as a BBD consisting of 15 experiments for the rate expression of FTS. The factors (variables) in this exper- iment were the temperature (X1), partial pressure of CO (X2) and partial pressure of H2 (X3). These three variables are taken into consideration according to previous study as significant factor in FTS.1−5,17−23 The operating region
and the levels of the variables in actual and coded values are shown in Table 2 variables use for FTS. The response surface model (RS-model) with interaction terms was developed for the reaction rate of FTS using Eq. (3).
(3)
where is the predicted response, Xi is the coded vari- ables, and b0, bi, bii, bij are the regression coefficients (i.e.
offset term, main, quadratic and interaction terms) of BBD method.
yˆ b0 bi
i 1=
∑
k Xi i 1∑
=k biiXi2 biji j<
∑
k XiXj+ + +
=
yˆ
Figure 3. Schematic diagram of Box Behnken design (BBD) as a function of X1 (temperature), X2 (partial pressure of CO), and X3 (partial pressure of H2).
Table 2. Designed variables and their coded and actual values used for experimental design.
Design Variables (factors) Coded variables Actual variables Actual values of coded levels
Temperature (K) X1 T 463.15 483.15 503.15
Partial pressure of CO (bar) X2 PCO 0.9 1.85 2.8
Partial pressure of H2 (bar) X3 PH2 0.9 1.85 2.8
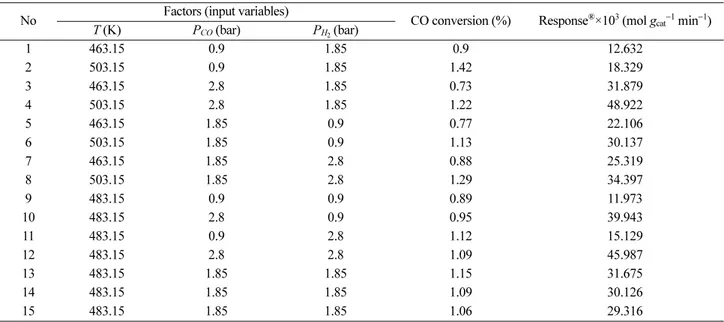
Table 3. Experimental values for reaction rate of FTS after 10–15 h of starting reaction at given conditions in a fixed bed reactor
No Factors (input variables)
CO conversion (%) Response®×103 (mol gcat−1 min−1)
T (K) PCO (bar) PH2 (bar)
1 463.15 0.9 1.85 0.9 12.632
2 503.15 0.9 1.85 1.42 18.329
3 463.15 2.8 1.85 0.73 31.879
4 503.15 2.8 1.85 1.22 48.922
5 463.15 1.85 0.9 0.77 22.106
6 503.15 1.85 0.9 1.13 30.137
7 463.15 1.85 2.8 0.88 25.319
8 503.15 1.85 2.8 1.29 34.397
9 483.15 0.9 0.9 0.89 11.973
10 483.15 2.8 0.9 0.95 39.943
11 483.15 0.9 2.8 1.12 15.129
12 483.15 2.8 2.8 1.09 45.987
13 483.15 1.85 1.85 1.15 31.675
14 483.15 1.85 1.85 1.09 30.126
15 483.15 1.85 1.85 1.06 29.316
Experimental data for reaction rate of FTS after 10–15 h of starting reaction in a fixed bed reactor over Co–Mn nanocatalyst are given in Table 3. The relationship between the three variables (temperature, partial pressure of CO and partial pressure of H2) and reaction rate of FTS was analyzed using response surface methodology (RSM).
RESULT AND DISCUSSIONS
Analysis of Variance (ANOVA) and the Second-Order Model
The ANOVA has been employed to check the signifi- cance of the second-order models. For response (reaction rate of FTS) the statistical significance of the second-order regression models was determined by F-value, which is measurement of variance of data about the mean, based on the ratio of mean square of group variance due to error. The analysis of variance of regression parameters of the response surface quadratic model for reaction rate of FTS is shown in Table 4. Based on ANOVA result the model is signif- icant by the p-value of 0.0002, similarly the model F-value of 56.39 implies that the model is also significant. The lack of fit term is non-significant (0.2385 i.e. greater than 0.05) which indicates that the quadratic model is valid and that the systematic variation does not exist in the hypothesized model. Moreover, the correlation coefficient (R2=0.9902) obtained for FTS, indicating that good agreement between the calculated and observed results within the range of experiments. Therefore, the response surface model estab- lished in this study for predicting FTS was considered rea- sonable. The final model, in terms of coded and actual factors is expressed by the quadratic empirical equation in Table 5.
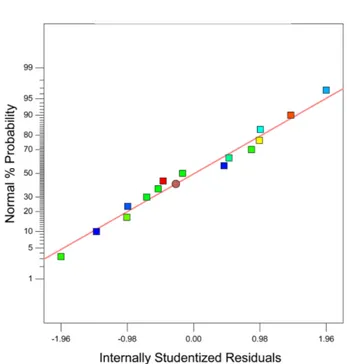
The adequacy of the modeled approximation can be shown by diagnostic plots which are provided by RSM. Fig. 4 displays the normal probability of the residuals, to verify whether the standard deviations between the actual and the predicted response values follow a normal distribution.
The results illustrated in Fig. 4 convey the general impres- sion of a normal distribution of underlying errors, since the residuals fall near to a straight line; thus, there is no clear indication of non-normality of experimental results.
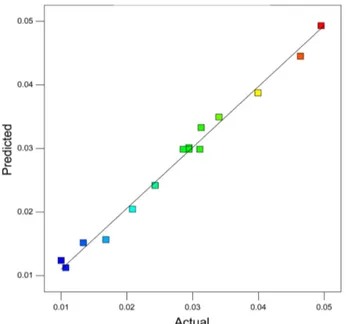
Actual value versus predicted value displays the real
responses data plotted against the predicted response is shown in Fig. 5. The predicted response values slightly deviated from the experimental data.
Fitting of the data to various models (linear, two fac- torial, quadratic and cubic) and their subsequent ANOVA showed that reaction rate of FTS was most suitably described with quadratic polynomial model. Using 10, 5, and 1% signif- icance levels, a model is considered significant if the p-value (significance probability value) is less than 0.1, 0.05, and 0.001, respectively. From the p-values presented in Table 6, Table 4. Analysis of variance (ANOVA) for the FTS
Source DFa SSb MSc F-value R2 R2adj
Model 9 1.757E-003 1.952E-004 56.39 0.9902 0.9727
Residual 5 1.731E-005 3.462E-006
aDF: degree of freedom.
bSS: sum of squares.
cMS: mean square.
Table 5. Quadratic model for FTS in terms of coded and actual factors
Regression equations
Analysis in coded factor (X1, X2, X3)
R = + 0.030 + 0.004981 X1+0.014 X2+ 0.002084X3+ 0.002836X1X2
+ 0.0002619X1X3+ 0.0007222X2X3− 0.00135X12− 0.001082X22
− 0.001032X32
Analysis in actual factor (T, PCO, PH2)
R = −0.76239 + 0.0031854T − 0.054614PCO− 0.0016895PH2
+ 0.0001487T PCO+ 0.00001373T PH2+ 0.0008POCPH2− 0.0000033T2 − 0.00119865PCO2
− 0.0011439PH 2 2
Figure 4. Normal probability plot of the studentized residuals for reaction rate of FTS.
it can be concluded that for rate of CO consumption in FTS, linear contribution and cross-product contribution of the model were significant, whereas quadratic contribution of the model was insignificant. It is observed that there are tendencies in the linear regression fit, and the model explains the experimental range studied adequately.
In Table 7, associated P-values of the model are presented.
The most significant factors of first-order (linear term) derive
from the temperature and PCO with P-value of 0.0006 and 0.0001, respectively. The last term of linear model has P- value of 0.0249 and is significant at 5%. Also the first term of cross product (T×PCO) is significant at 5% with P-value of 0.0285.
Response Surface Estimation for Reaction Rate of FTS The response can be represented graphically, either in the three-dimensional space or as contour plots that help visualize the shape of the response surface. Canonical analysis using design expert7@ package is available to locate the stationary point of the response surface, and to decide whether it describes a maximum, minimum, or saddle point. Three- dimensional (3D) and contour (2D) plots for the predicted responses were also formed, based on the model polyno- mial functions to assess the change of the response surface as shown in Figs. 6−8. The relationship between indepen- dent variables (X1, X2, X3) can be also further understood by these plots. Since the model has more than two factors, one factor was held constant for each diagram; therefore, a total of three response surface diagrams were produced.
The syngas pressure is an important catalyst screening parameter. Variation of pressure is also applied in direct- ing the FT process toward desired products. The results of FT catalyst screening at atmospheric and high pressure could yield different results. These differences could be inter- preted in terms of different concentrations of reagents in gaseous and liquid phases, catalyst restructuring and deac- tivation. In commercial process, the FTS reaction usually operates under high pressure. An increase in total pressure would generally result in condensation of hydrocarbons, which are normally in the gaseous state at atmospheric pressure. Higher pressures and higher carbon monoxide conversions would probably lead to saturation of catalyst pores by liquid reaction products.20 A different composi- tion of the liquid phase in catalyst pores at high synthesis gas pressures could affect the rate of carbon monoxide and hydrocarbon concentrations.
Temperature is a basic process variable that has a pro- found effect on the overall yield of a Fischer–Tropsch reac- tor. Temperature is normally used to control the distribution of products in the reaction, where one product may predom- inate at lower temperature and another predominates at higher temperature. The reaction temperature also has an impressive effect on the rate of CO conversion and catalytic performance of the catalysts. All reactions that take place in Fischer–Tropsch process are extremely exothermic, so temperature control is extremely necessary to ensure the reaction goes to selective products.
Figure 5. Predicted versus actual values plot for reaction rate of FTS.
Table 6. Analysis of variance for response
Source of variation F-value P-value
Linear contribution 96.6 0.0001***
Cross-Product Contribution 3.04 0.0930*
Quadratic Contribution 1.26 0.3835
*significant at 10% (p-value); **Significant at 5% (P-value); and
***significant at 1% (p-value)
Table 7. Associated p-values for response
Relationship Factor P-value
Main effects
Linear T 0.0006***
Linear PCO 0.0001***
Linear PH2 0.0249**
Interaction
Cross product
T × PCO 0.0285**
T × PH2 0.7896 PCO × PH2 0.4727
Pure quadratic
T 0.222
PCO2 0.3147 PH2
2 0.3351
*significant at 10% (p-value); **Significant at 5% (P-value); and
***significant at 1% (p-value)
As shown in Fig. 6, the effects of PCO and temperature on the response was plotted where PH2 was held constant at 1.85 bar. As can be seen, the interaction effect between the variables PCO and temperature is obvious from both the 3−D response surface and the contour-line plots. The increase of PCO leads to an increase of the reaction rate especially for higher temperature. For example, at the temperature of 503.15 K, the increase of the PCO leads to an enhancement of the reaction rate from 18.4×10⁻³ (mol gcat−1 min−1) to more than 43.15×10⁻³ (mol gcat−1 min−1). For lower tem- perature 463.15 K, increase in PCO can only increase the consumption rate of CO from 18.4×10⁻³ to 30.77×10⁻³
mol gcat−1 min−1. Furthermore, the temperature effect on the reaction rate of FTS has been increased by increasing pres- sure of CO from 0.9 to 2.8 bar.
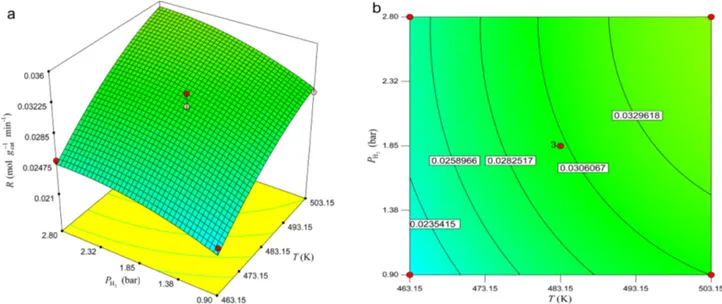
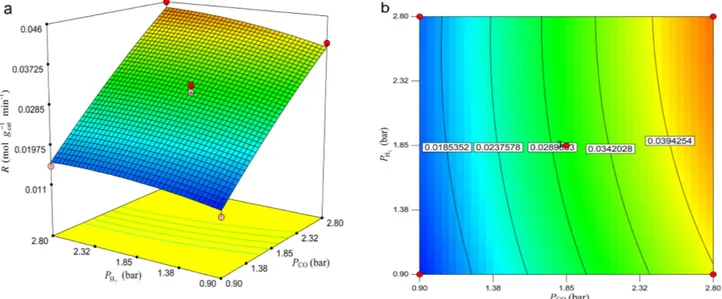
Fig. 7 shows the reaction rate as a function of temper- ature and PH2 for fixed values of PCO at 1.85 bar. The increase of temperature from 463.15 K to 503.15 K increase the rate of CO conversion, while the increase of PH2 leads only to a slight increase of the reaction rate An increase in the reaction rate in the FTS with respect to the increase in the temperature and pressure has been cited in literature.21−27 In Fig. 8 the response surface and contour plots reveal the negligible interaction effects of the PH2 and PCO on the Figure 6. Response surface and contour plots of the reaction rate as a function of T (K) and PCO (bar) for PH2=1.85 bar.
Figure 7. Response surface and contour plots of the reaction rate as a function of T (K) and PH2 (bar) for PCO= 1.85 bar.
reaction rate. As it is expected, the response surface plot indicates that the rate of reaction increases with PCO and within the tested range the effect of PH2 on the rate of reac- tion is less than that of PCO. It should be pointed out that the interaction effect between PCO and PH2 is insignificant which is obtained earlier in Table 7.
Malek Abbaslou et al.28 reported that as the pressure increases, the supercritical media exhibits a liquid-like density, which can enhance extraction from the catalyst pores. This phenomenon helps CO and H2 adsorption onto active sites thereby increasing rate of CO conversion. It was also reported that the rate of different reactions of FTS that occur on the catalyst surface is strongly influenced by the reaction temperature. Similar to our results work, it has been reported that increasing the CO conversion is due to the enhanced concentration of active surface carbon spe- cies with increasing pressure and the improved collision probability of the catalysts and reactants. Thus the rate of reaction is enhanced.29
CONCLUSIONS
Design of experiments and response surface method- ology (RSM) were applied to develop quadratic model for reaction rate of FTS applied for the conversion of syngas into a wide spectrum of hydrocarbons. Based on experimental results, an empirical relationship between the response (reaction rate) and independent variables (temperature and the partial pressures of H2 and CO) was attained and expressed by the second-order polynomial equation. The
investigating of these operational variables on reaction rate of FTS showed that the reaction conditions extremely influenced the rate of CO consumption. Effect of exper- imental parameters on the rate of CO consumption in FTS was established by the response surface and contour plots of the model-predicted responses. Temperature and par- tial pressure of CO played a significant role as well. The results showed that the reaction rate was increased with increasing the temperature and pressure. Analysis of variance showed a high coefficient of determination value (R2=0.9902), thus ensuring a satisfactory adjustment of the second-order regression model with the experimental data. The response surface model was statistically validated by ANOVA.
Acknowledgments. The publication cost of this paper was supported by the Korean Chemical Society.
REFERENCES
1. Mansouri, M.; Atashi, H.; Mirzaei, A. A.; Jangi, R. Int. J.
Ind. Chem. 2013, 4, 1.
2. Tihay, F.; Roger, A. C.; Kiennemann, A.; Pourroy, G. Catal.
Today 2000, 58, 263.
3. Barrault, J.; Forquy, C.; Perrichon, V. Appl. Catal. A: Gen- eral. 1983, 5, 119.
4. Barrault, J.; Forguy, C.; Menezo, J.; Maurel, R. Reac.
Kinet. Catal. Lett. 1981, 17, 373.
5. Mirzaei, A. A.; Faizi, M.; Habibpour, R. Appl. Catal. A:
General 2006, 306, 98.
6. Jafarzadeh, N. K.; Sharifnia, S.; Hosseini, S. N.; Rahim- pour, F. Korean J. Chem. Eng. 2011, 28, 531.
7. Malleswara, T. V.; Vico-Ruiz, E.; Banares, M. A.; Deo, G.
Figure 8. Response surface and contour plots of the reaction rate as a function of PCO (bar) and PH2 (bar) for T = 483.15 K.
J. Catal. 2007, 258, 324.
8. Elavarasan, P.; Kondamudi, K.; Upadhyayule, S. Chem.
Eng. J. 2009, 155, 355.
9. Mafi Gholami, R.; Mousavi, S. M.; Borghei, S. M. J. Ind.
Eng. Chem. 2012, 18, 218.
10. Calemma, V. Catal. Today 2005, 106, 282.
11. Farias, F. E. M.; Sales, F. G.; Fernandes, F. A. N. J. Nat.
Gas Chem. 2008, 17, 175
12. Shahrezaei, F.; Mansouri, Y.; Zinatizadeh, A. A. L.; Akh- bari, A. Powder Technol. 2012, 221, 203.
13. Shafeeyan, M. S.; Daud, W. M. A. W.; Houshmand, A.;
Arami-Niya, A. Fuel 2012, 94, 465.
14. Monyanon, S.; Luengnaruemitchai, A.; Pongstabodee, S.
Fuel Process. Technol. 2012, 96, 160.
15. Hariharan, N. M.; Sivashanmugam, M.; Kasthurrirengan, S. J. Hydrodynamics 2013, 25, 72.
16. García-Vargas, J. M.; Valverde, J. L.; de Lucas-Consuegra, A.; Gómez-Monedero, B.; Dorado, F.; Sánchez, P. Int. J.
Hydrogen Energy 2013, 38, 4524.
17. Mansouri, M.; Atashi, H.; Farshchi Tabrizi F.;, Mirzaei, A. A.; mansouri, G. J. Ind. Eng. Chem. 2013, 19, 1177.
18. Montgomery, D. C. Design and Analysis of Experiments,
5th ed.; John Wiley & Sons: New York, 2001.
19. Myers, R. H.; Montgomery, D. C. Response Surface Method- ology: Process and Product Optimization Using Designed Experiments, 2nd ed.; John Wiley & Sons: New York, 2002.
20. Gribval-Constant, A.; Khodakov, A. Y.; Bechara, R.;
Zholobenko, V. L. Stud. Surf. Sci. Catal. 2002, 144, 609.
21. Atashi, H.; Siami, F.; Mirzaei, A. A.; Sarkari, M. J. Ind.
Eng. Chem. 2010, 16, 952.
22. Mirzaei, A. A.; Shirzadi, B.; Atashi, H.; Mansouri, M. J.
Ind. Eng. Chem. 2012, 18, 1515.
23. Fazlollahi, F.; Sarkari, M.; Zare, A.; Mirzaei, A. A.; Atashi, H. J. Ind. Eng. Chem. 2012, 18, 1223.
24. Yates, I. C.; Satterfield, C. N. Energy Fuels 1991, 5, 168.
25. van Steen, E.; Schulz, H. Appl. Catal. A: General 1999, 186, 309.
26. Ngwenya, T.; Glasser, D.; Hildebrandt, D.; Coville, N.;
Mukoma, P. Ind. Eng. Chem. Res. 2005, 44, 5987.
27. Rautavuoma, A.; van der Baan, H. Appl. Catal. 1981, 1, 247.
28. Malek Abbaslou, R. M.; Slotan Mohammadzadeh, J. S.;
Dalai, A. K. Fuel Process. Tech. 2009, 90, 849.
29. Liu, Y.; et al. J. Mol. Catal. A: Chem. 2007, 272, 182.