Relation between Anemia and Vulnerable Coronary Plaque
Components in Patients with Acute Coronary Syndrome: Virtual Histology-Intravascular Ultrasound Analysis
The aim of the present study was to evaluate the plaque components and the predictors of thin-cap fibroatheroma (TCFA) in anemic patients with acute coronary syndrome using virtual histology-intravascular ultrasound (VH-IVUS). Anemia was defined according to criteria of the World Health Organization, (i.e., hemoglobin levels < 13 g/dL in men and
< 12 g/dL in women) and we compared VH-IVUS findings between anemia group (171 patients, 260 lesions) and non-anemia group (569 patients, 881 lesions). Anemia group had greater % necrotic core (NC) volume (21% ± 9% vs 19% ± 9%, P = 0.001) compared with non-anemia group. Hemoglobin level correlated negatively with absolute NC volume (r = -0.235, P < 0.001) and %NC volume (r = -0.209, P < 0.001). Independent predictors of TCFA by multivariate analysis were diabetes mellitus (odds ratio [OR], 2.213; 95%
confidence interval [CI], 1.403-3.612, P = 0.006), high-sensitivity C-reactive protein (OR, 1.143; 95% CI, 1.058-1.304, P = 0.012), microalbuminuria (albumin levels of 30 to 300 mg/g of creatinine) (OR, 2.124; 95% CI, 1.041-3.214, P = 0.018), and anemia (OR: 2.112;
95% CI 1.022-3.208, P = 0.028). VH-IVUS analysis demonstrates that anemia at the time of clinical presentation is associated with vulnerable plaque component in patients with acute coronary syndrome.
Key Words: Acute Coronary Syndrome; Plaque; Anemia; Intravascular Ultrasound Young Joon Hong, Myung Ho Jeong,
Yun Ha Choi, Jin A Song, Dong Han Kim, Ki Hong Lee, Futoshi Yamanaka, Min Goo Lee, Keun Ho Park, Doo Sun Sim, Nam Sik Yoon, Hyun Ju Yoon, Kye Hun Kim, Hyung Wook Park, Ju Han Kim, Youngkeun Ahn, Jeong Gwan Cho, Jong Chun Park, and Jung Chaee Kang Heart Research Center, Chonnam National University Hospital, Gwangju, Korea Received: 31 October 2011 Accepted: 26 January 2012 Address for Correspondence:
Myung Ho Jeong, MD
Principal Investigator of Korea Acute Myocardial Infarction Registry, Director of Heart Research Center Nominated by Korea Ministry of Health and Welfare, Chonnam National University Hospital, 671 Jaebong-ro, Dong-gu, Gwangju 501-757, Korea Tel: +82.62-220-6243, Fax: +82.62-228-7174
E-mail: [email protected]
This study was supported by a grant of the Korea Healthcare Technology R&D project (A084869), Ministry of Health, Welfare
& Family Affairs, Republic of Korea.
http://dx.doi.org/10.3346/jkms.2012.27.4.370 • J Korean Med Sci 2012; 27: 370-376
INTRODUCTION
The incidence of anemia is relatively high in patients with coro- nary artery disease. Anemia is a cardiovascular risk factor in the general population (1), and was found to be associated with a significantly higher rate of cardiovascular events in patients with acute coronary syndrome (ACS) (2-4), heart failure (4, 5), in pa- tients undergoing percutaneous coronary intervention (6, 7), and in patients undergoing coronary artery bypass graft surgery (8). Therefore, there is a possibility that anemia is associated with both development/progression of coronary atherosclero- sis and coronary plaque vulnerability.
However, no study has examined the relation between ane- mia at the time of clinical presentation and coronary plaque characteristics in patients with ACS. Therefore, the purpose of the present study was to attempt to compare grey-scale and vir- tual histology-intravascular ultrasound (VH-IVUS) findings be- tween patients with anemia and those without anemia at the time of clinical presentation of ACS.
MATERIALS AND METHODS Patient population
We reviewed 740 consecutive patients with ACS who underwent grey-scale and VH-IVUS between January 2007 and September 2010. Anemia was defined according to criteria of the World Health Organization (i.e., hemoglobin levels < 13 g/dL in men and < 12 g/dL in women) (9). We compared baseline charac- teristics, coronary angiographic findings, and grey-scale and VH- IVUS findings between anemia group (171 patients, 260 lesions) and non-anemia group (569 patients, 881 lesions). The presence of unstable angina was determined by chest pain within the pre- ceding 72 hr with or without ST–T-wave changes or positive car- diac biochemical markers (creatine kinase-myocardial band or cardiac specific troponin-I). The presence of ST-segment eleva- tion myocardial infarction was determined by > 30 min of con- tinuous chest pain, a new ST-segment elevation ≥ 2 mm on at least 2 contiguous electrocardiographic leads, and creatine ki- nase-myocardial band (MB) or cardiac-specific troponin I above
2 times of normal. The presence of non–ST-segment elevation myocardial infarction was diagnosed by chest pain and positive cardiac biochemical markers (creatine kinase-myocardial band or cardiac-specific troponin I) without new ST-segment eleva- tion. Hypercholesterolemia was diagnosed in patients who re- ceived lipid-lowering medication or had a history of a low-den- sity lipoprotein level > 130 mg/dL. Heart failure was defined as the presence of previous clinical signs and symptoms of pulmo- nary venous congestion or previous evidence of systolic dysfunc- tion (left ventricular ejection fraction < 50%) on echocardio- gram. We excluded patients with subacute or late stent throm- bosis, totally occluded lesions, restenosis after stenting, coro- nary artery bypass graft failure, severe heart failure or cardio- genic shock, important systemic disease, or serum creatinine
> 2.5 mg/dL, and patients in whom adequate IVUS images could not be obtained. Hospital records of all patients were reviewed to obtain clinical demographics and medical history.
Laboratory analysis
Peripheral blood samples were obtained before coronary angi- ography using direct venipuncture. The blood samples were centrifuged, and serum was removed and stored at -70°C until the assay could be performed. Absolute creatine kinase-MB levels were determined by radioimmunoassay (Dade Behring Inc., Miami, FL, USA). Cardiac-specific troponin I levels were measured by a paramagnetic particle, chemiluminescent im- munoenzymatic assay (Beckman, Coulter Inc., Fullerton, CA, USA). The serum levels of total cholesterol, triglyceride, low-den- sity lipoprotein cholesterol, and high-density lipoprotein cho- lesterol were measured by standard enzymatic methods. High- sensitivity C-reactive protein was analyzed turbidimetrically with sheep antibodies against human C-reactive protein; this has been validated against the Dade-Behring method (10). A ran- dom morning urine specimen was obtained. Urine creatinine and albumin were measured on a Kodak Ektachem 700 Ana- lyzer and Beckman Array 360 CE protein Analyzer (Beckman Instruments, Fullerton, CA, USA), respectively. Patients with al- bumin levels of 30 to 300 mg/g of creatinine were defined as having microalbuminuria (11).
Coronary angiographic findings
Coronary angiogram was analyzed with validated QCA system (Phillips H5000 or Allura DCI program, Philips Medical Systems, the Netherlands). With the outer diameter of the contrast-filled catheter as the calibration standard, the reference diameter and minimal lumen diameter were measured in diastolic frames from orthogonal projections. Perfusion was evaluated accord- ing to thrombolysis in myocardial infarction (TIMI) criteria (12).
Gray-scale and VH-IVUS imaging and analysis
All IVUS examinations were performed after intracoronary ad-
ministration of 300 µg nitroglycerin using a commercially avail- able IVUS system (Volcano Corp, Rancho Cordova, CA, USA).
The IVUS catheter was advanced distal to the target lesion, and imaging was performed retrograde to the aorto-ostial junction at an automatic pullback speed of 0.5 mm/sec. In case of total occlusion, we opened the occluded artery by thrombus aspira- tion or balloon angioplasty using small balloon.
Gray-scale IVUS and VH-IVUS data were analyzed by 2 inde- pendent observers. The levels of reproducibility for external elastic membrane (EEM), lumen, and plaque plus media (P&M) cross-sectional areas (CSAs) using the Spearman rank-order correlation coefficients were 0.96, 0.97, and 0.97, respectively.
Similarly, for plaque components by VH-IVUS, reproducibility for the fibrous (FT), fibro-fatty (FF), dense calcium (DC), and necrotic core (NC) volume measurements using the Spearman rank-order correlation coefficients were 0.93, 0.94, 0.93, and 0.93, respectively.
Quantitative volumetric gray-scale and VH-IVUS analyses were performed across the entire lesion segment, and cross-sec- tional analyses were performed at the minimum lumen sites and at the largest NC sites. Conventional quantitative volumetric gray-scale IVUS analysis was performed according to the Amer- ican College of Cardiology Clinical Expert Consensus Document on Standards for Acquisition, Measurement and Reporting of Intravascular Ultrasound Studies (13). Measurements were made by every 1-mm interval for the region of interest, which was de- fined as the segment between distal to proximal reference sites that were the most normal looking within 5 mm proximal and distal to the lesion. References were the single slices with the largest lumen and smallest plaque CSAs within 10 mm proxi- mally and distally. Hypoechoic plaque was less bright than the adventitia, hyperechoic noncalcified plaque was as bright as or brighter than the adventitia without acoustic shadowing, and hyperechoic calcified plaque was brighter than the adventitia with acoustic shadowing. When there was no dominant plaque composition, the plaque was classified as mixed.
Volumetric data were generated by the software using Simp- son’s method. EEM and lumen CSAs were measured. P&M CSA was calculated as EEM minus lumen CSA; and plaque burden was calculated as P&M divided by EEM CSA. VH-IVUS analysis classified the color-coded tissue into four major components:
green (FT); yellow-green (FF); white (DC); and red (NC) (14-17).
VH-IVUS analysis was reported as a percentage of plaque area or volume. We defined thin-cap fibroatheroma (TCFA) as a NC
≥ 10% of plaque area in at least 3 consecutive frames without overlying fibrous tissue in the presence of ≥ 40% plaque bur- den (15).
Statistical analysis
The statistical Package for Social Sciences (SPSS) for Windows, version 15.0 (Chicago, IL, USA) was used for all analyses. Con-
tinuous variables were presented as the mean ± SD; compari- sons were conducted by Student’s t-test or nonparametric Wil- coxon test if normality assumption was violated. Discrete vari- ables were presented as percentages and relative frequencies;
comparisons were conducted by chi-square statistics or Fisher’s exact test as appropriate. Pearson’s correlation coefficient was used to evaluate the associations between baseline hemoglobin level and each plaque components. Multivariate analysis was performed to determine the independent predictors of TCFA. A P value < 0.05 was considered statistically significant.
Ethics statement
The study protocol was reviewed and approved by the institu- tional review board of Chonnam National University Hospital
(1-2009-07-082). Informed consent was waived by the board.
RESULTS
Baseline characteristics and laboratory findings
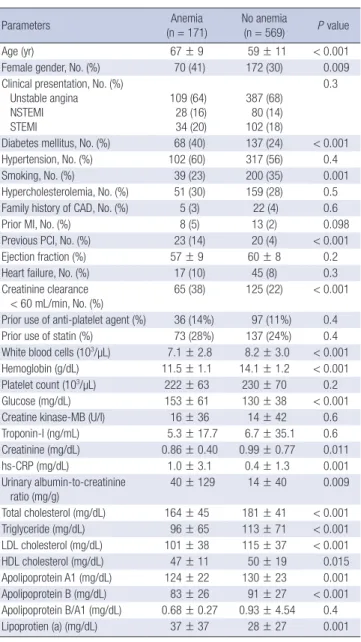
The baseline characteristics are summarized in Table 1. Patients with anemia were significantly older, were more females, and were more diabetics and were less smokers, and had more his- tory of previous coronary intervention compared with those without anemia. Glucose level, high-sensitivity C-reactive pro- tein, and urinary albumin-to-creatinine ratio were significantly higher in patients with anemia compared with those without anemia. Anemia group had significantly lower low-density lipo- protein cholesterol and apolipoprotein B levels compared with non-anemia group.
Coronary angiographic findings
Angiographic findings are summarized in Table 2. Type B2/C lesions and multi-vessel diseases were observed more frequent- ly and lesion length was significantly longer in patients with ane- mia compared with those without anemia. There were no sig- nificant differences in the target vessel, TIMI flow grade, mini- mal lumen diameter, and percent diameter stenosis between both groups.
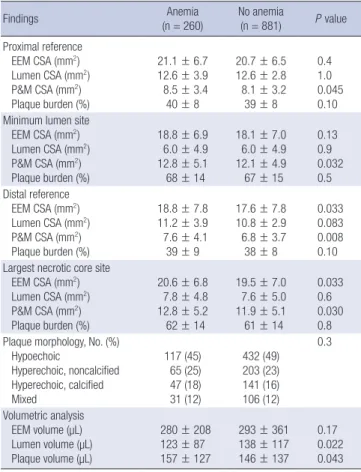
Gray-scale IVUS results
Gray-scale IVUS results are summarized in Table 3. P&M CSAs were significantly greater at the proximal and distal references and at the minimum lumen site and at the largest NC site in pa- tients with anemia compared with those without anemia. EEM Table 1. Baseline characteristics
Parameters Anemia
(n = 171) No anemia
(n = 569) P value
Age (yr) 67 ± 9 59 ± 11 < 0.001
Female gender, No. (%) 70 (41) 172 (30) 0.009
Clinical presentation, No. (%) Unstable angina
NSTEMI STEMI
109 (64) 28 (16) 34 (20)
387 (68) 80 (14) 102 (18)
0.3
Diabetes mellitus, No. (%) 68 (40) 137 (24) < 0.001
Hypertension, No. (%) 102 (60) 317 (56) 0.4
Smoking, No. (%) 39 (23) 200 (35) 0.001
Hypercholesterolemia, No. (%) 51 (30) 159 (28) 0.5 Family history of CAD, No. (%) 5 (3) 22 (4) 0.6
Prior MI, No. (%) 8 (5) 13 (2) 0.098
Previous PCI, No. (%) 23 (14) 20 (4) < 0.001
Ejection fraction (%) 57 ± 9 60 ± 8 0.2
Heart failure, No. (%) 17 (10) 45 (8) 0.3
Creatinine clearance < 60 mL/min, No. (%)
65 (38) 125 (22) < 0.001 Prior use of anti-platelet agent (%) 36 (14%) 97 (11%) 0.4 Prior use of statin (%) 73 (28%) 137 (24%) 0.4 White blood cells (103/µL) 7.1 ± 2.8 8.2 ± 3.0 < 0.001 Hemoglobin (g/dL) 11.5 ± 1.1 14.1 ± 1.2 < 0.001 Platelet count (103/µL) 222 ± 63 230 ± 70 0.2
Glucose (mg/dL) 153 ± 61 130 ± 38 < 0.001
Creatine kinase-MB (U/l) 16 ± 36 14 ± 42 0.6 Troponin-I (ng/mL) 5.3 ± 17.7 6.7 ± 35.1 0.6 Creatinine (mg/dL) 0.86 ± 0.40 0.99 ± 0.77 0.011
hs-CRP (mg/dL) 1.0 ± 3.1 0.4 ± 1.3 0.001
Urinary albumin-to-creatinine ratio (mg/g)
40 ± 129 14 ± 40 0.009 Total cholesterol (mg/dL) 164 ± 45 181 ± 41 < 0.001 Triglyceride (mg/dL) 96 ± 65 113 ± 71 < 0.001 LDL cholesterol (mg/dL) 101 ± 38 115 ± 37 < 0.001 HDL cholesterol (mg/dL) 47 ± 11 50 ± 19 0.015 Apolipoprotein A1 (mg/dL) 124 ± 22 130 ± 23 0.001 Apolipoprotein B (mg/dL) 83 ± 26 91 ± 27 < 0.001 Apolipoprotein B/A1 (mg/dL) 0.68 ± 0.27 0.93 ± 4.54 0.4 Lipoprotien (a) (mg/dL) 37 ± 37 28 ± 27 0.001 Data are No. (%), or mean ± SD. NSTEMI, non-ST segment elevation myocardial in- farction; STEMI, ST segment elevation myocardial infarction; CAD, coronary artery disease; PCI, percutaneous coronary intervention; hs-CRP, high-sensitivity C-reactive protein; LDL, low-density lipoprotein; HDL, high-density lipoprotein.
Table 2. Coronary angiographic findings Angiographic findings Anemia
(n = 260) No anemia
(n = 881) P value Target vessel, No. (%)
Left main
Left anterior descending Left circumflex Right
13 (5) 143 (55) 36 (14) 68 (26)
44 (5) 485 (55) 159 (18) 193 (22)
0.4
ACC/AHA lesion type, No. (%) A
B1
B2
C
13 (5) 73 (28) 122 (47) 52 (20)
44 (5) 414 (47) 326 (37) 97 (11)
0.014
Multivessel disease, No. (%) 182 (70) 458 (52) 0.004 TIMI flow grade, No. (%)
0 1 2 3
23 (9) 16 (6) 57 (22) 164 (63)
89 (10) 44 (5) 175 (20) 573 (65)
0.5
Lesion length (mm) 18 ± 10 14 ± 7 0.021 Reference diameter (mm) 3.24 ± 0.47 3.21 ± 0.58 0.5 Minimal lumen diameter (mm) 1.20 ± 0.45 1.19 ± 0.60 0.8
Diameter stenosis (%) 63 ± 14 63 ± 16 0.9
Data are No. (%), or mean ± SD. ACC/AHA, American College of Cardiology/Ameri- can Heart Association; TIMI, Thrombolysis In Myocardial Infarction.
CSAs were significantly greater at the distal references and at the largest NC site in patients with anemia compared with those without anemia. By volumetric analysis, anemia group had great- er plaque volume and smaller lumen volume compared with non-anemia group.
VH-IVUS results
At the minimum lumen site, absolute NC and DC areas were sig-
nificantly greater and %NC area was significantly greater in pa- tients with anemia compared with those without anemia (Fig. 1).
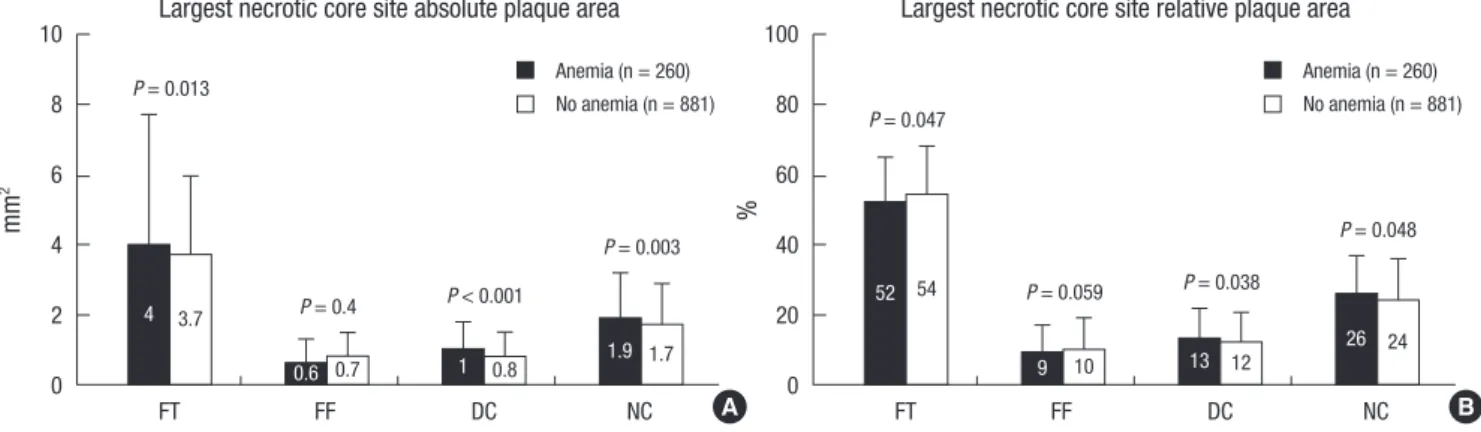
At the largest NC site, absolute NC, DC, and FT areas were significantly greater, and %NC and DC areas were significantly greater in patients with anemia compared with those without anemia; conversely %FT area was significantly smaller in patients with anemia compared with those without anemia (Fig. 2).
Absolute NC and DC volumes were significantly greater, and absolute FT and FF volumes were significantly smaller in pa- tients with anemia compared with those without anemia; and
%NC and DC volumes were significantly greater; and %FT and FF volumes were significantly smaller in patients with anemia compared with those without anemia (Fig. 3). TCFA was ob- served more frequently in patients with anemia compared with those without anemia (47% vs 35%, P < 0.001).
Correlations between hemoglobin levels and plaque components
Hemoglobin level correlated negatively with absolute NC vol- ume (r = -0.235, P < 0.001), %NC volume (r = -0.209, P < 0.001), absolute DC volume (r = -0.211, P < 0.001), %DC volume (r = -0.193, P < 0.001), and correlated positively with absolute FT volume (r = 0.205, P = 0.001), %FT volume (r = 0.164, P = 0.001), absolute FF volume (r = 0.187, P = 0.001), and %FF volume (r = 0.134, P < 0.001).
Independent predictors of TCFA
Multivariate analysis was performed to identify independent predictors of TCFA. The following variables were tested (all with P < 0.2 in univariate analysis) including microalbuminuria, age, male gender, diabetes mellitus, hypertension, smoking, ejection fraction, anemia, high-sensitivity C-reactive protein, and mini- mum lumen site plaque burden (all with P < 0.2 in univariable analysis). Independent predictors of TCFA included diabetes mellitus (odds ratio [OR], 2.213; 95% confidence interval [CI], 1.403-3.612, P = 0.006), high-sensitivity C-reactive protein (OR, Table 3. Gray-scale intravascular ultrasound findings
Findings Anemia
(n = 260) No anemia
(n = 881) P value Proximal reference
EEM CSA (mm2) Lumen CSA (mm2) P&M CSA (mm2) Plaque burden (%)
21.1 ± 6.7 12.6 ± 3.9 8.5 ± 3.4 40 ± 8
20.7 ± 6.5 12.6 ± 2.8 8.1 ± 3.2 39 ± 8
0.4 1.0 0.045 0.10 Minimum lumen site
EEM CSA (mm2) Lumen CSA (mm2) P&M CSA (mm2) Plaque burden (%)
18.8 ± 6.9 6.0 ± 4.9 12.8 ± 5.1 68 ± 14
18.1 ± 7.0 6.0 ± 4.9 12.1 ± 4.9 67 ± 15
0.13 0.9 0.032 0.5 Distal reference
EEM CSA (mm2) Lumen CSA (mm2) P&M CSA (mm2) Plaque burden (%)
18.8 ± 7.8 11.2 ± 3.9 7.6 ± 4.1 39 ± 9
17.6 ± 7.8 10.8 ± 2.9 6.8 ± 3.7 38 ± 8
0.033 0.083 0.008 0.10 Largest necrotic core site
EEM CSA (mm2) Lumen CSA (mm2) P&M CSA (mm2) Plaque burden (%)
20.6 ± 6.8 7.8 ± 4.8 12.8 ± 5.2 62 ± 14
19.5 ± 7.0 7.6 ± 5.0 11.9 ± 5.1 61 ± 14
0.033 0.6 0.030 0.8 Plaque morphology, No. (%)
Hypoechoic
Hyperechoic, noncalcified Hyperechoic, calcified Mixed
117 (45) 65 (25) 47 (18) 31 (12)
432 (49) 203 (23) 141 (16) 106 (12)
0.3
Volumetric analysis EEM volume (µL) Lumen volume (µL) Plaque volume (µL)
280 ± 208 123 ± 87 157 ± 127
293 ± 361 138 ± 117 146 ± 137
0.17 0.022 0.043 Data are No. (%), or mean ± SD. EEM, external elastic membrane; CSA, cross-sec- tional area; P&M, plaque plus media.
mm2 %
FT FF DC NC FT FF DC NC
10
8
6
4
2
0
100
80
60
40
20
0 4
59
0.8 0.6 1.2 12 10 18
P = 0.16
P = 0.10
P = 0.4 P = 0.2
P = 0.001 P = 0.001 P = 0.10 P = 0.033
4.2
58
0.8 0.8 1.5 11 11 20
Minimum lumen site absolute plaque area Minimum lumen site relative plaque area
A B
Fig. 1. Plaque component analysis according to the presence or absence of anemia at the minimum lumen sites. Results are displayed for (A) absolute and (B) relative quantifi- cations. FT, fibrotic; FF, fibro-fatty; DC, dense calcium; NC, necrotic core.
Anemia (n = 260) No anemia (n = 881)
Anemia (n = 260) No anemia (n = 881)
1.143; 95% CI, 1.058-1.304, P = 0.012), microalbuminuria (albu- min levels of 30 to 300 mg/g of creatinine) (OR, 2.124; 95% CI, 1.041-3.214, P = 0.018), and anemia (OR, 2.112; 95% CI, 1.022- 3.208, P = 0.028).
DISCUSSION
The present VH-IVUS study demonstrated that 1) patients with anemia had greater NC and DC components and had more TCFAs compared with those without anemia, 2) baseline he- moglobin level correlated negatively with NC and DC compo- nents and correlated positively with FT and FF components, and 3) anemia was the independent predictor of TCFA in pa- tients with ACS.
Previous pathological studies have demonstrated that plaque rupture and subsequent thrombus formation is the most impor- tant mechanism leading to an ACS (18, 19). Plaque components may play a pivotal role in the plaque disruption and thrombosis that leads to acute coronary events (20-22). Several VH-IVUS studies have reported that ACS patients had more NC-contain- ing lesions compared with stable angina patients (15, 23). In the present study which enrolled patients with ACS, mean %NC
volume was about 21% and the proportion of patients with %NC volume > 20% was 53% of total patient population. Lesions with a large lipid core may have a higher risk for disruption than scle- rotic plaques (24-26).
Anemia is present in 15%-30% of patients with ACS, and it adversely affects the outcomes of ACS (2-4). Anemia has the potential to worsen the myocardial ischemic insult in ACS, both by decreasing the oxygen delivery to myocardium downstream of coronary stenosis and by increasing myocardial oxygen de- mand through necessitating a higher stroke volume and heart rate to maintain adequate systemic oxygen delivery. The com- bination of these processes may explain the pathophysiology of poor clinical outcomes in patients with ACS with lower hemo- globin levels (2).
The significance of anemia in ACS has been focused on the significance of hemorrhagic complications during the treatment of ACS and on the prognostic significance of transfusions (27- 29). No special attention has been devoted to the significance of anemia on its’ relation to plaque characteristics in patients with ACS. In the present study, patients with anemia had great- er plaque burden compared with those without anemia, and NC components were significantly greater, and TCFAs were ob-
mm2 %
FT FF DC NC FT FF DC NC
10
8
6
4
2
0
100
80
60
40
20
0 3.7
54
0.7 0.8 1.7 10 12 24
P = 0.013
P = 0.047
P = 0.4 P < 0.001 P = 0.059 P = 0.038
P = 0.003 P = 0.048
4 52
0.6 1 1.9 9 13 26
Largest necrotic core site absolute plaque area Largest necrotic core site relative plaque area
A B
Fig. 2. Plaque component analysis according to the presence or absence of anemia at the largest necrotic core sites. Results are displayed for (A) absolute and (B) relative quantifications. FT, fibrotic; FF, fibro-fatty; DC, dense calcium; NC, necrotic core.
Anemia (n = 260) No anemia (n = 881)
Anemia (n = 260) No anemia (n = 881)
µL %
FT FF DC NC FT FF DC NC
120 100 80 60 40 20 0
100
80
60
40
20
0
58 57
15 10 19 15 10 19
P = 0.013
P = 0.008
P = 0.023 P = 0.002 P = 0.004 P = 0.002
P = 0.001
P = 0.001
56 54
14 12 22 13 12 21
Absolute plaque volume Relative plaque volume
A B
Fig. 3. Volumetric plaque component analysis according to the presence or absence of anemia. Results are displayed for (A) absolute and (B) relative quantifications. FT, fibrot- ic; FF, fibro-fatty; DC, dense calcium; NC, necrotic core.
Anemia (n = 260) No anemia (n = 881)
Anemia (n = 260) No anemia (n = 881)
served more frequently in patients with anemia compared with those without anemia, and anemia was the independent pre- dictor of TCFA. There are several postulated mechanisms that low hemoglobin levels are related to the development and pro- gression of atherosclerosis and to the plaque vulnerability in patients with ACS. Anemia may worsen arterial intima-media thickening, and activate the sympathetic nervous system and renin-angiotensin-aldosterone axis, and impair oxygen carry- ing capacity and enhance levels of proinflammatory cytokines (30). Especially, anemia is associated with underlying inflam- matory processes, so it is likely that patients with low hemoglo- bin levels might be more at risk of developing atherosclerosis and may affect the plaque vulnerability in patients with ACS.
There are several limitations to be mentioned. First, the anal- yses were retrospective and are subject to limitations inherent in this type of clinical investigation. Second, gray-scale and VH- IVUS imaging were performed at the discretion of the individu- al operators, leading to potential selection bias. Third, we did not attempt to differentiate between atherosclerotic plaque and thrombus because IVUS could not determine the presence of thrombus. This may obscure the identification of TCFA. Fourth, heavily calcified plaques may induce an artifact regarding the codification of plaques by VH-IVUS resulting in an increase in NC content. This remains a potential limitation of the present VH study. Fifth, nature of anemia (acute or chronic, causes of anemia, etc) was not evaluated in the present study. Sixth, pa- tients with anemia had more comorbidities (more elderly pa- tients, more females, more diabetics, higher high-sensitivity C- reactive protein, higher microalbuminuria, and so on) compared with those without anemia in the present study. Therefore, these more comorbidities may affect more vulnerable plaque charac- teristics in patients with anemia. However, in the present study, anemia itself was an independent predictor of large NC-contain- ing plaque by multivariate analysis. So, it may be important to recognize hemoglobin as an indicator of plaque vulnerability.
In conclusion, anemia at the time of clinical presentation of ACS is associated with large plaque burden and vulnerable plaque characteristics in patients with ACS. Therefore, intensive medi- cal therapies like high-dose statins may be needed for plaque regression and stabilization in patients with ACS who accom- panies with anemia.
REFERENCES
1. Sarnak MJ, Tighiouart H, Manjunath G, MacLeod B, Griffith J, Salem D, Levey AS. Anemia as a risk factor for cardiovascular disease in The Ath- erosclerosis Risk in Communities (ARIC) study. J Am Coll Cardiol 2002;
40: 27-33.
2. Sabatine MS, Morrow DA, Giugliano RP, Burton PB, Murphy SA, Mc- Cabe CH, Gibson CM, Braunwald E. Association of hemoglobin levels with clinical outcomes in acute coronary syndromes. Circulation 2005;
111: 2042-9.
3. Nikolsky E, Aymong ED, Halkin A, Grines CL, Cox DA, Garcia E, Meh- ran R, Tcheng JE, Griffin JJ, Guagliumi G, Stuckey T, Turco M, Cohen DA, Negoita M, Lansky AJ, Stone GW. Impact of anemia in patients with acute myocardial infarction undergoing primary percutaneous coronary intervention: analysis from the Controlled Abciximab and De- vice Investigation to Lower Late Angioplasty Complications (CADIL- LAC) Trial. J Am Coll Cardiol 2004; 44: 547-53.
4. Archbold RA, Balami D, Al-Hajiri A, Suliman A, Liew R, Cooper J, Ran- jadayalan K, Knight CJ, Deaner A, Timmis AD. Hemoglobin concentra- tion is an independent determinant of heart failure in acute coronary syn- dromes: cohort analysis of 2310 patients. Am Heart J 2006; 152: 1091-5.
5. Ezekowitz JA, McAlister FA, Armstrong PW. Anemia is common in heart failure and is associated with poor outcomes: insights from a cohort of 12065 patients with new-onset heart failure. Circulation 2003; 107: 223-5.
6. McKechnie RS, Smith D, Montoye C, Kline-Rogers E, O’Donnell MJ, DeFranco AC, Meengs WL, McNamara R, McGinnity JG, Patel K, Share D, Riba A, Khanal S, Moscucci M; Blue Cross Blue Shield of Michigan Cardiovascular Consortium (BMC2). Prognostic implication of anemia on in-hospital outcomes after percutaneous coronary intervention. Cir- culation 2004; 110: 271-7.
7. Lee PC, Kini AS, Ahsan C, Fisher E, Sharma SK. Anemia is an indepen- dent predictor of mortality after percutaneous coronary intervention. J Am Coll Cardiol 2004; 44: 541-6.
8. DeFoe GR, Ross CS, Olmstead EM, Surgenor SD, Fillinger MP, Groom RC, Forest RJ, Pieroni JW, Warren CS, Bogosian ME, Krumholz CF, Clark C, Clough RA, Weldner PW, Lahey SJ, Leavitt BJ, Marrin CA, Charles- worth DC, Marshall P, O’Connor GT. Lowest hematocrit on bypass and adverse outcomes associated with coronary artery bypass grafting. North- ern New England Cardiovascular Disease Study Group. Ann Thorac Surg 2001; 71: 769-76.
9. Nutritional Anaemias. Report of a WHO Scientific Group. World Health Organization Technical Report Series No. 405. Geneva: World Health Organisation, 1968. p 9-10.
10. Roberts WL, Moulton L, Law TC, Farrow G, Cooper-Anderson M, Sa- vory J, Rifai N. Evaluation of nine automated high-sensitivity C-reactive protein methods: implications for clinical and epidemiological applica- tions. Part 2. Clin Chem 2001; 47: 418-25.
11. Eknoyan G, Hostetter T, Bakris GL, Hebert L, Levey AS, Parving HH, Steffes MW, Toto R. Proteinuria and other markers of chronic kidney disease: a position statement of the National Kidney Foundation (NKF) and the National Institute of Diabetes and Digestive and Kidney diseases (NIDDK). Am J Kidney Dis 2003; 42: 617-22.
12. TIMI IIIB Investigators. Effects of tissue plasminogen activator and a comparison of early invasive and conservative strategies in unstable an- gina and non-Q-wave myocardial infarction. Results of the TIMI IIIB Tri- al. Thrombolysis in Myocardial Ischemia. Circulation 1994; 89: 1545-56.
13. Mintz GS, Nissen SE, Anderson WD, Bailey SR, Erbel R, Fitzgerald PJ, Pinto FJ, Rosenfield K, Siegel RJ, Tuzcu EM, Yock PG. American College of Cardiology clinical expert consensus document on standards for acqui- sition, measurement and reporting of intravascular ultrasound studies (IVUS): a report of the American College of Cardiology Task Force on Clin- ical Expert Consensus Documents. J Am Coll Cardiol 2001; 37: 1478-92.
14. Nair A, Kuban BD, Tuzcu EM, Schoenhagen P, Nissen SE, Vince DG.
Coronary plaque classification with intravascular ultrasound radiofre-
quency data analysis. Circulation 2002; 106: 2200-6.
15. Rodriguez-Granillo GA, García-García HM, Mc Fadden EP, Valgimigli M, Aoki J, de Feyter P, Serruys PW. In vivo intravascular ultrasound-de- rived thin-cap fibroatheroma detection using ultrasound radiofrequency data analysis. J Am Coll Cardiol 2005; 46: 2038-42.
16. Okubo M, Kawasaki M, Ishihara Y, Takeyama U, Yasuda S, Kubota T, Tanaka S, Yamaki T, Ojio S, Nishigaki K, Takemura G, Saio M, Takami T, Fujiwara H, Minatoguchi S. Tissue characterization of coronary plaques:
comparison of integrated backscatter intravascular ultrasound with vir- tual histology intravascular ultrasound. Circ J 2008; 72: 1631-9.
17. Yamamoto M, Takano M, Okamatsu K, Murakami D, Inami S, Xie Y, Seimiya K, Ohba T, Seino Y, Mizuno K. Relationship between thin cap fibroatheroma identified by virtual histology and angioscopic yellow plaque in quantitative analysis with colorimetry. Circ J 2009; 73: 497-502.
18. Davies MJ, Thomas A. Thrombosis and acute coronary-artery lesions in sudden cardiac ischemic death. N Engl J Med 1984; 310: 1137-40.
19. Farb A, Burke AP, Tang AL, Liang TY, Mannan P, Smialek J, Virmani R.
Coronary plaque erosion without rupture into a lipid core. A frequent cause of coronary thrombosis in sudden coronary death. Circulation 1996; 93: 1354-63.
20. Virmani R, Kolodgie FD, Burke AP, Farb A, Schwartz SM. Lessons from sudden coronary death: a comprehensive morphological classification scheme for atherosclerotic lesions. Arterioscler Thromb Vasc Biol 2000;
20: 1262-75.
21. Falk E, Shah PK, Fuster V. Coronary plaque disruption. Circulation 1995;
92: 657-71.
22. Silva JA, Escobar A, Collins TJ, Ramee SR, White CJ. Unstable angina: a
comparison of angioscopic findings between diabetic and nondiabetic patients. Circulation 1995; 92: 1731-6.
23. Hong MK, Mintz GS, Lee CW, Suh J, Kim JH, Park DW, Lee SW, Kim YH, Cheong SS, Kim JJ, Park SW, Park SJ. Comparison of virtual histology to intravascular ultrasound of culprit coronary lesions in acute coronary syndrome and target coronary lesions in stable angina pectoris. Am J Cardiol 2007; 100: 953-9.
24. Libby P. Molecular bases of the acute coronary syndromes. Circulation 1995; 91: 2844-50.
25. Davies MJ, Richardson PD, Woolf N, Katz DR, Mann J. Risk of thrombo- sis in human atherosclerotic plaques: role of extracellular lipid, macro- phage, and smooth muscle cell content. Br Heart J 1993; 69: 377-81.
26. Buja LM, Willerson JT. Role of inflammation in coronary plaque disrup- tion. Circulation 1994; 89: 503-5.
27. Moscucci M, Fox KA, Cannon CP, Klein W, López-Sendón J, Montale- scot G, White K, Goldberg RJ. Predictors of major bleeding in acute coro- nary syndromes: the Global Registry of Acute Coronary Events (GRACE).
Eur Heart J 2003; 24: 1815-23.
28. Rao SV. Implications of bleeding and blood transfusion in percutaneous coronary intervention. Rev Cardiovasc Med 2007; 8: S18-26.
29. Bassand JP. Impact of anaemia, bleeding and transfusions in acute coro- nary syndromes: a shift in the paradigm. Eur Heart J 2007; 28: 1273-4.
30. Go AS, Yang J, Ackerson LM, Lepper K, Robbins S, Massie BM, Shlipak MG. Hemoglobin level, chronic kidney disease, and the risks of death and hospitalization in adults with chronic heart failure: the Anemia in Chronic Heart Failure: Outcomes and Resource Utilization (ANCHOR) study. Circulation 2006; 113: 2713-23.