383
전산 데이타를 활용한 약물이상반응검토 및 시그널
김은영a·강원구b,#·권광일a,#
a충남대학교 약학대학, b영남대학교 약학대학
(2011년 8월 10일 접수·2011년 11월 10일 수정·2011년 11월 14일 승인)
Adverse Drug Event Surveillance System using Electronic Data and the Signals
Eunyoung Kim
a, Wonku Kang
b,#, and Kwang-il Kwon
a,#a
College of Pharmacy Chungnam National University
b
College of Pharmacy Yeungnam University
(Received August 10, 2011·Revised November 10, 2011·Accepted November 14, 2011)
약물요법에 있어 약물이상반응은 환자의 사망률과 이환율에 영향을 미치는 중요한 요인이다. 약물이상반응 발생시 이 를 신속히 보고하는 것과 함께 약물치료과정에서 일어날 수 있는 약물 관련부작용을 조기에 인지하고 능동적으로 조 치함으로써 환자에게 가해지는 위해를 최소화하는 것 또한 실제 환자치료의 질적인 관리에서 중요한 부분이다. 본 연구에서는 의료기록의 전산화에 따른 전산데이터들을 활용한 약물이상반응감시방법 중 하나로 평가 받고 있는 Computerized surveillance system (CSS)에 대한 사례 연구들의 방법들을 비교해 보고, 제시된 관련 시그널들 중 약물이상반응을 능동적인 방법 즉 실시간 혹은 예방적으로 적용 가능한 시그널들을 찾아 정리해 보고자 하였다. 이 를 위해 가장 대표적인 연구가 진행되었던 연구사례들을 분석하였고 약 20여 개의 시그널들을 선정하여 분야별로 제 시하였다.
□ Key words - Computerized surveillance system , Adverse drug events (ADEs), Adverse drug reactions (ADRs)
INTRODUCTION
Adverse drug events (ADEs) are common and responsible for significant morbidity and mortality in hospitalized patients.
1,2)Adverse drug events have been reported to occur during 1 % to 30 % of hospital admis- sions, depending on the definition of ADE and the rigor with which they are sought.
3-9)Several studies in the U.S. showed ADEs have contributed to the additional length of hospital stay (1.7~2.2 days longer) and the
increase in medical cost ($ 2,000~$ 3,200 more).
4,6)Many attempts to identify and reduce the incidence rates and severity of these ADEs have been carried out for decades. There are three categories of ADE surveil- lance models, including voluntary reporting, chart review, and computerized screening.
10,11)Voluntary reporting is the traditional ADE detecting method, but it has low detection rates. Chart review produces high detection rates of ADEs, but its expense makes it impractical for ongoing quality monitoring in hospitals.
7,12)However, computer based ADE monitoring has been proven to be cost-effec- tive and practical, as it yields high detection rates at low costs. So there is a growing trend towards its rou- tine application.
13-15)The Computerized surveillance system (CSS)
The Computerized surveillance system, is a method that generally uses computerized data to identify a sig-
#Correspondence to : Kwang-il Kwon
College of Pharmacy, Chungnam National University, Daejeon, South Korea
Tel: +82--42-821-5937, Fax: +82-42-821-6566 E-mail: [email protected]
Wonku Kang
College of Pharmacy, Yeungnam University, Gyeongsan, South Korea
Tel: +82-10-9588-8846, Fax: +82-53-850-4654
E-mail: [email protected]
nal that suggests the possible presence of an adverse event, which can then be investigated by human inter- vention. A computer-based screening method, generates alerts by matching signals such as abnormal laboratory data, drug levels, and use of emergency medicine within electronic medical records (EMRs) or paper charts. Based on these signals, ADEs would be verified by trained personnel such as a physician, a nurse and/or a pharmacist.
16,17)Although this approach still typically involves going to the paper chart, electronic medical record or electronic chart to verify the event, it is much less costly than the review of unscreened charts, because only a small proportion of charts need to be reviewed and the review can be highly focused.
12)Developing a Computerized ADE surveillance system Developing and maintaining a CSS generally involves several steps. The first and most challenging step is to collect patient data in electronic form. The second step is to apply screening algorithms for trigger signals to the collected data to identify patient cases with data that are consistent with an adverse drug event. Examples of these signals include laboratory test results, such as a doubling in serum-creatinine, high serum drug levels or the use of drugs, often used to treat the symptoms asso- ciated with ADEs and use of antidotes. The third step is to determine the predictive value of the automated que- ries, which is usually done by chart review. The data source most often applied to patient safety work is the administrative coding of diagnoses and procedures, usu- ally in the form of ICD-9-CM and CPT (Current Proce- dural Terminology) codes. The codes provide direct and indirect evidence of the clinical state of the patient, comorbid conditions and the progress of the patient during the hospitalization or between visits. Because administrative coding is generated for reimbursement and legal documentation rather than for clinical care, its accuracy and appropriateness for clinical studies are variable at best. The coding suffers from errors, lack of temporal information and a lack of clinical content.
18)A further drawback is the fact that Coding is usually done after discharge or completion of the visit; thus its use in
a real-time intervention is limited.
Pharmacy or clinical laboratory data represent two other common sources of coded data. These sources supply direct evidence for medication and laboratory adverse events (e.g. overdosing, clinical values out of range). In addition, these sources supply information about the patient’s clinical state, corroborating or even superseding the administrative coding. Unlike adminis- trative coding, pharmacy and laboratory data are avail- able in real time, making it possible to intervene in the care of the patient.
If providers use the systems in real time, it becomes possible to intervene and prevent or ameliorate patient harm. The detailed clinical history, the evolution of the clinical plan and the rationale for the diagnosis are criti- cal to identifying adverse events and to sorting out their causes. Visit notes, admission notes, progress notes, consultation notes and nursing notes contain important information and are increasingly available in electronic form. However, they are usually available in uncon- trolled, free-text narratives. If the clinical information contained in these narrative documents can be turned into a standardized format, then automated systems will have a much greater chance of identifying adverse events and even classifying them by cause.
19)Purpose
The purpose of this paper is to review the use of elec- tronic tools in CSS to detect adverse drug events based on the type of data, including ICD-9 codes, drug and labora- tory data and to discuss the evidence regarding the use of these tools to identify adverse drug events in both the inpa- tient and outpatient setting. The focus of this discussion is to detect the events after they occurred. So it is discussed that if in the future such tools can also be used to prevent or ameliorate many events.
EVALUATION OF STUDIES
Computerized ADEs surveillance system
Computerized techniques for identifying adverse drug
events (ADEs) are sufficiently developed for broad use.
They are much more accurate than spontaneous reporting and more time- and cost-effective than manual chart review. These studies are summarized in Table 1. Hospi- tal information systems can be used to identify ADEs by looking for signals that an ADE may have occurred and then directing them to someone (i.e. Clinical pharma- cists) who can investigate.
20)The signals used in these evaluation studies are summarized in detail in Table 2.
Honigman et al.
21)used four categories: ICD-9 codes, allergy records, computer event monitoring, and free- text searching of patient notes for drug–symptom pairs (e.g. ACE inhibitor and cough) to detect ADEs. In an evaluation including one year’s data of electronic medi- cal records for 23,064 patients, including 15,665
patients that came in for care, 864 ADEs were identified.
91% of the ADEs were identified using text detection, 6%
with allergy records, 3% with the computerized event monitor and only 0.3% with ICD-9 coding. The domi- nance of text searching was a surprise and emphasizes the importance of having clinical information in the EMRs, even if it is not coded.
Levy et al.
22)targeted consecutive patients admitted to a 34-bed ward of an acute-care hospital over a 2- month period (n = 199). They used drug laboratory data as signals.
They systematically monitored for approximately 25 laboratory abnormalities and generated paper lists of possible ADEs used for review by clinical pharmacists.
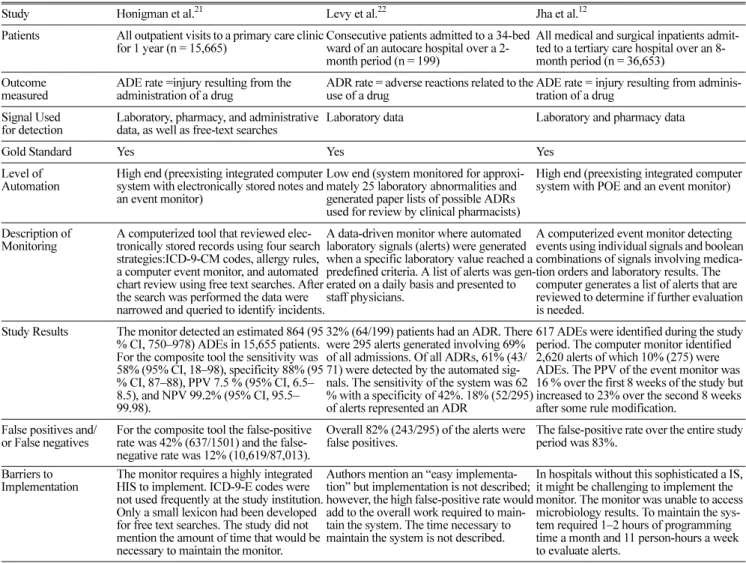
Table 1. Studies Evaluating Computerized ADEs and Results and Barriers to Implementation of Studies Evaluating an ADEs Monitor Using a Gold Standard
Study Honigman et al.
21Levy et al.
22Jha et al.
12Patients All outpatient visits to a primary care clinic for 1 year (n = 15,665)
Consecutive patients admitted to a 34-bed ward of an autocare hospital over a 2- month period (n = 199)
All medical and surgical inpatients admit- ted to a tertiary care hospital over an 8- month period (n = 36,653)
Outcome measured
ADE rate =injury resulting from the administration of a drug
ADR rate = adverse reactions related to the use of a drug
ADE rate = injury resulting from adminis- tration of a drug
Signal Used for detection
Laboratory, pharmacy, and administrative data, as well as free-text searches
Laboratory data Laboratory and pharmacy data
Gold Standard Yes Yes Yes
Level of Automation
High end (preexisting integrated computer system with electronically stored notes and an event monitor)
Low end (system monitored for approxi- mately 25 laboratory abnormalities and generated paper lists of possible ADRs used for review by clinical pharmacists)
High end (preexisting integrated computer system with POE and an event monitor)
Description of Monitoring
A computerized tool that reviewed elec- tronically stored records using four search strategies:ICD-9-CM codes, allergy rules, a computer event monitor, and automated chart review using free text searches. After the search was performed the data were narrowed and queried to identify incidents.
A data-driven monitor where automated laboratory signals (alerts) were generated when a specific laboratory value reached a predefined criteria. A list of alerts was gen- erated on a daily basis and presented to staff physicians.
A computerized event monitor detecting events using individual signals and boolean combinations of signals involving medica- tion orders and laboratory results. The computer generates a list of alerts that are reviewed to determine if further evaluation is needed.
Study Results The monitor detected an estimated 864 (95
% CI, 750–978) ADEs in 15,655 patients.
For the composite tool the sensitivity was 58% (95% CI, 18–98), specificity 88% (95
% CI, 87–88), PPV 7.5 % (95% CI, 6.5–
8.5), and NPV 99.2% (95% CI, 95.5–
99.98).
32% (64/199) patients had an ADR. There were 295 alerts generated involving 69%
of all admissions. Of all ADRs, 61% (43/
71) were detected by the automated sig- nals. The sensitivity of the system was 62
% with a specificity of 42%. 18% (52/295) of alerts represented an ADR
617 ADEs were identified during the study period. The computer monitor identified 2,620 alerts of which 10% (275) were ADEs. The PPV of the event monitor was 16 % over the first 8 weeks of the study but increased to 23% over the second 8 weeks after some rule modification.
False positives and/
or False negatives
For the composite tool the false-positive rate was 42% (637/1501) and the false- negative rate was 12% (10,619/87,013).
Overall 82% (243/295) of the alerts were false positives.
The false-positive rate over the entire study period was 83%.
Barriers to Implementation
The monitor requires a highly integrated HIS to implement. ICD-9-E codes were not used frequently at the study institution.
Only a small lexicon had been developed for free text searches. The study did not mention the amount of time that would be necessary to maintain the monitor.
Authors mention an “easy implementa- tion” but implementation is not described;
however, the high false-positive rate would add to the overall work required to main- tain the system. The time necessary to maintain the system is not described.
In hospitals without this sophisticated a IS,
it might be challenging to implement the
monitor. The monitor was unable to access
microbiology results. To maintain the sys-
tem required 1–2 hours of programming
time a month and 11 person-hours a week
to evaluate alerts.
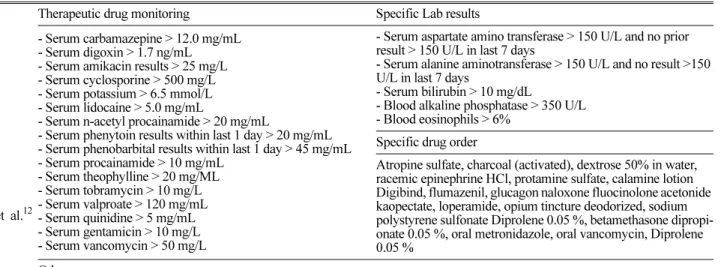
Table 2. Definition of automatic laboratory signals used for de-tection of ADRs
Jha et
al.
12Therapeutic drug monitoring Specific Lab results
- Serum carbamazepine > 12.0 mg/mL - Serum digoxin > 1.7 ng/mL - Serum amikacin results > 25 mg/L - Serum cyclosporine > 500 mg/L - Serum potassium > 6.5 mmol/L - Serum lidocaine > 5.0 mg/mL
- Serum n-acetyl procainamide > 20 mg/mL
- Serum phenytoin results within last 1 day > 20 mg/mL - Serum phenobarbital results within last 1 day > 45 mg/mL - Serum procainamide > 10 mg/mL
- Serum theophylline > 20 mg/ML - Serum tobramycin > 10 mg/L - Serum valproate > 120 mg/mL - Serum quinidine > 5 mg/mL - Serum gentamicin > 10 mg/L - Serum vancomycin > 50 mg/L
- Serum aspartate amino transferase > 150 U/L and no prior result > 150 U/L in last 7 days
- Serum alanine aminotransferase > 150 U/L and no result >150 U/L in last 7 days
- Serum bilirubin > 10 mg/dL
- Blood alkaline phosphatase > 350 U/L - Blood eosinophils > 6%
Specific drug order
Atropine sulfate, charcoal (activated), dextrose 50% in water, racemic epinephrine HCl, protamine sulfate, calamine lotion Digibind, flumazenil, glucagon naloxone fluocinolone acetonide kaopectate, loperamide, opium tincture deodorized, sodium polystyrene sulfonate Diprolene 0.05 %, betamethasone dipropi- onate 0.05 %, oral metronidazole, oral vancomycin, Diprolene 0.05 %
Others
- Receiving diphenhydramine and no diphenhydramine within last 7 days and patient not on paclitaxel and no blood transfusion in last 1 day, Receiving benzodiazepine and receiving anti-epileptic
- Receiving ‘‘nephrotoxin’’ and blood creatinine has risen > 0.5 mg/dL in last 1 day - Receiving phytonadione (vitamin K) and order for warfarin within last 14 days
- Receiving ranitidine and platelet count has fallen to less than 50% of previous value - Receiving diphenoxylate with atropine, Receiving opium and belladonna
- Receiving hydrocortisone and no hydrocortisone within last 7 days
- Receiving triamcinalone and a beta-blocker, Receiving prednisone and receiving epinephrine - Receiving prednisone and diphenhydramine
- Receiving prednisone and no prednisone and no solumedrol within last 7 days
HonIgman et al.21
Allergy, ICD-9, Text searches (“swelling,” “rash,” “irritation”)
Therapeutic drug monitoring Specific drug and related laboratory signals - Serum digoxin > 1.7 ng/mL
- Serum carbamazepine > 12.0 mcg/mL - Serum n-acetyl procainamide > 20 mcg/mL - Serum procainamide > 10 mcg/mL - Serum phenytoin > 20 mcg/mL - Serum theophylline > 20 mcg/mL - Serum valproate > 120 mcg/mL - Serum quinidine > 5 mcg/mL - Serum phenobarbital > 45 mcg/mL - Serum cyclosporine > 500 mcg/L
- On cyclosporine and serum bilirubin > 10 mg/dL - On digoxin and serum potassium < 3.5 mmol/L
- On drugs that increase potassium and serum potassium > 6.5 mmol/L
- On HMG CoA reductive inhibitors and serum AST > 150 U/L - On HMG CoA reductive inhibitors and serum ALT > 150 U/L - On clozapine and white blood count < 3,500/mm3
- On diuretic class A and serum potassium < 3.0 mmol/L - On diuretic class B and serum potassium > 5.5 mmol/L - On NSAIDs and serum potassium > 5.5 mmol/L
- On drugs that increase LFTs (AST/ALT/bilirubin) and blood alkaline phosphate > 350 U/L
- Warfarin and international normalized ratio (INR) > 5 - Ranitidine and 100,000<platelet count< 250,000/ mm3 - Carbamazepine and WBC < 3,500/ mm3
Others
- New order (no orders within last 2 weeks) of diphenhydramine - Any order : oral vancomycin, Kaopectate, loperamide, sodium polystyrene sulfonate
- On phytonadione and on warfarin
- Prednisone and diphenhydramine ordered on the same visit - On topical steroids and no history of psoriasis
- On new order (no orders within last 2 weeks) losartan
Related laboratory signals - Blood eosinophils > 6 %
Levy et al.22
Hematotoxicity Nephrotoxicity Therapeutic drug monitoring
WBC <2500/ mm3 , Platelets < 50 000/mm3 Eosinophilia: >6 % of WBC or > 500/mm3
Drop of Hb >2 g/dl from any previous reading <12 g/
dl
Scr rise >30 % from initial value
Urea >7.5 mmol/L
Increased plasma levels
(digoxin, quinidine, theophylline, cyclosporine, tacrolimus, aminoglycosides, paracetamol, anticonvulsants,)
Hepatotoxicity Metabolic Electrolyte disturbances
Alkaline phosphatase >350 i.u./L, LDH >800 i.u./L GGTP >120 i.u./L, AST and/or ALT >200 i.u./L
Blood glucose >8.0 mmol/L,
< 3.5 mmol/L
K <3.0 mmol/L >6 mmol/L Ca <1.9 mmol/L
A data-driven monitor where automated laboratory sig- nals (alerts) were generated when a specific laboratory value reached a predefined criteria was done. A list of alerts was generated on a daily basis and presented to staff physicians. 32% (64/199) patients had an ADE.
There were 295 alerts generated involving 69% of all admissions. Of all ADEs, 61% (43/71) were detected by the automated signals. The sensitivity of the system was 62% with a specificity of 42%. 18% (52/295) of the alerts represented an ADE. Overall 82% (243/295) of the alerts were false positives. Authors mention an
“easy implementation” but implementation is not described; however, the high false-positive rate would add to the overall work required to maintain the system.
The time necessary to maintain the system is not described.
Jha et al.
12)used the LDS rule base as a starting point, assessed the use of 52 rules for identifying ADEs and compared the performance of the ADE monitor with chart review and voluntary reporting. LDS Hospi- tal had only ten ADEs reported annually from approxi- mately 25,000 discharged patients, before developing its computerized ADE surveillance program. The CSS identified 373 verified ADEs in the first year and 560 in the second year.
8)In 21,964 patient-days, the ADE monitor found 275 ADEs (rate: 9.6 per 1000 patient- days), compared with 398 (rate: 13.3 per 1000 patient- days) using chart review. Voluntary reporting identified only 23 ADEs. Surprisingly, only 67 ADEs were detected by both the computer monitor and chart review. The computer monitor performed better than chart review for events that were associated with a
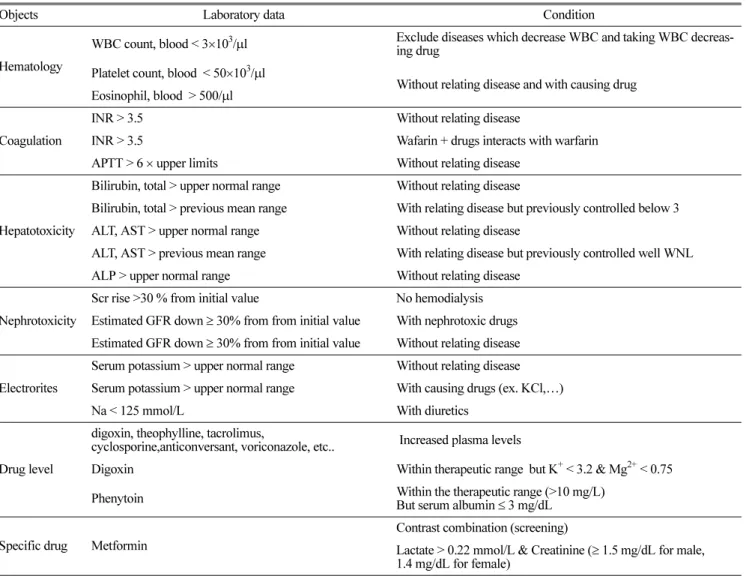
Table 3. Suggested Signals at the concurrent CSS
Objects Laboratory data Condition
Hematology
WBC count, blood < 3×10³/µl Exclude diseases which decrease WBC and taking WBC decreas- ing drug
Platelet count, blood < 50×103/µl
Without relating disease and with causing drug Eosinophil, blood > 500/µl
Coagulation
INR > 3.5 Without relating disease
INR > 3.5 Wafarin + drugs interacts with warfarin
APTT > 6 × upper limits Without relating disease
Hepatotoxicity
Bilirubin, total > upper normal range Without relating disease
Bilirubin, total > previous mean range With relating disease but previously controlled below 3 ALT, AST > upper normal range Without relating disease
ALT, AST > previous mean range With relating disease but previously controlled well WNL ALP > upper normal range Without relating disease
Nephrotoxicity
Scr rise >30 % from initial value No hemodialysis Estimated GFR down ≥ 30% from from initial value With nephrotoxic drugs Estimated GFR down ≥ 30% from from initial value Without relating disease Electrorites
Serum potassium > upper normal range Without relating disease Serum potassium > upper normal range With causing drugs (ex. KCl,…)
Na < 125 mmol/L With diuretics
Drug level
digoxin, theophylline, tacrolimus,
cyclosporine,anticonversant, voriconazole, etc.. Increased plasma levels
Digoxin Within therapeutic range but K+ < 3.2 & Mg2+ < 0.75
Phenytoin Within the therapeutic range (>10 mg/L)
But serum albumin ≤ 3 mg/dL Specific drug Metformin
Contrast combination (screening)
Lactate > 0.22 mmol/L & Creatinine (≥ 1.5 mg/dL for male, 1.4 mg/dL for female)