Occupational Exposure of Nail Technicians to Airborne Chemicals and Biological Monitoring
네
네일 일샵 샵 종 종사 사자 자들 들의 의 공 공기 기 중 중 화 화학 학물 물질 질에 에 대 대한 한 직 직업 업적 적인 인 노 노출 출과 과 생 생물 물학 학적 적인 인 모 모니 니터 터링 링
일샵 종사자들의 1) 공기 중 화학물질에 대한 노출정 도를 파악하고 2) 공기 중 미량으로 존재하는 아세톤 및 톨루엔과 요 중 아세톤 및 마뇨산과의 연관성을 분석하 여 후자들이 아직도 생물학적인 지표로 유용한지를 알 아보고자 본 연구를 실시하였다. 경인 지역소재 9개의 네일숍에 근무하는 20명의 종사자들을 노출군으로 선정 하였으며 이 작업과 무관한 일반 여성 20명을 대조군 선 정하였다. 작업장 공기는 한 네일숍에 3개씩 총 27개의 시료를 가능한 한 작업자의 호흡영역에서 가장 가까운 곳에서 지역시료로 채취하였다. 공기 중 유기증기 13개 물질, 포름알데히드, 요 중 아세톤, 요 중 마뇨산을 가스 크로마토그래프, 자외선분광광도계 그리고 GC/MS를 이 용하여 분석하였다. 유기증기 13개 물질 중 아세톤과 톨 루엔은 모든 네일샵에서 검출되었다. 각 네일샵 공기 중 유기증기의 노출정도를 기하평균(GM)과 복합물질간 상 가작용을 이용하여 평가를 하였을 때 노동부 노출기준
의 10%, ACGIH의 13% 수준에 불과하여 네일샵 종사자 들의 유기증기에 대한 직업적인 노출정도는 매우 낮은 것으로 판단되었다. 요 중 아세톤과 마뇨산은 공기 중 아 세톤과 툴루엔과 약한 상관성을 보였다(아세톤의 상관 계수 r=0.49, 톨루엔의 상관계수 r=0.45). 그러나 요 중 아 세톤의 농도가 노출군과 대조군 간에 통계적으로 유의 하지 않았으며 마뇨산은 대조군에 비해 노출군에서 약 간 높은 것으로 나타났다. 따라서 저자들은 공기 중 아세 톤과 톨루엔의 농도가 낮은 작업장에서 요 중 아세톤과 마뇨산을 생물학적 지표로 삼는 것은 적절하지 못한 것 으로 결론지었다.
양지희1·한돈희2†
1을지대학교 피부건강관리과, 2인제대학교 보건안전공학과
Jin Hee Yang
1·Don-Hee Han2†1
Department of Dermatic Health Management, Eulji University and
2Department of Occupational Health and Safety Engineering, Inje University
접수일 : 2010년 1월 27일, 채택일 : 2010년 3월 16일
‡ 교신저자 : 한돈희(621-749 경남 김해시 어방동 607 인제대학교 보건안전공학과,
TEL: 055)320-3285 FAX: 055)325-2471 E-mail: [email protected])
Nail salon, Airborne solvents, Urinary acetone, Urinary hippuric acid
Key Words :
Ⅰ. Introduction
The number of licensed nail technicians was approximately 3,500 in 2002, increasing every year, 7,300 in 2007 and approximately total 32,000 are working in business related to nail in 2008 in Korea
(Korean Nail Association, 2008). Nail cosmetics include a number
of different products such as adhesives, primers, nail polish, polish
removers, hardeners and several sculpturing materials (Schoon,
2000). They contain many toxic and potentially hazardous
ingredients that can cause adverse health effects to nail technicians at
excessive exposure levels. According to previous studies, the amount of airborne chemicals in nail salon were insignificant compared to traditional industrial workplaces (Hiipakka and Samimi, 1987; Almaguer and Blade, 1990; Decker and Beasley, 1992; Gjølstad et al, 2006), but nail technician were exposure to a wide variety of chemical substances, in particular, solvents. These materials rapidly evaporating are acetone, toluene, isopropyl alcohol, xylene, ethyl acetate and so on. These volatile organic solvents (VOCs) can be formulated with a number of chemicals that evaporate rapidly and can cause irritation to the eyes and respiratory system. Application of artificial fingernail extensions, manicuring, coloring and the other nail technician’s work are now common practice. Nail extension products also frequently contain both VOCs as well as acrylate products. Acrylate products can have a low odor threshold that is associated with a pungent aroma (Massachusetts Department of Public Health, 1999).
The typical nail salon is a single room with anywhere from one to ten work stations or tables. The technician sits on one side of a table facing a client on the other side and is at his (her) task. Consequently the working procedures during nail treatment imply that the chemical products are used close to the technician
’s breathing zone.In addition to that, exposure to mixtures of airborne chemicals may affect nail technicians through multiple route of entry and may be more toxic to several body systems than exposure to single chemical.
Under exposure to low level of VOCs, some urinary biomarkers may be not suitable for evaluating exposure to airborne chemicals due to less than biomarkers of daily food or drinking origin. For instance, hippuric acid is not recommended as a biomarker for toluene under toluene airborne concentration of below 30-50 ppm (Foo et al, 1991; Kawai et al, 1994). In the resent study, urinary toluene, not hippuric acid, can be regarded not only as biomarkers of industrial exposure, but also as indicators of low level non- occupational indoor exposures (Wang et al, 2007). It needs to clear whether at low levels of exposure to some airborne chemicals, particularly, acetone and toluene, acetone and metabolized hippuric acid in urine would still be useful for the assessment of their concentration in air.
The aims of this study were 1) to investigate the occupational exposure to airborne solvents and formaldehyde in nail salons in Korea and 2) to make clear whether relationships between airborne acetone and toluene at low concentrations and urinary acetone and hippuric acid would be still useful.
Ⅱ. Materials and Methods
S
Su ub bjje ec ctt n na aiill s sa allo on ns s
As Table 1 shown, a total number of 9 salons were selected in Seoul (7 salons) and Incheon (2 salons) in which most of nail salons were located in Korea. No attempt was made to select a random sample. Two to twelve nail technicians work at each salon. The floor area of salons surveyed in this study ranged in size from 20.1 m2 to 165.6 m2. Seven salons were single room with a general room ventilator attached by a propeller fan and two salons were open spaces in mart which did not need a ventilator.
A
Aiirr s sa am mp plliin ng g a an nd d a an na allyys siis s
Personal air sampling could not undertake due to technicians’
noncooperation. Instead of personal sampling, area sampling was performed at the center of working table, as close as possible to the breathing zone of the nail technicians out of the way. Three samples each material were collected at each salon. In other words, three samples for solvents, three samples for methyl methacrylate (MMA) and three samples for formaldehyde, total nine samples were simultaneously collected in a salon.
Nail salons were sampled for solvents, methyl methacrylate and formaldehyde with the use of sampling and analytical methods similar to those recommended by NIOSH (NIOSH, 2007).
Sampling of solvents was performed using sampling pumps (Gilian, model 17 G9, USA) attached with charcoal tubes. Before and after sampling the pumps were calibrated using an electronic calibrator (Gilian, model Gilibrator, USA). The sampling time varied 90 to 120 minutes at a flow rate of 10 to 50 milliliters per minute. After sampling the tubes were stored on dry ice until analysis. Air samples for methyl methacrylate were collected on XAD-2 (400 mg/200mg) tubes at a flow rate of 10 to 50 milliliters per minute. Sampling times ranged 90 to 120 minutes. Sampling for formaldehyde was undertaken using sampling pumps with impingers containing an aqueous 1% sodium bisulfite (NaHSO
3) solution. The sampling was performed 120 minutes at a flow rate of 50 ml/min.
The determination of solvents were accomplished using gas
chromatograph (Shimadzu, model GC 2010F, Japan) equipped with
FID detector. The injection and detection temperature were 230
℃,250℃, respectively. The column was a DB-WAX (60 m × 0.25
mm ID, 0.25 μm film thickness). The GC oven temperature program
for the GC system was 40℃ for 2 minutes, 3℃/min up to 65℃, 2
minutes at 65℃, 21.5℃/min up to 95℃, 2 minutes at 95℃. The flow rate of carrier gas was total 69.3 mL/min (151.2 kPa) and the injection volume was 1 μL with slit ratio 50:1. The determination of methyl methacrylate was similar to the analysis of solvents using the gas chromatograph equipped with FID detector. The injection and detection temperature were 250℃. The flow rate of carrier gas was total 46.3 mL/min (139.2 kPa). Sodium bisulfite solutions were analyzed for formaldehyde by reaction with chromotropic acid and subsequent visible absorption spectrometry (Camspec, model 5600, UK) in accordance with NIOSH Method No. 3500(NIOSH, 2007).
L
Liim miitta attiio on n o off s sa am mp plliin ng g
For more precise determination of individual exposure to airborne chemicals personal sampling is to be preferred to area sampling, however, the former was not undertaken due to technicians’
rejection to sample. Even if sampling time ranged 90 minutes to 120 minutes, it was assumed that average concentration of the remaining time being not sampled should be the same average concentration of time sampled.
S
Sa am mp plliin ng g a an nd d a an na allyys siis s ffo orr u urriin na arryy a ac ce etto on ne e a an nd d h
hiip pp pu urriic c a ac ciid d
As Table 1 shown, a total number of 20 technicians (exposed group) participated in biological monitoring voluntarily. 21 females were selected as control group in consideration of age, smoking, living area, chronic ethanol intake and jobs unrelated to nail working process. Spot urine samples were collected with paper cups from 1 hour before to right after working in accordance with ACGIH documentation (ACGIH, 2009). Ten milliliters of urine samples were transferred to 22 mL glass vials capped with silicone-free
Size W×L×H (m)
No. of technicians
(No. of techniciansparticipating in biological monitoring)
Average clients/day
Type of workplace
Year of opening A
B C D E F G H I
3.4×5.9×2.5 6.6×11.5×2.6 3.9×6.8×2.5 4.3×7.8×2.5 4.5×11.0×2.9 9.2×18.0×3.0 6.0×11.0×2.0 5.0×6.8×3.0 4.5×7.5×3.0
2(1) 12(3) 4(2) 6(1) 7(1) 7(3) 8(4) 4(3) 4(2)
18 70 23 43 40 40 80 28 20
Single room Single room Single room Single room Single room Single room Single room Open in mart Open in mart
2005 1995 2004 2006 2004 2002 2000 2007 2007
Table 1. General characteristics of nail salons in the studyParameter
Column Carrier Oven Temp.
Injector type Injector Temp.
Transfer line
Conditions
HP-5MS (Cross-linked 5% phenyl methyl silicon), 30 m × 0.2 mm I.D. × 0.25 μm F.T
He at 1.0 mL/min
130oC (1 min) →250oC (5 min) split mode (1:10)
260oC 270oC
Table 2. GC/MS conditions of urinary hippuric acid analysis
plugs, and refrigerated at 4℃. The analysis was performed within a few days after collection. For urinary hipurric acid analysis, extraction was carried out by adding 2 ml of ethyl acetate and 0.5 N HCl, and the samples were mixed for 20 minutes, centrifuged at 1500 rpm for 4 min and the ethyl acetate layer transferred to tapered test tubes. Samples were evaporated to dryness and add 1 mL of derivatization reagent, then reactivated in a heating block at 60℃ for 45 minutes. After cooling to room temperature, reaction mixture was added 2 mL of distilled water and 1 mL of chloroform, centrifuged at 3000 rpm for 4 min. Extracted chloroform layer was used for analayzing hippuric acid. Urinary hippuric acid was determined by a GC/MS (Agilent, model HP-6890/5973N, USA) in accordance with previous analytical methods (de Carvalho et al, 1991; Cho et al, 1995). The ion source was operated in the electron ionization mode (EI; 70 eV, 230 C). Full-scan mass spectra (m/z 40-400) were recorded for analyte identification. Table 2 shows the operating parameters and conditions of determination for urinary hippuric acid.
The method for determining urinary creatinine was derived from a previously reported method (Clark and Thompson, 1949) and was used to correct the urinary metabolite concentration for urinary dilution by expressing the results as the amount of metabolite excreted per gram of creatinine. For urinary acetone 2 mL of urine was mixed with 5 μL of internal standard (1,2-dichloroethane), and analyzed by the same system which was used to determine hippuric acid.
S
Su urrvve eyy o off n na aiill tte ec ch hn niic ciia an ns s’ ’s syym mp ptto om m p prre evva alle en nc ce e Aside from the measurement of airborne chemicals and biomarkers, survey of nail technicians’symptom prevalence was conducted. Self-administrated questionnaire designed to elicit symptoms that could be caused by exposure to air contaminants generated during working related to nail was to distributed to 300 nail technicians by mail. After questionnaires were completed, they were returned to the author by mail. Finally a total number of 242 nail technicians responded to questions.
S
Stta attiis sttiic ca all a an na allyys siis s
All data obtained were subjected to statistical analyses with the Statistical Analysis System (SAS Institute, Inc., North Carolina, USA) computer program, including simple descriptive analysis and correlation analysis between technicians (exposed group) and control group.
When assessing exposure to mixtures of organic solvents with similar toxicological effect, their combined effect, rather than that of either individually, should be given primary consideration.
According to ACGIH (ACGIH, 2009), the combined exposure is represented by the additive effect calculated by means of the formula:
If the sum exceeds unity, the threshold limit of the mixture should be considered as being exceeded (where C1 indicates the observed atmospheric concentration and T1 is the corresponding occupational exposure limit). Airborne solvents were evaluated with this method.
Ⅲ. Results and Discussion
C
Co on nc ce en nttrra attiio on n o off a aiirrb bo orrn ne e s so ollvve en ntts s
In Table 3 airborne solvents measured are listed. Two of 27 samples for airborne solvents were damaged to some extent and excluded from data, and then a total number of 25 samples in nine salons were finally counted to be measured for airborne solvents.
Table 3 shows that the solvents most frequently present in all samples were acetone, toluene, measured in 100% of samples, respectively, and methyl methacrylate, isopropyl alcohol were measured in 92%, respectively, coming in second. The solvent appearing in the highest concentration as well as most frequently present in all samples was acetone, being geometric mean (GM) of 8.46 ppm and geometric standard deviations (GSD) of 5.36, which is thought to be the reason that acetone was most widely used in removing manicure. The solvent present frequently but being at the lowest level was methyl methacrylate (MMA) (GM: 0.04 ppm).
This was almost in accordance with the previous result (Gjølstad et
al, 2006), although GM in this study differed from arithmetic mean
(AM) in statistical calculation. The small amount of MMA detected
may be explained by impurity in nail artificial products. Table 3 also
displays that all of GMs of airborne solvents are very low compared
to Korean OELs (Korean ministry of labor, 2009) as well as ACGIH
TLVs (ACGIH, 2009). The magnitude of GSDs suggests that wide
variations in the levels of airborne chemical contaminants could be
expected during working process related to nail. For example, GSD
of acetone was 5.36 and the levels ranged from 167.78 ppm to 0.45
ppm. The reason that GSDs of cyclohexanone, o-Xylene, MIBK
and TCE ranged from 1.04 to 1.80, being relatively low, was due to
the small number of samples detected. If the contaminants were detected in as many as samples of the other contaminants, the variations of those would be very wide spectrum as those of the others. The results that airborne solvents were detected at very low levels compared to the corresponding Korean OELs or ACGIH TLVs and the variations of them were of very wide spectrum accorded with the previous studies related to cosmetic shops (Hiipakka and Samimi, 1987; Almaguer and Blade, 1990; Decker and Beasley, 1992; Gjølstad et al, 2006, Hollund BE and Moen, 1998). Overall solvents were evaluated with the addictive effects using GM value of each solvent. Overall airborne solvents exposed were very low to be no more than 10% of Korea corresponding OELs, 13% of ACGIH TLVs.
The result implies that the level of airborne solvents found in nail salon is very low, as a matter of fact, even if it would be expected to very high because most of all technicians complain smelling of solvents, inadequate ventilation and breathing close to nail products
etc.
Most nail enamels contain less than 0.0015% formaldehyde. This amount comes from an ingredient called toluene sulfonamide formaldehyde (TSF) resin (Schoon, 2000). Exposure to formaldehyde can occur through inhalation or skin absorption. The effects associated with formaldehyde exposure are irritation of the mucous membranes of the eye and respiratory tract, and allergic sensitization of the skin (NIOSH, 1977). Formaldehyde was detected in all samples, but was at the very low level of GM 0.06 ppm, compared to Korean OEL of 0.5 ppm. In other words, the ratio of measured level to OEL was 0.12. This founding indicates that occupational exposure to formaldehyde in nail salon could be expected to be insignificant.
B
Biio ollo og giic ca all m mo on niitto orriin ng g
Table 4 shows general characteristics of 20 nail technicians
Parameter No. of
Salons
No. of Samples
Korean OELs (TWA)
ACGIH TLVs (TWA)
Concentrations in ppm
GM GSD Med Max Min
Acetone Toluene
Methyl Methacrylate (MMA) Isopropyl Alcohol
Ethyl Acetate n-Butyl Acetate n-Pentane n-Hexane n-Heptane Cyclohexanone o-Xylene MIBK TCE
Formaldehyde
9 9 9 9 8 7 7 5 3 1 1 1 1
9
25 25 23 23 18 19 19 13 7 3 3 3 3
27
= 0.10
500 50 50 200 400 150 600 50 400
25 100
50 50
0.5
500 20 50 200 400 150 600 50 400
20 100
50 10
C0.3
8.46 0.39 0.04 0.57 0.44 0.50 0.98 0.59 0.74 0.23 0.14 0.36 0.17
0.06
5.36 1.95 2.03 2.19 2.53 2.16 3.50 2.91 2.08 1.08 1.04 1.80 1.25
2.01
6.88 0.45 0.05 0.39 0.41 0.42 0.87 0.38 0.72 0.23 0.14 0.27 0.16
0.07
167.78 1.40 0.12 3.67 2.54 1.74 7.54 5.42 1.71 0.24 0.15 0.70 0.22
0.21
0.45 0.13 0.01 0.17 0.21 0.16 0.22 0.19 0.29 0.21 0.13 0.24 0.13
0.01
Table 3. Airborne concentrations and the corresponding Korean OELs and ACGIH TLVs in ppm= 0.13
= 0.12
GM: geometric mean, GSD: geometric standard deviation
(exposed group) participating in biological monitoring. All of participants were female, at age of 30.3
± 5.4, working career of 6.6± 3.6 years and average working hour a day of 10.6 ± 1.4 hours.
Table 5 shows the results for comparison of acetones in urine between exposed group and control group. The mean urinary acetone level for 20 nail technicians in nail salons where the
exposure level in air ranged 0.48 to 137.61 ppm was 3.93 mg/L (
±7.23 mg/L) below ACGIH BEI of 50 mg/L (ACGIH, 2009), while the mean for control group was 1.42 mg/L (±0.79 mg/L). There was a little difference in mean values between two groups, but not significant difference statistically, which may be explained by the
Sex Age Year
worked
Working hour/day
Female 30.3±5.4 6.6±3.6 10.6±1.4
Table 4. General characteristics of exposed group (N=20)
Exposed group (nail technicians) Subjects
No.
1 2 3 4 5 6 7 8 9 10 11 12 13 14 15 16 17 18 19 20
29 25 43 24 27 29 29 34 28 33 35 41 34 33 28 26 33 28 24 23
6 4 15
7 3 3 5 10
3 9 12 14 7 7 4 3 6 4 5 5
9 12 12 10 11 11 12 12 12 9 12 12 10 10 10 11 10 12 8 8
1.27 1.07 1.57 2.39 0.82 1.09 1.37 3.55 2.42 15.23 1.57 31.77 3.58 1.35 2.80 0.91 1.21 1.04 0.95 0.87
2.62 25.88 25.88 25.88 3.73 3.73 6.94 7.8 68.67 68.67 68.67 137.61 137.61 137.61 137.61 8.7 8.7 8.7 0.48 0.48
28 24 42 24 21 22 21 34 21 33 38 41 36 32 21 20 38 20 20 20 20
0.97 1.83 0.80 1.67 1.1 1.96 1.03 1.67 3.98 0.87 1.76 2.13 1.27 1.15 2.54 0.68 0.77 1.02 1.23 0.68 0.81 Age Years worked
Average working hours/day
Urinary acetone (mg/L)
Airborne
acetone (ppm) Age Urinary acetone (mg/L) Control group
Table 5. Comparison of urinary acetone between exposed group and control groupAM ± SD 3.93±7.23 44.64±52.80 1.42±0.79
P-value = 0.156
followings; 1) wide variation for exposed group (SD: 7.23 mg/L), 2) limited samples, 3) short half-life of acetone of about 4 hours in urine (Wigaeus et al, 1981). The another explanation is that because acetone is formed in the organism as a product of fat metabolism, that is, endogenous product, urinary acetone level in non- occupationally exposed subjects is not a little (Lauwerys and Hoet, 2001). In a study those was 0.842 mg/L (range: 0.13 to 9.35 mg/L) (Wang et al, 1994). It was noted that urinary acetone concentrations for subject no.12 to 15 exposed at the highest airborne acetone concentration of 137.67 ppm ranged from 31.77 mg/L (the highest level in all samples) to relatively low level of 1.35 mg/L (more than
mean value).
Hippuric acid is a normal constituent of urine, originating mainly from food containing benzoic acid or benzoates (Lauwerys and Hoet, 2001). The back ground urinary hippuric acid concentrations in control groups were 0.41 (range: 0.01 to 0.8) g/g creatinine for Philipino subjects, 0.39 (range: 0.02 to 0.43) g/g creatinine for Japanese subjects (Villanueva et al, 1994). In Table 6 the mean and standard deviation of urinary hippuric acids in control group were 0.24 ± 0.11 g/g creatinine and those in exposed group were 0.37 ± 0.20 g/g creatinine (ACGIH BEI = 1.6 g/g creatinine), and significant difference between two groups was found (P < 0.05).
Exposed group (nail technicians) Subjects
No.
1 2 3 4 5 6 7 8 9 10 11 12 13 14 15 16 17 18 19 20
29 25 43 24 27 29 29 34 28 33 35 41 34 33 28 26 33 28 24 23
6 4 15
7 3 3 5 10
3 9 12 14 7 7 4 3 6 4 5 5
9 12 12 10 11 11 12 12 12 9 12 12 10 10 10 11 10 12 8 8
0.16 0.16 0.47 0.25 0.21 0.50 0.15 0.31 0.41 0.46 0.46 0.92 0.29 0.54 0.16 0.46 0.66 0.41 0.22 0.17
0.18 0.60 0.60 0.60 0.33 0.33 0.30 0.49 0.66 0.66 0.66 1.21 1.21 1.21 1.21 0.58 0.58 0.58 0.14 0.14
28 24 42 24 21 22 21 34 21 33 38 41 36 32 21 20 38 20 20 20 20
0.22 0.08 0.27 0.46 0.09 0.34 0.26 0.33 0.20 0.46 0.21 0.07 0.32 0.29 0.35 0.05 0.19 0.18 0.28 0.18 0.17 Age Years worked
Average working hours/day
Urinary hippuric acid (g/g creatinine)
Airborne toluene
(ppm) Age Urinary acetone
(mg/L) Control group
Table 6. Comparison of urinary hippuric acid between exposed group and control groupAM ± SD 0.37± 0.20 0.61±0.35 0.24± 0.11
P-value = 0.014*
Workers
Urinary acetone (mg/L) Correlation
Coefficient (r) P-value Coefficient (r) P-value
Urinary hippuric acid (g/g creatinine)
Age (year) Year worked Working hour/day
Airborne concentration (ppm)
0.51 0.54 0.11 0.49
0.021*
0.013*
0.645 0.030*
0.66 0.50 0.30 0.45
0.001**
0.026*
0.206 0.048*
Table 7. Correlations between urinary acetone, hippuric acid and age, year worked, working hour a day of technicians (N=20) and airborne concentrations
Compared to the results of the study previously stated22), all of exposed group and control group were slightly low, but it is not easy to explain the cause in this study. The mean airborne concentration of toluene in this study was 0.61 ppm (GM: 0.39 ppm) and very high compared to the mean values of 0.033 ppm in new apartments (Jang et al, 2004) , 0.012 ppm in house (Kim et al, 2006) in Korea. Even if exposure to airborne toluene for control group was not measured in the present study, control group was probably expected to be exposed to more or less the above mentioned concentrations.
Nevertheless, that the difference of the means of urinary hippuric acids between exposed group and control group was slight (about 1.5 times) may be explained that hippuric acid is excreted endogenously in addition of toluene-derived hippuric acid.
C
Co orrrre ella attiio on ns s b be ettw we ee en n u urriin na arryy a ac ce etto on ne e,, h hiip pp pu urriic c a
ac ciid d a an nd d o otth he err ffa ac ctto orrs s
Table 7 shows correlations of urinary acetone and hippuric acid with other factors. In the case of urinary acetone, it was found to be correlated with age, year worked and airborne concentration (P <
0.05). With the toxicokinetics of acetone that acetone in urine declines with an apparent half-life of about 4 hours (Wang et al, 1994), the result that urinary acetone was correlated with age and year worked is not clear to explain the reason. In workers with occupational exposure to large amount of acetone concentration, urinary acetone concentration was found to be strong correlated with acetone concentration in air (Wang et al, 1994; Fujino et al, 1992) . According to the previous study with 28 workers in a factory where the exposure level varied between 0.1 and 45 ppm at relatively low level (Kawai et al, 1990), the correlation coefficient between acetone in air and acetone concentration in urine was strongly 0.90. This study revealed that correlation between acetone exposure level and urinary acetone was found even if very weak (r: 0.49). Weak
correlation may be caused by limited number of samples (N: 20).
But as Table 5 shown, there was no clear distinction between exposed subjects and control group. Consequently the result indicates that relationships between airborne acetone at low concentrations and urinary acetone would be unclear.
Urinary hippuric acid was also correlated with age, year worked and airborne concentration (P < 0.05). Similarly to acetone in urine, the result that hippuric acid was correlated with age, year worked is not easy to interpret the meaning in view of the toxicokinetc characteristics of rapid excretion (Lauwerys and Hoet, 2001).
According to the previous study with workers exposed to less than 16 ppm toluene, no significant correlation was found between toluene in air and hippuric acid excretion (Kawai et al, 1990).
Another study suggested that urinary hippuric acid should be no longer considered the method of choice for the biological monitoring of exposure to toluene because of the large interindividual variation in the background level (L?f et al, 1993). In this study, very weak correlation (r: 0.45) between airborne toluene and urinary hippuric acid excretion was found. As Table 6 shown, the excretion of hippuric acid for exposed group was only slightly above the background level for control group, even if significant difference was found, which was similar to the result of the previous study (Tardif et al, 1998). After all the analysis of this study and previous studies, authors suggest that urinary hippuric acid excretion would be inadequate biomarker at low level of exposure to airborne toluene.
C
Clliin niic ca all s syym mp ptto om m p prre evva alle en nc ce e
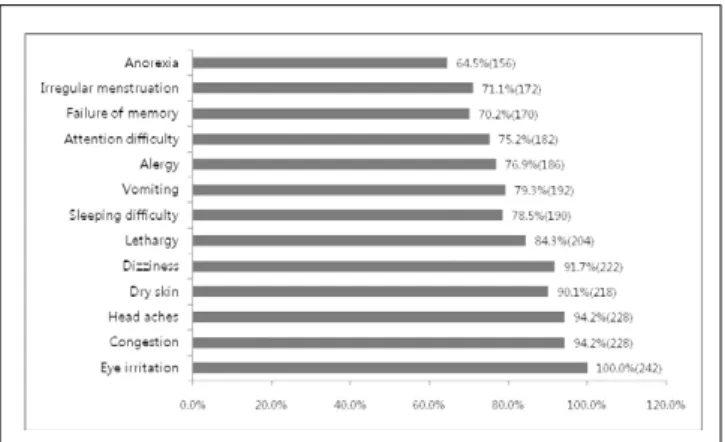
As for the clinical symptom prevalence of 242 respondents,
Figure 1 shows that the most frequently effect experienced by nail
technicians was eye irritation, which all nail technicians was always
experienced during working. Next to that, congestion (94.2%),
headaches (94.2%) and dry skin (90.1%) were followed. Some
technicians responded that they experienced even allergy (76.9%), irregular menstruation (71.1%) and anorexia (64.5%). Because self- reporting questionnaire was used, response rate was likely to be overestimated, but it is noted that a large number of technicians clearly clinically suffer from vaporous solvents and other contaminants during working. To prevent from clinical symptom during working, the ventilated table recommended by NIOSH should be provided and industrial practice to lower their exposure to airborne chemicals be necessary (NIOSH, 1977).
Ⅳ. Conclusions
A total number of 13 airborne solvents were measured in the study, but each concentration of solvent was far below both Korean OELs and ACGIH TLVs. When evaluated with the addictive effects using GM value of each solvent, overall airborne solvents exposed were no more than 10% of Korean OELs, 13% of ACGIH TLVs.
Concentrations of urinary acetone and urinary hippuric acid were weakly correlated with those of airborne concentrations (correlation coefficients of 0.49 and 0.45, respectively). Nevertheless, urinary acetone concentration for exposed group was no significant difference from those for control group, and concentration of hippuric acid for exposed was only slightly above those for control group. After reviewing the results of the previous studies and this study, in conclusion, authors suggest that urinary acetone and hippuric acid excretion at low level of airborne exposed would be
inadequate biomarkers. Even if nail technicians were exposed to low level of airborne chemicals, they still complained a large number of
clinical symptoms. Therefore, a special measure to prevent from clinical symptoms, for example, NIOSH’s ventilated table and industrial practice (NIOSH, 1977), should be taken in all salons.
REFERENCES
Almaguer D, Blade LM: Health hazard evaluation report No. 90- 048 (HETA 90-048-2253), Cincinnati, OH: NIOSH, 1990.
American Conference of Governmental Industrial Hygienists (ACGIH): TLVs and BEIs , Cincinnati, OH: ACGIH, 2009.
Cho S-H, Lim Y-H, Kim S-M, Kwon H-J, Ha M-n, Han S-H:
Validation of new derivatization procedure for the determination of hippurric acid in urine using gas chromatography. Kor J Occup Med 7, 58-62 (1995) (in Korean) Clark LC, Thompson HL: Determination of creatine and creatinine
in urine. Anal Chem 21, 1218?1221 (1949)
de Carvalho D, Lanchote VL, Bonato PS, Queiroz R, Santos AC and Dreossi S: A new derivatization procedure for the analysis of hippuric acid and m-methyl-hippuric acid by gas chromatography. Int Arch Occup Environ Health 63, 33-37 (1991)
Decker J, Beasley A: Health hazard evaluation report No. 92-128 (HETA 92-128-2241), Cincinnati, OH: NIOSH, 1992.
Foo SC, Jeyaratnam J, Ong CN, Koh D and Chia SE: Biological monitoring for occupational exposure to toluene. Am Ind Hyg Assoc J 52, 212?217 (1991)
Fujino A, Satoh T, Takebayashi T, Nakashima H, Sakurai H, Higashi T, Matumura H, Minaguchi H and Kawai T: Biological monitoring of workers exposed to acetone in acetate fiber plants. Br J Ind Med 49, 654-657 (1992)
Gjølstad M, Thorud S and Molander P: Occupational exposure to airborne solvents during nail sculpturing. J Environ Monit 8, 537-542 (2006)
Hiipakka D, Samimi B: Exposure of acrylic fingernail sculptor to organic vapors and methacrylate dusts. Am Ind Hyg Assoc J 48(3), 230-237 (1987)
Hollund BE and Moen BE. Chemical Exposure in Hairdresser Salons: Effect of Local Exhaust Ventilation. Ann Occup Hyg 42, 277-281 (1998)
Jang SK, Lee SJ, Yoo SW, Jung KM, Ryu JM: A survey of indoor air quality in new apartment houses in Korea. J Kor Soc Ind Environ 1, 12-24 (2004) (in Korean)
Kawai T, Mizunuma K, Yasugi T, Horiguchi S and Ikeda M:
Figure 1. Self-reported symptoms experienced every work (multiple responses available).
Toluene in blood as a marker of choice for low-level exposure to toluene. Int Arch Occup Environ Health 66, 309?315 (1994) Kawai T, Mizunuma K, Yasugi T, Horiguchi S and Ikeda M:
Toluene in blood as a marker of choice for low-level exposure to toluene. Int Arch Occup Environ Health 66, 309-315 (1990) Kawai T, Yasugi T, Uchida Y, Iwami O and Ikeda M: Urinary
excretion of unmetabolized acetone as an indicator of occupational exposure to acetone. Int Arch Occup Environ Health 62, 165-169 (1990)
Kim Y-S, Roh Y-M, Lee C-M, Jang B-K: Health risk assessment of exposure to indoor air pollutants in house. J Kor Soc Ind Environ 3, 180-198 (2006) (in Korean)
Korean ministry of labor (KML): Occupational exposure limits for chemical and physical hazards. Kwachon, Kyeongki-do: KML, 2009 (in Korean)
Korean Nail Association (KNA): Statistics of nail technicians produced in 2002-2007, Seoul: KNA, 2008.
Lauwerys RR and Hoet P: Indutrial chemical exposure - guidelines for biological monitoring, 3
rded., Boca Raton, FL: CRC Press LLC, 2001.
Lof A, Hjelm EW, Colmsjo A, Lundmark BO, Norstrom A and A Sato: Toxicokinetics of toluene and urinary excretion of hippuric acid after human exposure to
2H
8-toluene. Br J Ind Med 50, 55-59 (1993)
Massachusetts Department of Public Health: Protocol for investigating odor complaints related to nails, 1999. (on line), available from <http://www.mass.gov/Eeohhs2/docs/dph/
environmental/iaq/ ventilation_nail_salons.pdf>, (accessed 2009-02-08)
National Institute for Occupational Safety and Health (NIOSH):
Controlling chemical hazards during the application of artificial fingernails (DHHS Publication No. 99-112), Cincinnati, OH:
NIOSH, 1977.
National Institute for Occupational Safety and Health (NIOSH):
Criteria for a recommended standard-occupational exposure to formaldehyde (Publication No. 77-126). Cincinnati, OH:
NIOSH, 1977.
National Institute for Occupational Safety and Health (NIOSH):
NIOSH Manual of analytical methods (NMAM), 4
thed, 2007.
(on line), available from < http://www.cdc.gov/niosh/ >, (accessed 2007-01-20)
Schoon DD: Acrylic and artificial nail product chemistry, 2000. (on line), available from <http://www.hooked-on-nails.com/
chemistry.html>, (accessed 2009-02-08)
Tardif R, Truchon G and Brodeur J: Comparison of hippuric acid and o-cresol in urine and unchanged toluene in alveolar air for the biological monitoring of exposure to toluene in human volunteers. Appl Occup Environ Hyg 13, 127-132 (1998) Villanueva MBG, Jonai H, Kanno S and Takuchi Y: Dietary sources
and background levels of hippuric acid in urine: comparison of Philippine and Japanese levels. Ind Health 32, 239-246 (1994) Wang B-L, Takigawa T, Takeuchi A, Yamasaki Y, Kataoka H, Wang
D-H and Ogino K: Unmetabolized VOCs in urine as biomarkers of low level exposure in indoor environments. J Occup Health 49, 104-110 (2007)
Wang G, Maranelli G, Perbellini L, Raineri E and Brugnone F:
Blood acetone concentration in
“normal people”and inexposed workers 16 h after the end of the workshift. Int Arch Occup Environ Health 65, 285-289 (1994)
Wigaeus E, Holm S and Astrand I: Exposure to acetone, uptake and elimination in man. Scand J Work Environ Health 7, 84-87 (1981)
‥ ‥ ‥