DOI: 10.5532/KJAFM.2011.13.4.165
ⓒ Author(s) 2011. CC Attribution 3.0 License.
우리나라 산림과 도시지역의 이산화질소 농도의 시·공간적 패턴
이승우
*
·이충화 국립산림과학원산림수토보전과(2011
년9
월8
일접수; 2011
년12
월6
일수정; 2011
년12
월6
일수락)
Temporal and Spatial Pattern of Ambient Nitrogen Dioxide Concentration in Forest and Urban Areas, Korea
Seung-Woo Lee
*
and Choong-Hwa LeeDivision of Forest Water and Soil Conservation, Korea Forest Research Institute, Seoul 130-712, Korea
(Received September 8, 2011; Revised December 6, 2011; Accepted December 6, 2011) ABSTRACT
The ambient concentrations of nitrogen dioxide (NO
2) at 65 forest areas were measured every month using passive diffusive samplers from 2002 to 2009 and were compared to those at urban areas in order to investigate the characteristics of temporal and spatial distributions of NO
2from the forest and urban areas. The annually averaged concentrations of NO
2gradually decreased for both areas.
The average concentration of NO
2in the forest areas was 8.0 ppb, which was lower than that in the urban areas (i.e., 19.4 ppb) and the ecological standard level of the European Union (i.e., 14.6 ppb).
The monthly average of NO
2concentration depicted seasonal variations particularly in the urban areas, showing higher concentration in winter and lower concentration in summer. Strong locality of NO
2concentration distribution illustrates that the locations near the metropolitan areas (e.g., Gyeonggi and Chungnam provinces) had the highest concentration during the measurement period. A significant positive correlation between NO
xemissions and NO
2concentration was observed, suggesting that the magnitude and proximity to sources of atmospheric nitrogen oxides would be important controlling factors.
Key words
: Nitrogen dioxide(NO
2), Air pollution, Forest area, National monitoring
I. 서 론
대기 중의 이산화질소
(Nitrogen dioxide, NO
2)
는 주로차량의배기가스및난방연료의탄화등의과정 에서 발생하는대기오염물질로서대기중에서일정농 도이상일때인체는물론생태계와자연환경에해로운 영향을 미친다(Kim and Bong, 1998; Carmichael
et al., 2002; Reddy and Venkataraman, 2002).
또한 광 화학반응을통해2
차대기오염물질인오존의생성에기여하는 전구물질이기도 하지만
(Atkins
et al., 1995;
Kim
et al., 2001; Sakugawa, 2004),
그자체로수목의생장저하
,
잎의조직파괴,
토양산성화등산림에생 태적 악영향을 초래하기도 한다(Percy and Ferretti, 2004; Smith, 1990; Yamada
et al., 1996).
산림생태계에미치는 대기 중 질소의영향은 유입 과정에서의성상
(
건성,
습성)
과유입량에따라 일차적 으로달라지며그반응체의종류(
수목,
식생,
토양,
미 생물등)
에따라서도다르게나타난다.
이와관련하여* Corresponding Author : Seungwoo Lee ([email protected])
대기중질소산화물의침적이산림생태계에미치는영 향을규명하고자하는다양한연구가있어왔다
.
이중질소포화
(N saturation)
에대한 산림의반응을분석한연구에서는수종별민감도에따라임목의생장과고사율 이다르게나타나며
,
임목의고사원인중의하나는토양의산성화로인한토양중
Ca:Al
비율의감소라는결과가 있다
(Wallace
et al., 2007).
또한Gundersen
(1999)
은산림생태계에대한질소유입량증가의위험성을 주장하면서
,
질소 유입이 초기에는 임목생장에 도움이되는시비효과로작용하지만이후에는지피식 생의변화,
양분불균형,
토양산성화등의부정적영향을초래한다고보고하였다
.
한편
Lu
et al.(2008)
은 중국을 포함한 몇몇 국가들에서보고된연구자료를종합하여산림의종다양성 감소를 초래하는
3
대 원인 중 하나가 질소강하물의증가라고주장하면서이때문에식물종
,
토양미생물종 및동물종의다양성이위협받을수있음을강조하였다.
또한질소강하물의영향은임목의생장에도관련되는데
, Tolunay(2003)
는 체코에서 이산화질소를 포함한대기오염도가높은지역과낮은지역의임목연륜폭을
비교하여 분석한 결과
, 1985
년부터1998
년까지대기오염의영향을받은지역에서의연륜폭이유의적으로 낮았다고 하였다
.
또한Shan(2000)
은1970
년대 초반 부터시작된일본에서의대면적의소나무림고사및쇠 퇴의원인을늦은겨울과이른봄철의최저기온의급감 이외에도질소강하물에의한내한성감소및생물계절성 의가속화로보고한바있다.
이러한질소강하물의생태 적영향에대한관심은아시아지역에서더욱부각되고 있는데,
이는1961
년에 연간14.4TgN/a
이었던 것이2000
년에는67.7TgN/a, 2030
년에는105,314.4TgN/a
으로 증가할 것으로 예측하고 있기 때문이다
(Zheng
et al.,
2002).
이러한대기중질소산화물에대한국내관측체계를 살펴보면환경부에서전국
71
개도시지역을대상으로 원격감시체계(Tele-Monitoring System)
를통해실시간 으로측정하는것과국립산림과학원에서전국65
개산림지역을 대상으로 확산형 패시브 샘플러
(passive
diffusive sampler)
를이용하여월단위로관측하는것을들수있다
.
이중산림지역은대도시나공단지역에 비해 상대적으로질소산화물배출원이적지만바람에 의해장거리이동되는요인과온실가스의산림내저장 에질소순환이중요하게작용하기때문에지속적인관측이 요구되는 부분이다
(Roger, 2003; de Vries
etal.,
2009).
그러나산림지역에서의이산화질소농도와관련된 선행 연구의 대부분이 유역 규모 또는 지역 규모에국한되어국가규모에서의관측정보가부족한 실정이다
.
따라서본 연구는2002-2009
년간 전국65
개산림지역의고정조사지에대한대기오염도모니터 링결과를토대로산림지역에있어서의대기중이산 화질소의시간및공간적분포특성을도시지역과비교
,
분석하고자하였다.
II. 재료 및 방법
2.1. 연구대상지
산림지역의대기중이산화질소농도를조사하기위
하여 전국을
40×40km
크기의65
개 격자로 나누고각각의격자중심점에서가장인접한산림지역을조사 대상지로하였다
.
전체조사지는소나무,
리기다소나무,
잣나무로구성된침엽수임상만을대상으로하였으며 수령은
3~5
영급에해당하였다.
Fig. 1. The distribution map of the monitoring locations of air pollution in the forest areas.
전체 모니터링 조사지를 도별로 구분해보면 강원
9
개소,
경기7
개소,
경북11
개소,
경남9
개소,
전북6
개소
,
전남11
개소,
충북4
개소,
충남6
개소,
제주2
개소에해당한다
.
이들65
개고정조사지의분포상황은
Fig. 1
과같다.
2.2. 이산화질소농도측정
산림조사지 내 이산화질소의 매월 가중평균농도를 측정하기 위하여
2002
년3
월부터2009
년12
월까지확산형패시브샘플러
(NOB-P01, Envors)
를이용하였다
.
패시브샘플러는대기오염물질의공간분포분석을위해매우유용한 방법으로널리이용되고있다
(Song,
2005; Varshney and Singh, 2003; Yamada
et. al.,
2006).
이를위해 굴뚝 등의인위적인 배출원과근접하지 않도록주의하여 지상으로부터
2 m
높이에 패시브 샘플러를설치하였다
(Sanz
et al., 2007).
도시지 역과의농도비교를위하여환경부의71
개도시지역에 대한 동일기간의월평균이산화질소농도자료를이용 하였다(Ministry of Environment, 2002-2009).
2.3. 전처리및분석
매월수거한패시브샘플러는지퍼백또는바이얼에 담아 냉장 보관한 후 분석에 이용하였다
(Delgado- Saborit
et al., 2006).
대기 중이산화질소포집을 위 해이용한패시브샘플러의흡수제는탄산수소나트륨(sodium bicarbonate)
이었으며,
추출에는 초순수를 이용하였다
.
이때0.5ml
유리바이얼에패시브샘플러흡수여지와초순수
5ml
를담아50~60
oC
수온의초음파세척기에서
20
분간 추출한 후0.45
µm
의 멤브레인 필터(membrane filter, DISMIC-25cs, ADVANTEC)
를 사용 하여여과한시료를국립산림과학원에설치된이온크로 마토그래피(ion Chromatography, S-5200, Sykam)
로 분 석하였다(Korea forest research institute, 2003).
본 연구에서사용한 패시브샘플러를
30
일간 보관 한 공시험 농도는0.27
±0.03ppb(RSD=8.8%)
로서Yim
et al.(2007)
이 보고한 정량한계 농도와 유사한 수준이었다.
2.4. 농도환산
질산이온
(NO
3−)
표준용액(1, 5, 10ppm)
으로보정한후추출한시료의용액상농도
(ppm)
에환산계수(458),
희석배수
,
방치일수 등을 적용하여 기체상태의 농도(ppb)
로환산하였으며 이때이용한산출식은 다음과같다
(Jung
et al., 2002).
시료농도(ppb)=
(1)
2.5. 통계분석
2002
년에서2009
년까지의전국9
개 도의이산화질 소농도와질소산화물(NO
x)
배출량간의상관관계를알 아보고자SPSS
프로그램(11.0)
을 이용하여T-
테스트(pearson correlation)
양측검정을 실시하였고P<0.01
인것을통계적유의성이있는것으로판단하였다
.
III. 결과 및 고찰
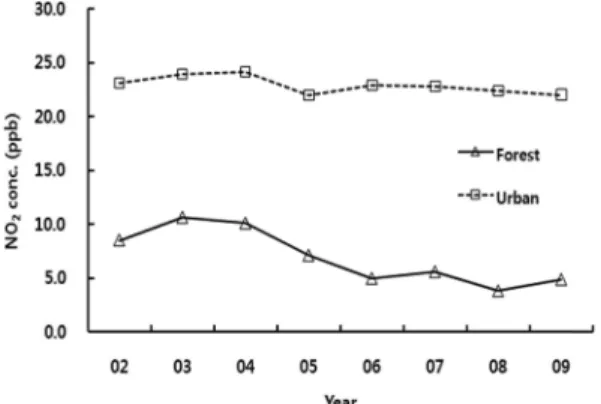
3.1. 연도별농도변화
전국
65
개 산림 조사지에서의대기 중 이산화질소 농도의연차별(2002~2009)
변화를보면2003
년을시작으로 점차 감소하는 추세를 보이고 있다
(Fig. 2).
또한 도시지역의이산화질소농도 또한
2002
년이후 큰차이는아니지만낮아지는경향을보이고있다.
이들산림과도시지역에서보여지는이산화질소농도의
감소추세는
2000
년대에들어서정부의청정연료사용의무화및탈질산화정책으로인하여배출량이감소한 것에기인한것으로판단된다
.
연구기간 동안의 전체
65
개 산림지역에서 관측된 이산화질소의 연평균농도는8.0ppb
이었으며,
유럽연 합에서제시하고있는식생과생태계보호를위한기준 치(14.6ppb, 30
µg/m
3)
와 비교하면 낮은 수준이었다용액상ppm농도×5(추출액량)×환산계수 방치일수 ×24(hr)
Fig. 2. Changes in the annually averaged concentration of ambient nitrogen dioxide (NO2) for the forest areas and urban areas from 2002 to 2009.
(EC Directive, 1999).
이러한 비교는 우리나라를 포 함하여이산화질소의생태적위험수준에대한국가기 준을제시하고있는 지역이없는관계로유럽의기준 에준하였다.
또한동일기간에환경부에서측정한도시지역의연
평균 농도인
19.4ppb
의 약2/5
로 낮은 수준이었다.
이처럼산림지역에서의연평균이산화질소농도는적 정기준농도이하로나타났으나산림의질소포화로인 한 물질 불균형을초래할 수있음을 감안할때산림 건강성에영향을미치는지표로서지속적인관측이요 구된다
.
전술한산림과도시지역간의농도차이는이산화질 소의주요 배출원이주로차량의배기가스인점을고 려할 때
,
도시지역에비해 교통량이상대적으로적은 산림지역의 오염원 특성에 기인한 것으로 판단된다(Sakugawa
et al., 2004).
3.2. 계절별농도변화
산림지역의대기중이산화질소농도의계절적변화
특성을파악하기위해
2002~2009
년간월별자료를평균한 결과
,
월별로는 큰 차이를나타내지않았다(Fig.
3).
계절별 농도는겨울(12~2
월) 3.8ppb,
가을(9~11
월) 3.7ppb,
봄(3~5
월) 3.2ppb,
여름(6~8
월) 2.8ppb
순으로 나타났다.
이처럼 하절기에 이산화질소 농도가 낮은 결과는Lee
et al.(2010)
이보고한산림지역에서의 대 기 중 이산화황(SO
2)
의 계절별 변화와 같은 경향을 보인다.
이러한계절적패턴의유사성은연료사용량이 상대적으로많은동절기와강우희석효과가큰하절기의 계절적특성이이산화질소와이산화황의대기중분포에 동일하게작용하기때문으로판단된다.
이산화질소농도의계절별경향은산림지역에서보
다 도시지역에서 뚜렷하게 나타났다
.
이러한 결과는 대기중의이산화질소가산림지역에비해현저히높은 도시지역에서 하절기강우에 의한 희석 현상이 보다 뚜렷하게나타나기때문으로사료된다.
하절기에이산화질소농도가낮은결과와관련해서
Kurita
et al.(2003)
은여름에녹음이우거져이산화질 소의 흡수 및 흡착 등의 차단작용이 크게 나타나기 때문이라고 보고한 바 있다.
또한Yim
et al.(2007)
은기온이 높은 낮시간대에 고농도로존재하는
OH
라디칼
(radical)
이대기중에서이산화질소와반응하여질산
(HNO
3)
을형성하는과정에서이산화질소의농도를감소시킬수있기때문으로해석하였다
.
이외에도 하절기에 잦은 강우에 의해 대기 중의 이산화질소와 같은 가스상 오염물질이대기 중에 오래 잔류하거나 또는 멀리 확산되지 못하는 기상요인도관련이 있을 것으로판단된다(Zhang
et al., 2006).
한편초겨울에이산화질소농도가높은결과와관련
하여
, Kaneyasu(1994)
는초겨울에이산화질소의농도가높아지는것은광화학반응이주요하게작용하기때 문으로보고하였다
.
물론 겨울철에낮은 혼합고에의해배출된오염물질의확산이원활하게일어나지않기 때문에이산화질소농도가높아지는현상과도관련이있 겠다
(Yim
et al., 2007).
한편Nishikawa
와Kannari
(2010)
는대기중이산화질소농도의계절변화가질소산화물배출량의계절변화와밀접하다는연구결과 를보고하였다
.
이 외에도이상에서언급한이산화질 소의계절별농도변화는이들물질의광화학적반응,
오염물질 배출량
,
장거리 이동성,
강수량 등 다양한 요인에의해영향을받기때문에보다세부적인해석 이요구된다.
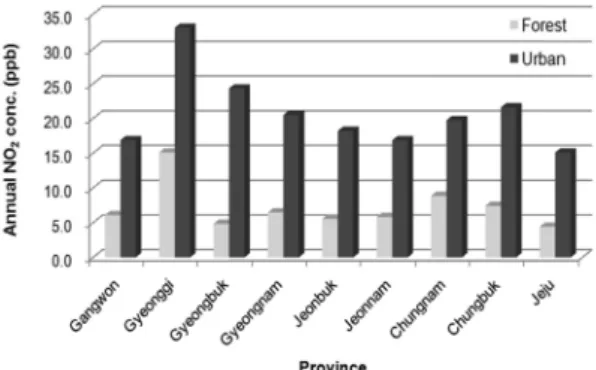
2.3. 지역별분포특성
전체조사지에대한이산화질소농도의지역별분포 경향을파악하기위하여전국
65
개산림지역의이산화 질소의연평균농도를도별로산출한결과(Fig. 4),
경기,
충남
,
경남,
충북,
강원,
전남,
전북,
제주순으로높게나타났다
.
지역평균값이15.1ppb
로가장높았던경기지역은서울과인천등수도권을포함하고있어높은 차량밀도에따른 이산화질소배출량이상대적으로큰 것이 주원인으로판단된다
.
그러나나머지모든 지역이유럽연합에서제시하는생태적제한기준값
(14.6ppb)
보다낮게나타나산림생태계에미치는이산화질소의 Fig. 3. Changes in the monthly averaged concentration of
ambient nitrogen dioxide (NO2) for the forest areas and urban areas from 2002 to 2009.
영향은 이산화질소 발생원이 밀집한 대도시 일부 지역 에 국한되어 발생할 것으로 보여진다. 이러한 산림지 역에서의 지역간 이산화질소의 농도 차이는 도시지역 에서도 유사한 경향을 보였는데, 제주, 강원, 전남 등 의 지역에서 대체로 낮게 나타났다.
전술한 지역별 대기 중 이산화질소 농도 결과가 질 소 배출량과 어떠한 연관이 있는가를 밝히기 위해 통 계자료가 확보된 2002~2009년간의 도별 질소산화물의 연간 배출량과 도별 산림지역 및 도시지역의 연평균 이산화질소 농도간의 관계를 Fig. 5에 나타내었다. 산 림지역과 도시지역 모두에서 대기 중 연평균 이산화질 소 농도와 질소산화물 배출량간의 관계가 통계적으로 유의성을 가진 양의 상관관계를 나타냈다. 변수 간 유 의확률 또한 질소산화물 배출원이 상대적으로 많은 도 시지역(p<0.01)에서 더 높게 나타나 도시지역에서의
대기 중 이산화질소 농도가 질소산화물 배출량에 더 많은 영향을 받음을 알 수 있다. 이러한 결과는 정도 의 차이는 있으나 산림과 도시지역의 대기오염도 수준 이 해당 지역 내 대기오염물질의 배출량과 배출원의 인접도에 따라 영향을 받음을 의미한다.
적 요
전국 65개 산림지역을 대상으로 확산형 패시브 샘 플러를 이용하여 2002년부터 2009년까지 월 단위로 대기 중 이산화질소(NO2) 농도를 측정하고 도시지역에 서의 결과와 비교함으로써 산림지역에서의 이산화질소 농도의 시간적 및 공간적 분포 특성을 규명하였다. 연 구기간 동안 산림 내 NO2의 농도는 서서히 감소하는 경향을 보였으며, 전국 산림의 연평균 농도는 8ppb로 도시지역의 평균값(19.4ppb)과 생태적 기준값(14.6ppb) 보다 낮았다. 계절별로는 NO2의 농도가 산림지역과 도시지역 모두에서 동절기(3.8ppb)에 높고 하절기 (2.8ppb)에 낮은 경향을 보였는데, 도시지역이 더 뚜렷 한 계절변화를 보였. 지역별로는 다른 지역에 비해 수 도권 지역과 인접한 경기와 충남에서 이산화질소의 연 평균 농도가 높게 나타났다. 이러한 지역간 이산화질 소 농도 차이의 원인을 규명하기 위해 질소산화물 배 출량과 이산화질소 농도 간의 상관관계를 분석한 결과, 유의적인 정의 상관성이 나타남에 따라 질소산화물 배 출원의 규모와 근접성이 대기 중 이산화질소의 농도를 결정짓는 중요한 인자임을 시사하였다.
REFERENCES
Atkins, D. H. F., and D. S. Lee, 1995: Spatial and temporal variation of rural nitrogen dioxide concentrations across the United Kingdom.
Atmospheric Environment
29(2), 223-239.Carmichael, G. R., D. G. Streets, G. Calor, M. Amann, M.
Z. Jacobson, J. Hansen, and H. Ueda, 2002: Changing trends in sulfur emissions in Asia: implications for acid deposition, air pollution and climate.
Environmental Science & Technology
36(22), 4707-4713.Delgado-Saborit, J. M., and V. Esteve-Cano, 2006: Field Study of Diffusion Collection Rate Coefficients of a NO2 Passive Sampler in a Mediterranean Coastal Area.
Environmental Monitoring and Assessment
120(1), 327- de Vries, W., S. Solberg, M. Dobbertin, H. Sterba, D.345.Fig. 4. Annually averaged concentration of ambient nitrogen dioxide (NO2) for the forest and urban areas categorized by province from 2002 to 2009.
Fig. 5. Relationship between ambient nitrogen dioxide concentration and NOx emission categorized by province from 2002 to 2009. Data source of NOx emission were from the Ministry of Environment (http://stat.me.go.kr/nesis/index.jsp).
*indicates significant correlation at the 0.05 level, whereas
**indicates significant correlation at the 0.01 level.
Laubhann, M. van Oijen, C. Evans, P. Gundersen, J., Kros, G. W. W. Wamelink, G. J. Reinds, and M. A.
Sutton, 2009: The impact of nitrogen deposition on carbon sequestration by European forests and heathlands.
Forest Ecology and Management
258, 1814-1823.EC Directive, 1999: Council directive 99/30/EC, relating the limit values for sulphur dioxide, nitrogen dioxide and oxides of nitrogen, particulate matter and lead in ambient air. Official Journal of the European Communities L163, 41-60.
Gundersen, P., 1999: Nitrogen status and impacts of nitrogen input in forests – indicators and their possible use in critical load assessment.
Presented at Conference on Critical Loads
, Copenhagen, November 1999.Jung, E. S., S. T. Kim, S. K. Kim, S. M. Hong, and H. S.
Chung, 2002: Preliminary survey for the design of the air pollution monitoring system in antarctic area.
The Institute of Environmental Studies
6, 61-72.Kim, S. D., and C. K. Bong, 1998: A study on distribution of NO2 concentration using the passive sampler in Seoul.
The Journal of Urban Sciences
24(1), 159-164.Kim, S. T., S. G. Kim, H. M. Kim, and E. S. Jung, 2001:
Air Quality Assessment of Industrial Complex Using Passive Sampler.
The Institute of Environmental Studies
5, 67-81.Korea forest research institute, 2003:
Air pollution and forest ecosystem changes by monitoring.
Research Materials 204. 259pp.Kurita, N., N. Iwamoto, T. Yamada, S. Takezaki, N. Maeda, M. Kotajima, 2006: Measurement of nitrogen dioxide in and around experimental station at Tanashi, The University Forests, The university of Tokyo -Effect of urban forest to nitrogen dioxide concentration-.
Miscellaneous Information
-Tokyo University Forests
45, 1-27.Lee, S. W., C. H. Lee, D. H. Ji, and H. J. Youn, 2010: Temporal and spatial distribution of ambient sulfur dioxide concentration in forest areas, Korea.
Korean Journal of Soil Science and Fertilizer
43(6), 1035-1039.Lu, X., J. Mo, and S. Dong, 2008: Effects of nitrogen deposition on forest biodiversity.
Acta Ecological Sinica
28(11), 5532-5548.National Institute of Environmental Research, 2002-2009:
Annual Report of Ambient Air Quality in Korea.
Ministry of Environment.Nishikawa, Y., and A. Kannari, 2010: Atmospheric concentration of ammonia, nitrogen dioxide, nitric acid, and sulfur dioxide by passive method within Osaka prefecture and their emission inventory.
Water, Air, &
Soil Pollution
215(1), 229-237.Percy, K. E., and M. Ferretti, 2004: Air pollution and forest health: toward new monitoring concepts.
Environmental Pollution
130, 113-126.Reddy, M. S., and C. Venkataraman, 2002: Inventory of
aerosol and sulphur dioxide emissions from India:I- Fossil fuel combustion.
Atmospheric Environment
36(4), 677-697.Roger, M. C., 2003: The use of passive sampling to monitor forest exposure to O3, NO2 and SO2: a review and some case studies.
Environmental Pollution
126(3), 301-311.Sakugawa, H., T. Yuhara, and T. Hirakawa, 2004: Behavior and sources of atmospheric ozone, Nitrogen oxides and sulfur dioxide in Yakushima, Japan.
Science Reports
30, 73-85.Sanz, M. J., V. Calatayud, and G. Sanchez-Pena, 2007: Measures of ozone concentrations using passive sampling in forests of South Western Europe.
Environmental Pollution
145(3), 620-628.Shan, Y., 2000: Phenological disorder induced by atmospheric nitrogen deposition: Original causes of Pine forest decline over Japan. Part II.
Water, Air, & Soil Pollution
117, 205-215.Smith, W. H., 1990: Air pollution and forests. Springer- Verlag New York Inc. 117-290.
Song, Y. B., 2005: A study on correlations between distribution of sulfur dioxide concentration and soil environments by using passive samplers.
Journal of Korean Society of Environmental Engineers
27(10), 1025-1029.Tolunay, D., 2003: Air pollution effects on annual ring widths of forest trees in mountainous land of Izmir (Turkey).
Water, Air, and Soil Pollution:Focus
3, 227- Varshney, C., and A. Singh, 2003: Passive samplers for242.NOx monitoring: A critical review,
Environmentalist
23(2), 127-136. DOI: 10.1023/A:1024883620408.Wallace, Z. P., G. M. Lovett, J. E. Hart, and B. Machona, 2007: Effects of nitrogen saturation on tree growth and death in a mixed-oak forest.
Forest ecology and management
243, 210-218.Yamada, E., D. Yoshida, L. C. Hu, and T. Yamada, 1996: A simple measurement method of atmospheric nitrogen dioxide and sulfur dioxide in mountains using passive samplers.
Bunseki Kagaku
45(12), 1083-1088.Yim, B. B., S. T. Kim, J. H. Jung, and B. J. Lee, 2007: Air Quality Monitoring in Daejeon City with Long-Term NO2 and SO2 Passive Diffusive Samplers.
Journal of the Environmental Sciences
16(2), 187-195. (in Korean with English abstract)Zhang, L., R. Vet, and D.V. Michelangeli, 2006: Numerical investigation of gas scavenging by weak precipitation.
Journal of Atmospheric Chemistry
54, 203-231.Zheng, X. H., C. Fu, X. Xu, X. Yan, Y. Huang, S. Han, and G. Chen, 2002: The Asian nitrogen cycle case study.