Introduction
The value of food wastes are economically estimated around 15 billion Korean won (KFRI, 2001). Food wastes have some problems: wasting food sources, environmental pollution such as odor, soil and ground water pollution, and hazardous materials. Moreover we spend extra costs to dispose them. The government made mainly policies on recycling them as feedstuff and compost in agriculture. Though composting is primary means for disposal and composts are applied as nutrient sources for crop production, farmers neglect to use them.
Moreover it is prohibited to feed the recycled feedstuffs to the ruminants such as cattle and sheep (MAF, 2001).
It is difficult to make compost of good quality with food waste due to the high content of water (> 80%) and
sodium chloride (around 3%), aggressive odor during recycling period, and a falling-off in quality from adulteration of leachate and foreign substances. Food wastes are potential pollutants causing secondary environmental pollution i.e., when food wastes are wasted to soil, some hazardous gases such as organic acids, methane and hydrogen sulfide could be generated and soil and groundwater might be polluted by inorganic ions seeping into the soil. In case food waste compost of low quality, though made by composting, is applied to the soil, some negative affects to the crops occur: inhibition of water absorption by osmosis, direct toxicity of sodium or chlorine ion, growth retardation or necrosis resulting from nutritional imbalance by antagonism, restraint of root elongation by impeding moisture movement and aeration in soil due to the deterioration of soil physical properties by dispersion effect of sodium ion in soil (Bernstein, 1975; Bernstein and Hayward, 1958;
Greenway and Munns, 1980; Hayward and Wadleigh,
Received : 23 January 2007 Accepted : 12 February 2007*Corresponding author: Phone : +82312900230, E-mail : [email protected]
Environmental Impacts of Food Waste Compost Application on Paddy Soil
Kyu-Ho So,
*Ki-Seog Seong, Myung-Chul Seo, and Seung-Gil Hong National Institute of Agricultural Science and Technology, Suwon 441-707, Korea
To determine the influence of food waste compost (FWC) application on paddy soil, FWC was applied to the paddy soil and then compared with farmer’s practice as to the effects on rice and soil environment.
Initially, pig manure compost (PMC) had high content of phosphorus (15 g kg
-1) and potassium (23 g kg
-1), while FWC had high content of total nitrogen (13 g kg
-1) and salinity (18.5 g kg
-1). Comparison was also made between chemical fertilizer and FWC use as a trial in the paddy field under the clay loam and sandy loam soil. In the panicle formation stage, chemical fertilizer application was proper in clay loam while PMC application was proper in sandy loam. However, chemical fertilizer produced higher yield compared to compost treatment, both on clay loam and sandy loam with 20~25% and 17~19%, respectively. The lower yield in sandy loam maybe due to slow mineralization of compost such that the crop did not effectively use it. Organic matter content in paddy soil after experiment was higher in FWC and PMC plots compared to that in chemical fertilizer plots. But the other soil properties were comparable. Therefore, the FWC compost had little effect on soil when it use as a trial in paddy field. Likewise, after the application of FWC as a trial, analysis of nitrate nitrogen and ammonium nitrogen in the surface water and 60 cm depth of paddy soil water nine days after planting was done. Results revealed that concentration of ammonium nitrogen was similar to irrigation water while nitrate nitrogen concentration was not detected, and hence did not contribute to water pollution.
It is concluded that the application of FWC in the paddy field had not affected on environmental pollution in the paddy field. But its use as compost during rice culture reduced yield quantity. Such study should include selection of compost material, amount and method of compost application.
Key words: Food waste compost, Paddy field, Growth response, Environmental impact
1949; Shannon, 1997).
However food waste composting is one of the recycling technologies contributing waste reduction and reuse and the compost could be used as nutrients for crop production and soil amendments. And it is related with metabolism like mineralization and immobilization in soil, plays a role of sink and source for soil nutrients (Coleman, 1983), affects crop productivity (Duxbury et al, 1989), improve cation exchange capacity (CEC) and buffer capacity of soil, reduce heavy metal toxicity (Giusquiani et al, 1995 Wong and Ho, 1991), and increase plant health by protection against plant pathogen (Litterick et al, 2004), and so on.
In this study we conducted preliminary experiment by examining the effects of food waste compost on paddy soil environment, ion absorption, and growth and yield of crop to utilize the data for safe, stable agricultural recycling of food waste compost.
Materials and Methods
The paddy rice (Oryza sativa) was cultivated in two soils in Hwasung, Gyonggi province in 2002 and 2003.
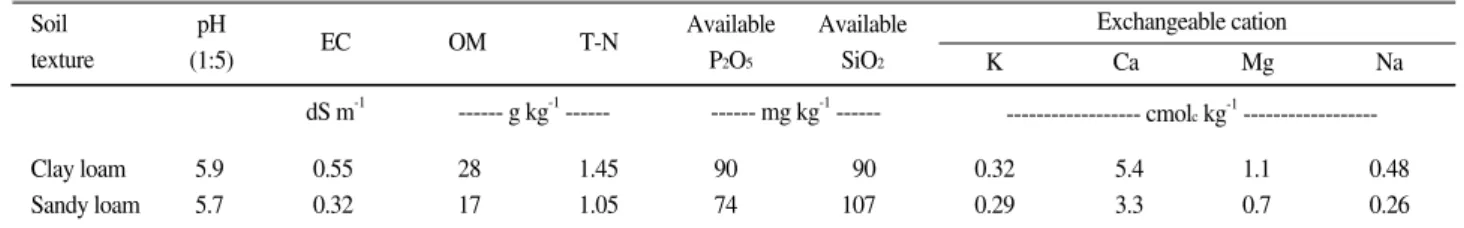
One is Hwadong series (clay loam of Aquic Hapludalfs) and the other is Seogcheon series (sandy loam of Fluventic Haplaquetps). The chemical properties of soil studied were shown in Table 1.
Pig manure compost (PMC), food waste compost (FWC) and combined compost (FWC+PMC) were used and their chemical properties are in Table 2.
The experiment included 5 treatments for paddy rice:
control (NF); chemical fertilizer (CF) according to soil
test and local fertilizer recommendations; pig manure compost (PMC), food waste compost (FWC); and combined compost (FWC+PMC). Composts were applied 1 week before transplantation according to soil test and local fertilizer recommendations by nitrogen contents and then the field applied was immediately rototilled.
Plant height and tiller number were investigated 53 days after transplantation, and leaf color (SPAD 502) was determined at the same time. Yield and other components of paddy rice were done refer to research manual for the farming test (RDA, 1995).
Composts were determined by manufacture and utilization of compost and liquid manure (NIAST, 1999).
The pH and EC of compost was measured using pH meter (Orion 720A+) and EC meter (Orion 145A+), respectively, on 1:10 water extracts. The total nitrogen content of compost and rice straw was determined by distillation method after micro-Kjeldahl digestion. After wet digestion using H
2SO
4-HClO
4, phosphorus was determined by Vanadate method and potassium, calcium, magnesium were determined by ICP (GBC Integra XMP).
Infiltrated water was sampled at interval of one week after setting up the porous ceramic cup (Irrometer Co) at 60 cm depth in the field. Air dried soil sampled before and after experiment was passed into 2 mm sieve and then determined chemical characteristics according to the standard method for soil and plant (NIAST, 2000). The pH and EC of soil and water was measured using pH meter (Orion 720A+) and EC meter (Orion 145A+), respectively. Organic matter content was determined by
Treatment"
PMC FWC FWC+PWC
417 398 425
19.7 13.0 10.2
14.6 18.5 10.0
23.4 14.7 15.6
11.9 12.0 15.0
6.4 1.2 4.0
18.0 18.5 18.2 NaCl MgO
CaO K2O
P2O5 T-N
OM
--- g kg-1---
"
PMC: Pig manure compost, FWC: Food waste compost
Table 2. Chemical properties of PMC, FWC, and PMC+FWC with 50% of moisture content used in the experiment.
Soil texture
Clay loam Sandy loam
5.9 0.55 28 1.45 90 190 0.32 5.4 1.1 0.48
5.7 0.32 17 1.05 74 107 0.29 3.3 0.7 0.26
Na Mg
Ca K
Exchangeable cation
--- cmolckg-1--- Available
SiO2
Available P2O5
T-N OM
EC
dS m-1 --- g kg-1--- --- mg kg-1--- pH
(1:5)
Table 1. Chemical properties of soil before the experiment.
Turin method, available phosphorus by Lancaster method, and total nitrogen content by Kjeldahl digestion, respectively. Soil was extracted by 1N-NH
4OAc solution (pH 7) and then its exchangeable cation was determined by ICP (GBC Integra XMP). Nitrate nitrogen of infiltrated water was determined by Auto analyzer (BRAN + LUEBBEAACS).
Results and Discussion
To find the effects of FWC application to the paddy on growth and yield of rice and environment, plant height, tiller number and leaf color, indirect indicator for assessing nutritional status of plant, were examined (Fig.
1). In case of CF treatment, the plant height, tiller number and leaf color were highest, 47 cm, 26 and 34.2 in clay loamy paddy, and 51.3 cm, 29 and 33.7 in sandy loamy paddy, respectively.
As a result of immobilization of the applied nitrogen by microorganisms at the early growth stage, growth of rice was depressed, however, the rate of productive stems and plant height were increased by the increased nitrogen emission due to the vigorous mineralization (Maeda and Shiga, 1978; Oh and Lee, 1971). The height of rice was
low and the number of tiller was small in FWC, highly resulting from low nitrogen supply due to the low mineralization of nitrogen in food waste compost during growth period. Mineralization rate of urea and organic matter applied differed a little as time goes. Organic acids generated from decomposition of organic matter under anaerobic condition in both paddy and sorption of inorganic ion from/to the soil affected on the rice growth at the early stage.
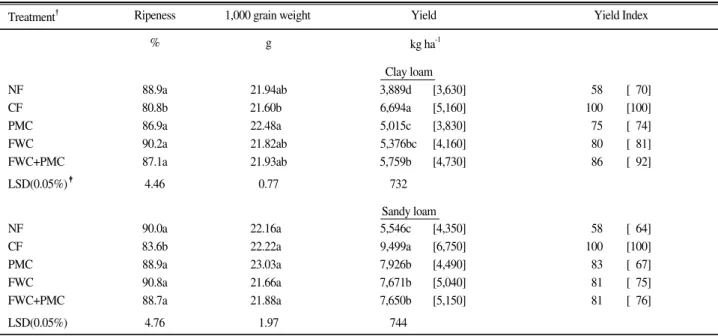
The yield of paddy rice, as shown in Table 3, yields of rough rice in clay loamy paddy were 75% in PMC, 80%
in FWC, 86% in FWC+PMC relative to 6,694 kg ha
-1in CF, while those in sandy loamy paddy were 83% in PMC, 81% in FWC+PMC relative to 9,499 kg ha
-1in CF.
Unlike rice growth at the early stage, the yield was the highest in CF in both paddy soils, mainly result from additional fertilizing such as topdressing affecting on late growth and yield. The yield in compost treatment without additional fertilizing relative to CF was reduced 14~25 % in clay loamy paddy, 17~19 % in sandy loamy paddy, respectively. The low nitrogen fertilization rate of compost did affect on the growth at the late stage and yield of rice. On the contrary, ripening rate and thousand grain weight were relatively higher in slow releasing compost treatment than CF, corresponded with the previous result (Park, 1993).
The yield in sandy loamy paddy was 1,500 kg ha
-1more than that in clay loamy paddy. It comes mainly from the organic acid contents generated from the applied organic matter to the flooded soil (Lee et al, 2000). In particular, some kinds of hazardous material might be generated and accumulated in the soil resulting in inhibiting the function of roots. Hydrogen sulfide is toxic to the rice even 0.1 ppm in hydroponics, inhibits hydrogen oxide of root resulting in controlling the water and nutrients absorbance by limiting respiration. In this case, controlling the absorbance of each element is as follows: K
2O, P
2O
5> SiO
2> NH
4-N, MnO > H
2O >
CaO, MgO (Lee, 1982).
The contents of nitrogen, phosphate, potassium in rice straw at harvesting stage in clay loamy paddy are shown in Table 4. The contents of nitrogen, phosphate, potassium in compost treatment was relatively lower than those in CF. With reference to the mineral nutrients contents in rice straw in sandy loamy paddy, nitrogen content was highest in FWC+PMC, while potassium content in CF was higher than other compost treatment, similar results with the reference that the amount of
Fig. 1. Growth responses of the treatment by soil texture, (a)Clay loamy soil, (b) sandy loamy soil. NF represents no fertilizer, CF represents chemical fertilizer, PMC represents pig manure compost, FWC represents food waste compost and FWC+PMC represents food waste compost combined with pig manure compost.
potassium absorbance of plants have high relation with the yield of rough rice (Park et al, 1984).
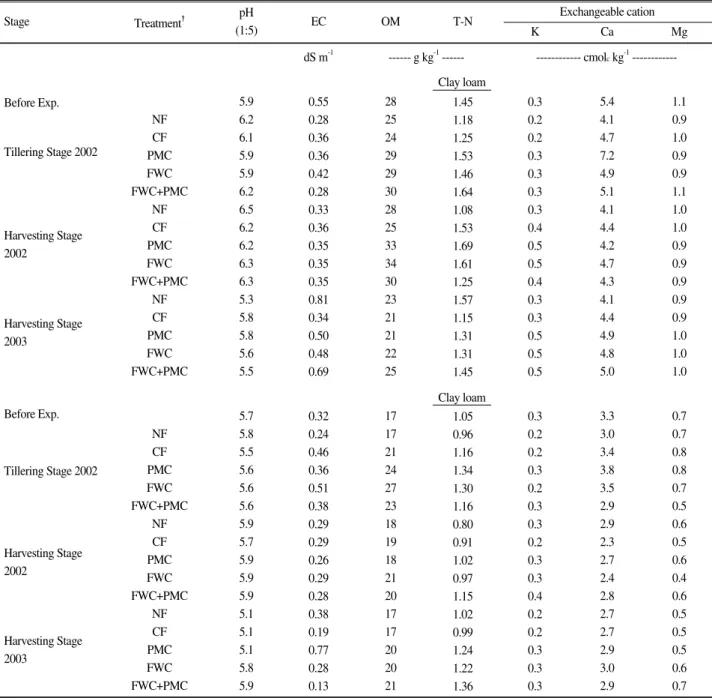
Table 5 shows the results from the analysis to find effects of PMC, FWC, and FWC+PMC on soil chemical properties after two year rice cultivation. Due to the small quantity of organic matter application according to the nitrogen application by soil testing, there were slight differences in organic matter contents among the treatments but insignificant. Two year application was not enough to find changes of soil chemical properties because of small treatment under soil buffering capacity paddy soil has. Therefore, it is necessary that lysimeter
test should be studied in long-term view to find the effects of compost with food waste as feedstock on the rice paddy.
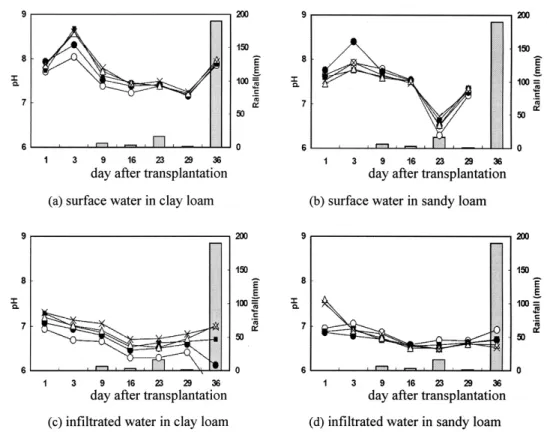
Fig. 2 shows the change of pH in surface and infiltrated (60 cm) paddy water with different treatment of CF, PMC, FWC and FWC+PMC. Directly after transplantation pH in both surface waters increased due to the soil reduction by application. However 9 days after then pH in all treatments was stabilized around 7.
Fig. 3 shows the change of electric conductivity (EC) in surface and infiltrated (60 cm) paddy water with different treatment of CF, PMC, FWC, and FWC+PMC. It is
Treatment"
NF CF PMC FWC FWC+PMC LSD(0.05%)‡
NF CF PMC FWC FWC+PMC LSD(0.05%)
88.9a 80.8b 86.9a 90.2a 87.1a 4.46
90.0a 83.6b 88.9a 90.8a 88.7a 4.76
21.94ab 21.60bb 22.48ab 21.82ab 21.93ab 0.77
22.16ab 22.22ab 23.03ab 21.66ab 21.88ab 1.97
3,889db 6,694ab 5,015cb 5,376bc 5,759bb 732
5,546cb 9,499ab 7,926bb 7,671bb 7,650bb 744
[3,630]
[5,160]
[3,830]
[4,160]
[4,730]
[4,350]
[6,750]
[4,490]
[5,040]
[5,150]
[170]
[100]
[174]
[181]
[192]
[164]
[100]
[167]
[175]
[176]
58 100 75 80 86
58 100 83 81 81
Yield Index Yield
1,000 grain weight Ripeness
%
"
NF: No fertilizer, CF: Chemical fertilizer, PMC: Pig manure compost, FWC: Food waste compost
‡LSD(0.05%)* : significant at 5% level
g kg ha-1
Table 3. Yield and yield components of rice at harvesting with different treatment of chemical fertilizer, pig manure compost, and food waste compost in 2002([ ] represents results in 2003).
Clay loam
Sandy loam
Treatment"
NF CF PMC FWC FWC+PMC
NF CF PMC FWC FWC+PMC
4.01 5.06 2.73 1.98 2.01
3.60 3.42 2.11 4.09 4.31
2.65 2.36 1.68 1.78 2.47
2.06 2.58 1.79 2.36 2.13
16.95 18.78 17.29 18.59 18.21
19.86 23.16 20.25 20.19 18.93
4.87 4.35 4.46 4.31 3.93
4.56 4.16 4.37 4.74 3.91
1.02 1.43 0.97 0.94 1.14
0.92 1.29 1.10 1.10 1.03
0.65 0.60 0.59 0.55 0.58
0.73 0.75 0.56 0.71 0.67 Na2O MgO
CaO K2O
P2O5
T-N
--- g kg-1---
"
NF: No fertilizer, CF: Chemical fertilizer, PMC: Pig manure compost, FWC: Food waste compost Table 4. Nutrient contents of rice straw at harvesting stage.
Clay loam
Sandy loam
natural that EC in treated with chemical fertilizer and compost was higher than NF. EC in the clay loamy paddy was higher than that in sandy loamy paddy due to the high nutrient holding capacity of clay loamy soil. Sudden increase of EC in surface water 36 days after plantation comes from the dispersion of ionic materials on the paddy ground due to the high intensity of rainfall about 189 mm per day.
Fig. 4 shows the change of ammonium-nitrogen contents in surface and infiltrated (60 cm) paddy water with different treatment of CF, PMC, FWC, and FWC+PMC. Ammonium nitrogen contents in surface and infiltrated water in both paddy decreased 9 days after
transplantation. At the early stage after transplantation, ammonium nitrogen in surface water was increased exponentially in both paddies by application of chemical fertilizer. But considering the infiltrated water whose ammonium nitrogen concentration was not increased, ground water was not polluted by infiltration of fertilizer treated.
Fig. 5 shows the change of nitrate nitrogen contents after treatment. Most plow layers of paddy are under reduction condition. Therefore, ammonium nitrogen is dominant but partly nitrate nitrogen. Because nitrate nitrogen is anion, it would not be adsorbed to the soil particles but leached with infiltrated water. The nitrate
Stage
Before Exp.
Before Exp.
Tillering Stage 2002
Harvesting Stage 2002
Harvesting Stage 2002
Harvesting Stage 2003
Harvesting Stage 2003
Tillering Stage 2002
NF CF PMC FWC FWC+PMC
NF CF PMC FWC FWC+PMC
NF CF PMC FWC FWC+PMC
NF CF PMC FWC FWC+PMC
NF CF PMC FWC FWC+PMC
NF CF PMC FWC FWC+PMC
5.9 6.2 6.1 5.9 5.9 6.2 6.5 6.2 6.2 6.3 6.3 5.3 5.8 5.8 5.6 5.5
5.7 5.8 5.5 5.6 5.6 5.6 5.9 5.7 5.9 5.9 5.9 5.1 5.1 5.1 5.8 5.9
0.55 0.28 0.36 0.36 0.42 0.28 0.33 0.36 0.35 0.35 0.35 0.81 0.34 0.50 0.48 0.69
0.32 0.24 0.46 0.36 0.51 0.38 0.29 0.29 0.26 0.29 0.28 0.38 0.19 0.77 0.28 0.13
28 25 24 29 29 30 28 25 33 34 30 23 21 21 22 25
17 17 21 24 27 23 18 19 18 21 20 17 17 20 20 21
1.45 1.18 1.25 1.53 1.46 1.64 1.08 1.53 1.69 1.61 1.25 1.57 1.15 1.31 1.31 1.45
1.05 0.96 1.16 1.34 1.30 1.16 0.80 0.91 1.02 0.97 1.15 1.02 0.99 1.24 1.22 1.36
0.3 0.2 0.2 0.3 0.3 0.3 0.3 0.4 0.5 0.5 0.4 0.3 0.3 0.5 0.5 0.5
0.3 0.2 0.2 0.3 0.2 0.3 0.3 0.2 0.3 0.3 0.4 0.2 0.2 0.3 0.3 0.3
5.4 4.1 4.7 7.2 4.9 5.1 4.1 4.4 4.2 4.7 4.3 4.1 4.4 4.9 4.8 5.0
3.3 3.0 3.4 3.8 3.5 2.9 2.9 2.3 2.7 2.4 2.8 2.7 2.7 2.9 3.0 2.9
1.1 0.9 1.0 0.9 0.9 1.1 1.0 1.0 0.9 0.9 0.9 0.9 0.9 1.0 1.0 1.0
0.7 0.7 0.8 0.8 0.7 0.5 0.6 0.5 0.6 0.4 0.6 0.5 0.5 0.5 0.6 0.7 Mg Ca
K
Exchangeable cation T-N
OM EC
dS m-1 --- g kg-1--- --- cmolckg-1---
"
NF: No fertilizer, CF: Chemical fertilizer, PMC: Pig manure compost, FWC: Food waste compost pH
(1:5) Treatment"
Table 5. Comparison of soil properties by soil texture, stage, and treatment for experiments.
Clay loam
Clay loam
Fig. 2. The change of pH in surface and infiltrated (60 cm) paddy water with different treatment of chemical fertilizer, pig manure compost, and food waste compost. It was symbolized by amount of rainfall in mm ( ), NF (-○○-), CF (-●●-), PMC (-■■--), FWC (-△△--), and FWC+PMC (-××--). NF represents no fertilizer, CF represents chemical fertilizer, PMC represents pig manure compost, FWC represents food waste compost and FWC+PMC represents food waste compost combined with pig manure compost.
Fig. 3. The change of EC in surface and infiltrated (60 cm) paddy water with different treatment of chemical fertilizer, pig manure compost, and food waste compost. It was symbolized by amount of rainfall in mm ( ), NF (-○○-), CF (-●●-), PMC (-■■--), FWC (-△△--), and FWC+PMC (-××--). NF represents no fertilizer, CF represents chemical fertilizer, PMC represents pig manure compost, FWC represents food waste compost and FWC+PMC represents food waste compost combined with pig manure compost.
Fig. 4. The change of NH4-N contents in surface and infiltrated (60 cm) paddy water with different treatment of chemical fertilizer, pig manure compost, and food waste compost. It was symbolized by amount of rainfall in mm ( ), NF (-○○-), CF (-●●-), PMC (-■■--), FWC (-△△--), and FWC+PMC (-××--). NF represents no fertilizer, CF represents chemical fertilizer, PMC represents pig manure compost, FWC represents food waste compost and FWC+PMC represents food waste compost combined with pig manure compost.
Fig. 5. The change of NO3-N contents in surface and infiltrated (60 cm) paddy water with different treatment of chemical fertilizer, pig manure compost, and food waste compost. It was symbolized by amount of rainfall in mm ( ), NF (-○○-), CF (-●●-), PMC (-■■--), FWC (-△△--), and FWC+PMC (-××--). NF represents no fertilizer, CF represents chemical fertilizer, PMC represents pig manure compost, FWC represents food waste compost and FWC+PMC represents food waste compost combined with pig manure compost.
nitrogen contents leached early were 2~3 mg L
-1in clay loamy and 2~5 mg L
-1in sandy loamy, showed relatively high leachable properties in sandy loamy soil. The amount of nitrate nitrogen leachate was gradually decreased and after 9 days there was little leachate.
Because nitrate-nitrogen, main pollutant for surface and ground water pollution, may cause baby's methemoglobinemia (Comly, 1945), the water quality of drinking water in Korea should not exceed 10 mg L
-1. In this study, the amount of nitrogen loss by leaching into groundwater was low applied PMC, FWC, and FWC+PMC. It is interesting that ammonium-nitrogen applied as compost in surface water was run off less than that of chemical fertilizer.
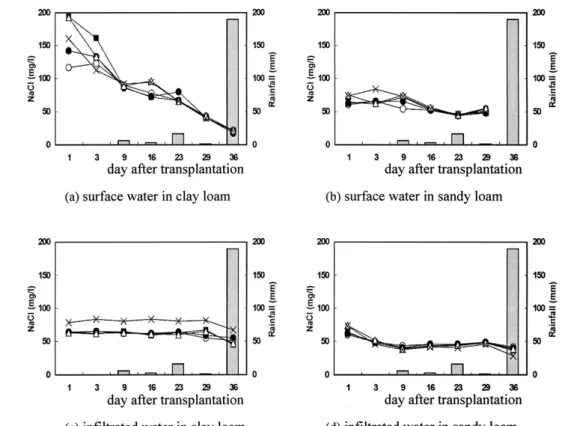
Fig. 6 shows the change of NaCl contents in surface and infiltrated (60 cm) paddy water with different treatment of CF, PMC, FWC and FWC+PMC. The differences of NaCl contents in surface water between the treatments in the early stage after transplantation were decreased and were almost same 3 days after transplantation. Considering the infiltrated water at depth of 60 cm, NaCl contents in early infiltrated water in sandy loamy soils were different with other treatments.
Those treated with the combined PMC and FWC were high in clay loamy soils, while the concentration of Na adsorbed to the soil was relatively low. Totally application of FWC within the criteria by nitrogen would not affect on paddy field environment though it may differ from the application rate.
Conclusion
FWC was applied to the paddy field and then compared with farmer's practice as to the effects on crop and soil environment. To get the yield of similar amounts from CF using compost, we should find the proper amount and application time of compost after examining the rate of nitrogen mineralization in compost. Therefore, it is necessary that lysimeter test should be studied in long term view to find the effects of compost with food waste as feedstock on the rice paddy.
References
Bernstein, L. 1975. Effects of salinity and sodicity on plant growth.
Annu. Rev. Phytopathol. 13:295-312.
Bernstein, L., and H.E. Hayward. 1958. Physiology of salt tolerance.
Fig. 6. The change of NaCl contents in surface and infiltrated (60 cm) paddy water with different treatment of chemical fertilizer, pig manure compost, and food waste compost. It was symbolized by amount of rainfall in mm ( ), NF (-○○-), CF (-●●-), PMC (-■■--), FWC (-△△--), and FWC+PMC (-××--). NF represents no fertilizer, CF represents chemical fertilizer, PMC represents pig manure compost, FWC represents food waste compost and FWC+PMC represents food waste compost combined with pig manure compost.
Annu. Rev. Plant Phys. 9:25-46.
Coleman, D.C., C.P.P. Reid, and C.V. Cole. 1983. Biological strategies of nutrient cycling in soil systems. Adv. Ecol. Res. 13:1- 55.
Comly, H. 1945. Cyanosis in infants caused by nitrates in well water. J. Am. Med. Assoc. 129:112-116.
Duxbury, J.M., M.S. Smith, and J.W. Doran. 1989. Soil organic matter as a source and a sink of plant nutrients, p. 33-68. In D.C.
Coleman et al. (ed.) Dynamic of soil organic matter in tropical ecosystem. University of Hawaii Press.
Giusquiani, P.L., M. Pagliai, G. Gigliotti, D. Businelli, and A.
Benetti. 1995. Urban waste compost: effects on physical, chemical, and biochemical soil properties. J. Environ. Qual.
24:175-182.
Greenway, H., and R. Munns. 1980. Mechanisms of Salt Tolerance in Nonhalophytes. Annu. Rev. Plant Phys. 31:149-190.
Hayward, H.E., and C.H. Wadleigh. 1949. Plant Growth on Saline and Alkali Soils. Adv. Agron. 1:1-38.
KFRI. 2001. Study on assessing the economic value of food waste.
Korea Food Research Institute.
Lee, E.W. 1982. Paddy Rice Farming, 3ed. Hyangmoonsa.
Lee, S.E., H.J. Ahn, S.K. Youn, S.M. Kim, and K.Y. Jung. 2000.
Application effect of food waste compost abundant in NaCl on the growth and cationic balance of rice plant in paddy soil. Korean J.
Soil Sci. Fert. 33:100-108.
Litterick, A.M., L. Harrier, P. Wallace, C.A. Watson, and M. Wood.
2004. The role of uncomposted materials, composts, manures, and compost extracts in reducing pest and disease incidence and severity in sustainable temperature agricultural and horticultural crop production - a review. Crit. Rev. Plant Sci. 23:453-479.
Maeda, K., and H. Shiga. 1978. Relationship between mineralization and nitrogen influenced by various conditions of submerged soils. Soil Sci. Plant Nutr. 24:515-524.
MAF. 2001. MAF Announcement 2001.1.10: Prohibition to feed the foodwaste feedstuffs to the ruminants and punishment. Ministry of Agriculture and Forestry.
NIAST. 1999. Manufacture and utilization of compost and liquid manure for environmental friendly agriculture. National Institute of Agricultural Science and Technology, RDA, Suwon, Korea.
NIAST. 2000. Soil tests and plant analysis. National Institute of Agricultural Science and Technology, RDA, Suwon, Korea.
Oh, W.G., and S.K. Lee. 1971. Studies on the effect of compost and fresh rice straw and paddy yield. Korean J. Soil Sci. Fert. 4:177- 186.
Park, K.B. 1993. Effect of the Whole layer Application of Slow release Fertilizer on Growth and Yield of Rice. Korean J. Crop Sci. 37:499-505.
Park, Y.H., S.B. Ahn, and C.S. Park. 1984. Evaluation of the Parameters of Soil Potassium Supplying Power for Predicting Yield Response, K2O Uptake and Optimum K2O Application Levels in Paddy Soils II. Determination of Potassium Supplying Power by Gapon equation and Kas/Kai and Response to K2O Application. Korean J. Soil Sci. Fert. 17:363-370.
RDA. 1995. Research Manual for the farming test. 3 ed. Rural Development Administration, Suwon, Korea.
Shannon, M.C. 1997. Adaption of plants to salinity. Adv. Agron.
60:75-120.
Wong, J.W.C., and G.E.Ho. 1991. Effects of gypsum and sewage sludge amendment on physical properties of fine bauxite refining residue. Soil Sci. 152:326-332.
염분 함량이 높은 음식물쓰레기 퇴비의 안전한 농업적 활용을 도모하고자, 음식물쓰레기 퇴비를 논에 시용하고 벼를 재배하면서 관행구 등과 비교하여 벼 생육 반응에 미치는 영향과 토양 환경에 미치는 영향 등을 조사하 였다.
시험재료의 성분 함량은 돈분퇴비에서 인산 (15 g kg-1)과 칼리 (23 g kg-1)가 높은 반면 음식물 쓰레기 퇴비에 서는 전질소 (13 g kg-1)와 염분 (18.5 g kg-1)이 높은 재료였다. 논 영향평가는 식양질과 사양질 토양에서 화학 비료 처리를 대조로 돈분퇴비와 음식물 쓰레기 퇴비를 시용하고 추청벼를 재배하며 실시하였다. 벼 유수형성기까 지의 생육은 식양질 논에서는 화학비료 시용구가, 사양질 논에서는 돈분퇴비 시용구가 생육이 양호하였다. 수량 은 두 토양 모두 화학비료 시용구에서 가장 높았고 퇴비 시용구는 식양질 논과 사양질 논에서 각각 20~25 %, 17~19 % 감수하였다. 이와 같이 초기보다 후기에 생육이 부진한 것으로 보아 감수 원인은 퇴비의 무기화가 늦어져 작물에 이용되지 못한 데 있는 것으로 보인다. 시험 후 토양의 성분 함량은 화학비료 처리보다 음식물 쓰레기 퇴비와 돈분퇴비를 시용했을 때 유기물 함량이 약간 증가하는 경향은 있으나, 다른 성분은 별 차이가 없어 이들 퇴비를 논 토양에 시용했을 때의 토양에 미치는 영향은 크지 않은 것을 알 수 있었다. 또한 음식물 쓰레기 퇴비를 시용하고 논 표면수와 60 cm 깊이의 침투수 중 암모니아태 및 질산태 질소를 분석한 결과, 이 앙 9일 째에 암모니아태 질소는 관개수 농도 수준, 질산태질소는 거의 불검출 수준에 가깝게 낮아져 2차 수질 오염에 대한 영향도 크지 않은 것으로 나타났다.
이상을 종합하여 볼 때 음식물쓰레기 퇴비를 논에 시용할 경우, 수질 및 토양 등 환경에 미치는 영향은 적으나 퇴비로만 벼를 재배하면 수량이 감소하였다. 따라서 논에서의 안정적인 음식물 쓰레기 퇴비 시용을 위하여는 퇴비 자재의 선택과 시용량, 시용방법 등에 대해 좀 더 많은 연구가 필요할 것으로 판단되었다.
음식물쓰레기 퇴비 시용이 논토양에 미치는 영향
소규호*·성기석·서명철·홍승길 농업과학기술원