Assessment of Creep-Fatigue Crack Growth for a High Temperature Component
Hyeong-Yeon Lee
†· Jong-Bum Kim
*· Jae-Han Lee
*Korea Atomic Energy Research Institute Daedukdaero1045 , Yusong-gu, Daejeon 305-353, Korea
고온 기기의 크리프-피로 균열성장 평가 이형연, 김종범, 이재한
Key Words : Creep-Fatigue, Crack Growth, RCC-MR A16, Stainless Steel, High Temperature Abstract
An assessment of creep-fatigue crack behavior is required to ensure the structural integrity for high temperature components such as fast breeder reactor structures or thermal power plant components operating at an elevated temperature. In this study, an evaluation of creep-fatigue crack growth has been carried out according to the French assessment guide of the RCC-MR A16 for austenitic stainless steel structures. The assessment procedures for creep-fatigue crack growth in the recent version of the A16 (2007 edition) have been changed considerably from the previous version (2002 edition) and the material properties (RCC-MR Appendix A3) have been changed as well. The impacts of those changes on creep-fatigue crack growth behavior are quantified from the assessments with a structural model. Finally the assessment results were compared with the observed images obtained from the structural tests of the same structural specimen.
.
1. Introduction
As the technologies on the design and assessment of a high temperature component are being improved, the operating temperatures of reactor structures tend to be increased for a higher efficiency. An assessment of a creep-fatigue crack initiation and growth is one of the key factors in the design and evaluation of a high temperature structure such as a Liquid Metal Reactor (LMR), KALIMER(Korea Advanced LIquid MEtal Reactor)[1] subjected to thermal cycles at a creep regime.
The French RCC-MR A16 guide provides assessment procedures for a creep-fatigue crack initiation and growth for an austenitic stainless steel. The recent version of the A16 guide [2] has been considerably
modified for the assessment of creep-fatigue crack growth from the previous version [3]. It should also be noted that the material data of A3 [4] (French RCC-MR code Appendix 3) has been changed as well.
In this study, an assessment of a creep-fatigue crack initiation and growth for an austenitic stainless steel structure has been carried out with the current (2007 edition) and previous (2002 edition) version of the A16 procedure and a comparison of the results according to the two versions is highlighted in this paper. The impact of the changes on creep-fatigue crack behavior (initiation and growth) and the material properties were quantified.
The assessment results have been compared with those of the observed images from a structural test.
2. Assessment of a Creep-Fatigue Crack Initiation
2.1 Creep-fatigue crack initiation
In the RCC-MR code [2,3], the assessment procedure
†
회원,한국원자력연구원 E-mail : [email protected]
TEL : (042)868-2956 FAX : (042)861-7697
* 한국원자력연구원
대한기계학회 2008년도 추계학술대회 논문집
for creep-fatigue crack initiation is based on the sigma- d(σd) method. The principal of this procedure is to determine a stress and a strain at a characteristic distance
‘d’ from a crack tip and to compare them with the material fatigue curve and the creep strength data [5].
The distance ‘d’ is specified as ‘0.05mm’ for austenitic stainless steels [2-5]. This method is based on a stress value at a distance (d=50µm for austenitic stainless steel) ahead of notch or crack-like defects.
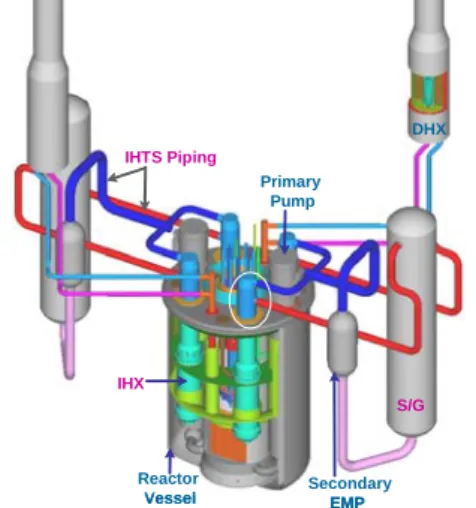
S/G IHTS Piping
Secondary EMP Reactor
Vessel IHX
Primary Pump
DHX
S/G IHTS Piping
Secondary EMP Reactor
Vessel IHX
Primary Pump
DHX
Fig. 1 Sodium-cooled Fast Reactor KALIMER-600 In order to evaluate a creep-fatigue crack initiation, the total strain range according to the A16 guide, (∆ε ) should be determined in advance. The strain range is obtained by adding the strain ranges due to an elasto- plasticity and creep as shown in eq.(1) [2,3].
el pl cr
ε ε + ε
∆ = ∆ + ∆ (1)
Here the elastic-plastic strain range( ∆εel pl+ ) is determined by adding the four strain terms and the creep strain range (∆εcr) is determined for a given hold time during one creep-fatigue load cycle. The creep strain formula for a 316 stainless steel in RCC-MR A3 [4]
employs the Bailey-Norton form of eq. (2).
2 1 1
n c
cr c t
ε = σ (2)
whereC1=4.114 10× −10, C2 =0.4116,n1=3.361. The fatigue crack incubation factor (A) is obtained by a ratio of the specified number of cycles to the number of cycles prior to a fatigue initiation. The creep crack incubation factor (W) is obtained by a ratio of the specified duration of a hold time ‘∆t’ to the time prior to a creep initiation ‘T’ determined from the resultant creep rupture property. If the point for a coordinate for the fatigue damage and creep damage lies within the creep- fatigue interaction diagram, it means that a crack has not been initiated over the creep-fatigue loads under investigation.
P
Fig. 2 Representation model of an IHX support structure
T (oC)
600
t (min)
10 130
90
1 cycle (150min) 150 Hold Time = 2 hr
Load (ton)
50
Cycle (N) 200 250
30
300 40
Fig. 3 Thermal and mechanical loads 2.2 Finite Element Modeling
The structural specimen in Fig. 2 representing an IHX(Intermediate Heat eXchanger) support structure of a liquid metal reactor [1] has a 500mm diameter, a 440mm height and a 6.3mm thickness. A three dimensional half symmetric model was used for the ABAQUS [6] finite element analysis as shown in Fig. 2. The artificial defect was modeled and the bottom surface was fixed rigidly as a boundary condition as shown in Fig. 2..
The model was subject to the creep-fatigue load cycles of Fig. 3. The austenitic stainless steel part of the specimen was heated up to 550°C, held at 550°C for two hours and cooled down to 90°C, and one creep-fatigue load cycle took about 150 minutes as shown in Fig. 3. A total of 300 creep-fatigue load cycles were applied and the mechanical loads were applied in three steps;
applying 30 tons inducing a nominal stress of 29.9MPa at the outer shell for the first 200 load cycles, 40 tons (inducing 39.8MPa) for the next 50 cycles, and finally 50 tons (inducing 49.8MPa) for the next 50 load cycles as shown in Fig. 3.
2.3 Assessment of creep-fatigue crack initiation
The evaluation results of the creep-fatigue crack initiation according to the A16 guide of 2007 edition and 2002 edition are given by eq. (3) and eq. (4), respectively.
( )
316L, 30ton 1610 0n t
A W+ = + ∆ ≤ D
→ (3)
( )
316L, 30ton 1623 4073n t
A W+ = + ∆ ≤ D (4)
100 150 200 250 300 350
0 100000 200000 300000
t (h)
Sr (MPa) 316L (2007Ed.)
316L (2002Ed.)
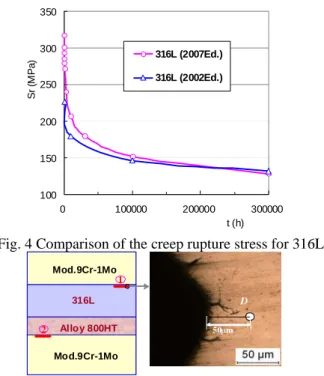
Fig. 4 Comparison of the creep rupture stress for 316L
50µm D 50µm
D Mod.9Cr-1Mo
1
2 316L Alloy 800HT Mod.9Cr-1Mo Mod.9Cr-1Mo 1
2 316L Alloy 800HT Mod.9Cr-1Mo
Fig. 5 Observed image of a defect tip (after 50 cycles) The creep rupture strength (CRS) of 316L in RCC-MR A3 has been modified in the 2007 edition as shown in Fig. 4. It is interesting to note that the CRS has been modified to reduce the conservatism for long-term creep.
The assessment results of eqs (3) and (4) show that the creep rupture time (CRT) has been calculated in a more reasonable way in the 2007 edition while the CRT is overly conservative in the 2002 edition when the results are compared with the observed image of Fig. 5.
3. Assessment of Creep-Fatigue Crack Growth
3.1 Assessment procedure of the A16 guide
The amount of creep-fatigue crack growth in the A16 guide is determined by linearly adding the fatigue crack growth and the creep crack growth. The creep crack growth rate is derived from a C* evaluation based on the reference stress concept and the da/dt- C* material curve.
The assessment procedures of a creep crack growth and fatigue crack growth in the 2007 edition of A16 [2] is considerably modified from those of the 2002 edition in terms of the J-integral and C* integral formula.
3.2 Evaluation of fatigue crack growth (FCG)
The assessment of an FCG requires a calculation of the maximum effective stress intensity factor (SIF) range for an updated size of a defect under a fatigue load as shown in eq. (5).
*
eff s
K q E J
∆ = ⋅ ⋅ ∆ (5)
where q is the closure (R <0) and mean stress (R>0) coefficient, E* is E for the plane stress, E/ 1
(
−ν2)
isfor the plane strain, and R is the minimum to maximum load ratio.
In the A16 guide, the SIF KI for a circumferential defect is given by eq. (6)
( )
I m m b b gb gb
K = σ F +σ F +σ F πc (6) where σ σ and m, b σ are the membrane, bending and gb global bending stresses, respectively, and Fm,Fb and
Fgbare the influence coefficients and c is a half length of a defect.
The J-integrals in the 2007 edition and the 2002 edition under a combined mechanical loading and a thermal gradient are given in eq. (7) and eq. (8), respectively.
(
me * th)
2s el th el
J = J +k ⋅ J (7)
2 me th
me th
me th ref
s el me th el me th
el ref
J J σ J E ε
σ σ
+ +
+ +
⎡ ⎤ ⋅
=⎢ + ⎥
⎢ ⎥
⎣ ⎦ (8)
where
J
elme andJ
elth are an elastically calculated J- integral due to the mechanical and thermal loads, respectively and k is a coefficient providing two th* options (kth*1 for option a and kth*2 for option b) in the Jscalculations. The reference stress σrefme th+ and reference strain εrefme th+ are determined by taking predetermined reference stresses (σrefmeand σrefth ) into account using average tensile curve.
Then the amount of an FCG is determined from eq. (9).
n
i eff
a C K
δ = ⎡⎣∆ ⎤⎦ (9)
where C(=5 10× −8) and n(=3.3) are material constants.
3.3 Evaluation of creep crack growth (CCG)
For the calculation of a CCG, the fracture parameter of C* is determined during the hold time. The amount of a CCG during the given hold time tmi is calculated from eq.
(10) in the 2007 edition and eq. (11) in the 2002 edition.
(
* *)
2*
s th
me th
s C C el
C = C +κ ⋅k ⋅ J (10)
2
* ( )
( )
me th me th
me th ref
s el me th el me th
el ref
E t
C J J
t σ ε
σ σ
+ +
+ +
⎡ ⎤ ⋅
=⎢ + ⎥
⎢ ⎥
⎣ ⎦
&
(11)
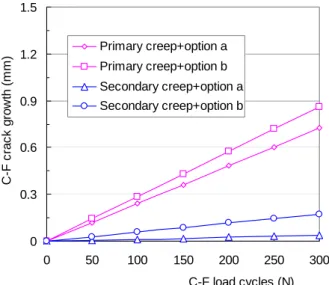
0 0.3 0.6 0.9 1.2 1.5
0 50 100 150 200 250 300
C-F load cycles (N) C-F crack growth (mm) Primary creep+option a
Primary creep+option b Secondary creep+option a Secondary creep+option b
Fig. 6 Assessment results for different options where Csme is the C* integral for the mechanical loads,
th
Jel is the J-integral under the thermal loads and C ti*( ) is the C* integral at time t.
( )
i mi *( ) di t t q
c i t i
a A C t t
δ =
∫
+ ⎡⎣ ⎤⎦ (12)The amount of creep crack growth is calculated from eq. (12) where A (=8.05 10× −2 ) and q(=0.81) are material constants.
As shown in Fig. 6, the assessment results by the 2007 edition show that the combination of a ‘primary creep plus option b’ (for the calculation of fatigue crack growth) gives the highest level of crack growth (upper bound) and the combination of a ‘secondary creep plus option a’ gives the lowest level (lower bound). The combination of a ‘Primary creep plus option a’ and the combination of a ‘secondary creep plus option b’ are located in between the two bounding levels.
Fig. 7 Comparison of results from assessments and test The bounding values in the 2007 edition (in pink color) and those of the 2002 edition (in black color) are shown in Fig. 7. It is shown that the creep-fatigue crack growth in the 2007 edition covers wider ranges than the 2002 edition as shown in Fig. 7.
3.4 Comparison of the assessments and tests
A portable optical microscope was used to observe the creep-fatigue crack behavior of the test specimen with an interval of 50 cycles (hold time=100 hours), intermittently up to 300 cycles.
Fig. 8 Observed image of crack growth (after 300 cycles) Three hundred creep-fatigue load cycles were applied to the present specimen and the images of the specimen surfaces were obtained.
The image in Fig. 5 at the defect shows that no distinct initiation at the D point has occurred. Here an initiation means a cracking up to the location of D from the tip of a defect.
The results from the assessment and test for the creep- fatigue crack initiation show that the assessment for the crack initiation was reasonably conservative when eq.(3) and Fig. 5 are compared, while overly conservative when eq.(4) and Fig. 5 are compared. The actual observation image shows that no initiation has occurred as shown in Fig. 5.
The results from the assessment and test for the creep-fatigue crack growth for the defect were also compared. The observed images in Fig. 8 show that crack growth has mainly occurred as a surface crack type.
When comparing these images with the assessment results of Fig. 8, the evaluation results were shown to be conservative for the present specimen. Similar results were obtained for previous creep-fatigue structural test problems [7-8].
4. Conclusions
An assessment of creep-fatigue crack initiation and growth has been carried out based on the RCC-MR A16 procedure for a structural specimen representing an IHX support structure.
An assessment for a creep-fatigue crack initiation was carried out according to the A16 procedure of the current (2007) edition and the previous (2002) edition of the A16 guide. The impact of the changes in the material properties in RCC-MR A3 was shown to be large, especially for the creep rupture time in 316L stainless steel and the assessment result according to the 2007 edition has shown to give reasonable creep-fatigue crack initiation lifetime while the 2002 edition with a lower creep rupture strength at a short-term hold time and a higher creep rupture strength at a long-term hold time was overly conservative.
0 0.3 0.6 0.9 1.2 1.5
0 50 100 150 200 250 300
C-F load cycles (N)
C-F crack growth (mm)
A16 ('07 Ed) - Upper Bnd A16 ('07 Ed) - Lower Bnd A16 ('02 Ed) - Upper Bnd A16 ('02 Ed) - Lower Bnd Test
An assessment for a creep-fatigue crack growth was carried out with the 2007 and 2002 editions of the A16 guide as well. The assessment results revealed that the creep-fatigue crack growth with the combination of a primary creep law (in creep crack growth) plus option (b) (in fatigue crack growth) gave upper bound of creep- fatigue crack growth while the combination of a secondary creep law plus option (a) gave lower bound in creep-fatigue crack growth. It was shown that the range between the upper and lower bounds in the assessment of creep-fatigue crack growth was wider in 2007 edition than that in the 2002 edition.
When compared with the structural test results, the assessment results for creep-fatigue crack growth were shown to be reasonably conservative.
Acknowledgements
This study was supported by the Korean Ministry of Education, Science & Technology through its National Nuclear Technology Program.
References
[1] Hahn, D-H et. al., 2007, KALIMER-600 Conceptual Design Report, KAERI/TR-3381, Korea Atomic Energy Research Institute, Daejeon.
[2] RCC-MR, Section I Subsection Z, Technical Appendix 16, 2007, Design and Construction Rules for Mechanical Components of Nuclear Installations, 2007 Edition, AFCEN.
[3] RCC-MR, Section I Subsection Z, Technical Appendix 16, 2002, Design and Construction Rules for Mechanical Components of Nuclear Installations, 2002 Edition, AFCEN.
[4] RCC-MR, Section I Subsection Z Technical Appendix A3, 2007, Design and Construction Rules for Mechanical Components of Nuclear Installations, 2007 Edition.
[5] Moulin,D., Drubay,B., Acker,D., 1995, “A Practical Method Based on Stress Evaluation (σd criterion) to Predict Initiation of Crack under Creep and Creep Fatigue Conditions,” Journal of Pressure Vessel Technology, Transactions of ASME, Vol .117, pp.
335-340.
[6] ABAQUS Users manual, Version 6.7, 2007, H.K.S, USA.
[7] Lee, H-Y, Lee, S-H., Kim, J-B, Kim, Lee, J-H., 2007,
“Creep-fatigue damage for a structure with dissimilar metal welds of Mod 9Cr-1Mo and 316L stainless steel,” International Journal of Fatigue, 29, pp. 1868~1879.
[8] Lee, H-Y, Kim, J-B, Kim, S-H, Lee, J-H., 2006,
“Assessment of Creep-Fatigue Crack Initiation for Welded Cylindrical Structure of Austenitic Stainless Steels,” International Journal of Pressure Vessel and Piping, 83: pp.826~834.