3원 변량분석을 이용한 구분적으로 일정한 모델의 에너지 함수 최소화를 위한 매개변수들 추정
The Estimation of Parameters to minimize the Energy Function of the Piecewise Constant Model Using Three-way Analysis of
Variance
주기세*, 조덕상*, 서재형*
Ki-See Joo*, Deog-Sang Cho*, and Jae-Hyung Seo*
요 약
영상분할 결과는 알고리즘에 관련된 매개변수들에 따라 다르기 때문에 최적 분할을 위하여 시행 착오법이 많이 이용된다. 본 논문에서는 3차원 변량 분석법을 이용하여 영역기반 active contour 방법에 관련된 최적 매 개변수들을 결정하는 방법을 제안한다. 3원 변량 분석법에 의해서 추출된 결과와 사용자가 영상에서 직접 그린 결과가 상호 비교된다. 마지막으로 각 매개변수들의 주요 효과와 상호작용 효과를 측정하고 최적 값을 추출하 기 위하여 점 추정 및 구간 추정 값을 계산한다. 본 논문에서 제안한 방법은 구간 상수 모델을 대상으로 영상 분할시 최적 매개변수들을 추출하는데 큰 도움을 줄 것이다.
Abstract
The result of imaging segmentation becomes different with the parameters involved in the segmentation algorithms; therefore, the parameters for the optimal segmentation have been found through a try and error.
In this paper, we propose the method to find the best values of parameters involved in the area-based active contour method using three-way ANOVA. The segmentation result applied by three-way ANOVA is compared with the optimal segmentation which is drawn by user. We use the global consistency rate for comparing two segmentations. Finally, we estimate the main effects and interactions between each parameter using three-way ANOVA, and then calculate the point and interval estimate to find the best values of three parameters. The proposed method will be a great help to find the optimal parameters before working the motion segmentation using piecewise constant model.
Key words :3원 변량분석(Three way ANOVA), 영상 분할(Image segmentation), 구간 상수 모델(Piecewise constant model), 주 효과(Main effect), 상호작용 효과(Interaction effect)
* 목포해양대학교 해상운송시스템학과(Department of International Maritime Transportation Science, Mokpo National Maritime University) ‧ 제1저자 (First Author) : 주기세
‧ 투고일자 : 2012년 1월 28일
‧ 심사(수정)일자 : 2012년 8월 22일 (수정일자 : 2012년 10월 17일) ‧ 게재일자 : 2012년 10월 30일
I. Introduction Image segmentation is defined as the process that subdivides an image into its constituent parts and
extracts interested objects. Image segmentation is an important role in image analysis, such as object representation and feature extraction. Segmentation methods are thresholding or clustering, edge-based segmentation and region-based segmentation etc. In particular, active contour method which is resulted from the work of Kass, Witkin, and Terzopoulos[1] is highlighted in the medical image processing. Active contour models are classified edge-based models and region-based models.
Edge-based models[1-5] find contours by minimizing the edgy function which depends on its shape and location within the image. The energy function is composed of a weighted combination of internal and external forces and stopping term. Edge-based models segment only the limited region in the image; therefore, these models depend on other mechanisms like interaction with a user.
Area-based models[6-10] also look for the contours by minimizing the energy function. These models have the features such as the fact that stopping term does not depend on the gradient of the image, and the initial curve which can start anywhere in the image is quickly evolved by an average variation of the inside and outside curve.
These energy functions involve the scale parameters which contribute to drive the zero level set toward the object boundaries and to penalize the deviation of from a signed distance function during its evolution. As the values of parameters change, the results of segmentation are also varied. Hence, to find the optimal values, the values of parameters are repeatedly altered by users. If the parameters are optimal values, it is able to minimize the energy function.
It is difficult to compare and evaluate the results of various segmentations. Martin et al.[11] quantify the consistency between segmentations and find that different human segmentations of the same image are highly consistent. Heath et al.[12] performed the work for evaluating edge detection algorithms. Hoover et al.
[13] proposed a methodology for evaluating range image segmentation algorithms.
In this paper, it is proposed to find the values of optimal parameters to minimize the energy function of the piecewise constant model using three-way analysis of variance(ANOVA) which refers to an additive decomposition of data into a grand mean, main effects, possible interactions, and an error term. We consider a quantitative measure for comparing two segmentations and three parameters the weight of energy in the contour(), the weight of outside energy in the contour ( ), and the step size for the update of the level set function() which have the greatest effect to minimize the energy function of the piecewise constant model.
Then, we evaluate the main effects and interactions of three parameters.
An outline of the paper is as follows. In Section 2 we briefly review on piecewise constant model. In Section 3 we introduce three-way analysis of variance modeling to find the optimal parameters. In Section 4 we compare and analyze the effects of parameters using three-way ANOVA and show the results of segmentation in Visible Human image. Finally, in Section 5 we end with a conclusion.
Ⅱ. Piecewise Constant Model
In first, let’s define the image domain as ⊂ and note the desired contours in an image by . We also describe that and are the inside and outside of respectively. In [9], to find the desired contours, Vese and Chan simplified the restriction of the Mumford-Shah function to piecewise constant function u. Vese and Chan is made up of the fitting term and some regularizing terms for the construction of . Some regularizing terms are given by the area inside and the length of . This energy function[8] is written as
∇
(1)
where is the level set function, , , , and are nonnegative constants, and the constants and are the average of image intensities in the region inside and outside of the contour respectively. These are defined by
,
The Heaviside function H and the dirac function are defined as
i f ≥
i f and
In order to compute the Euler-Lagrange equations we adopt a gradient descent approach and arrive at
∇·∇
∇ (2)
Where the curvature term ∇ · ∇∇
can smooth the level set function by positive parameter
and is a positive approximation of the delta function defined as
(3)
Then, using Euler-Lagrange equations we can update
by
(4) where is some small positive constant and
∇ · ∇∇ .
Ⅲ. Three-Way Analysis of Variance Model
We evaluate the main effects and the interactions of parameters to find optimal segmentation using the energy function (1) of the piecewise constant model and three-way ANOVA. We first define a quantitative measure for comparing two segmentations of an image.
A segmentation consistency measure takes two segmentations , as input and produces a real-valued output in the range of 0 to 1, where 1.0 means complete consistency. We define that B(S) is the set of pixels corresponding to segmentation . A Global Consistency Rate (GCR)[14] is defined as:
m in (5)
where the is the optimal segmentation which makes preliminary arrangement by user, is segmentation found by piecewise constant model, and
is local refinement rate defined as
∩ (6)
Let denote for comparing optimal segmentation with which depends on three parameters , , and in equation (4), where
, , and are levels of , , and respectively.
Data can be then described by an ANOVA model including three main effects (, , and ) and the
interactions :
(7)
∼
where ⋯, ⋯,
⋯, and is the grand mean. The main effect represents the weight of energy in the contour.
The main effect represents the weight of outside energy in the contour. The main effect expresses the step size for the update of . The interaction
is the effect of combination between inside and outside energy in the contour, is the effect of combination between the inside energy in the contour and the step size, and is the effect of combination between outside energy in the contour and the step size. The error term represents the residual variation due to iteration. The data ranges of main effects , , and are given by ≤ ,
≤ , and ≤ respectively.
IV. Implementation and Result
In this section, the optimal values of three parameters
, , and are found by using the three-way ANOVA. For segmentation using piecewise constant model, it is performed on a PC with Pentium 4 processor, 2.90GHZ, 2GB RAM, with Visual C++ on Windows XP, using same parameters of
× and .
We first arrange the optimal segmentation for comparing the segmentation calculated by piecewise constant model. We extract the optimal segmentation by using piecewise constant model, for which we set
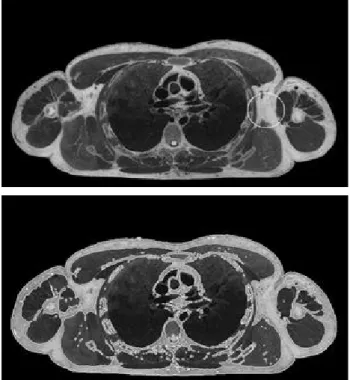
, , and , and the given image is a cross section of a human body around chest in Fig. 1. Then we extract the segmentation while
changing three parameters , , and of the energy function (1) in the given range. The GCR is calculated to compare the optimal segmentation with new extracted segmentation.
In Fig. 2, we show the results of piecewise constant model set as that three parameters are different values.
In the first row of Fig. 2, the result of piecewise constant model given by , , and
is hardly close to the optimal segmentation by GCR=0.07235. In the third row of Fig. 2, the result of piecewise constant model given by , , and is nearly close to the optimal segmentation of GCR=0.953178.
그림 1. 시각화한 인간영상의 분할 . 첫 번째 행:
초기 윤곽; 두 번째 행: 구간 상수 모델을 이용한 결과( , , and ). Size=434☓252.
Fig. 1 Segmentation of the visible human image.
1st column: The initial contour; 2nd column: The result using piecewise constant model( ,
, and ). Size=434☓252.
그림 2. 구간 상수 모델을 이용한 시각화한 인간영상의 분할 결과들 . 첫 번째 행: , ,
, GCR=0.07235. 두 번째 행: ,
, , GCR= 0.541545. 세 번째 행:
, , , GCR=0.953178.
Fig. 2 Segmentation results of the visible human image using piecewise constant model. 1st column:( , , , GCR=0.07235).
2nd column: ( , , , GCR=
0.541545). 3rd column: ( , , , GCR=0.953178).
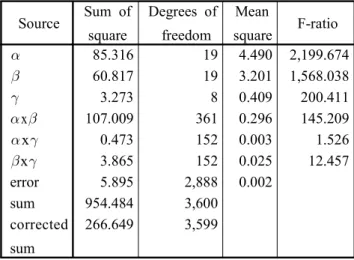
The result of three-way ANOVA for three parameters
, , and is expressed in Table 1. The F-ratio of three parameters and interaction x in Table 1 represent to be a considerably significant difference according to changing the level of three parameters for the GCR. The F-ratio of the interaction x and x
also shows to be a significant difference. In Fig. 3, 4,
and 5, we show the significance of interactions x, x and x, respectively. In order to find the largest GCR in the mixing level , we calculate the point and interval estimates. The point estimate shows the largest GCR in , , and
as in Table 2. In 95% confidence interval yields 114 mixing levels, and produces 4 level mixing in the largest GCR=1.0 as shown in Table 3.
표 1. 반복 없이 20 가지의 , 20 가지의 , 9 가지의 값을 이용한 3원 변량분석. 종속변수: GCR Table 1. Three-way analysis of variance for data on 20 alpha (), 20 beta (), and 9 gamma () with no replication.
Dependent Variable: GCR Source Sum of
square
Degrees of freedom
Mean
square F-ratio
85.316 19 4.490 2,199.674
60.817 19 3.201 1,568.038
3.273 8 0.409 200.411
x 107.009 361 0.296 145.209
x 0.473 152 0.003 1.526
x 3.865 152 0.025 12.457
error 5.895 2,888 0.002
sum 954.484 3,600
corrected sum
266.649 3,599
표 2. 최적 수준인 , , and 로 조합 했을 경우의 점 추정 과 구간 추정.
Table 2. Point estimate and interval estimate in optimal level mixing , , and .
Point estimate
95% Confidence interval Lower bound Upper bound
0.983365 0.943966771 1.0
표 3. GCR = 1.0일 때의 최적 조건들
Table 3. The optimal conditions when GCR=1.0 Parameters
0.5 0.3 0.1
1.0 0.6 0.1
1.5 0.9 0.1
2.0 1.2 0.1
그림 3. 와 사이의 상호 교호 작용.
Fig. 3 Interaction between and .
그림 4. 와 사이의 상호 교호작용.
Fig. 4 Interaction between and .
그림 5. 와 사이의 상호 교호 작용.
Fig. 5 Interaction between and .
V. CONCLUSION
In this paper, it proposes the method to find optimal conditions of three parameters , , and involved in the piecewise constant model using three-way ANOVA, where three parameters are main effects which have the greatest effect to minimize the energy function. The optimal segmentation in an image is drawn by user before finding the best conditions. This research is used the global consistency rate for comparing the optimal segmentation with new calculated segmentations. The result of three-way ANOVA was able to find the best conditions of three parameters which are close to the optimal segmentation. The proposed method will be a great help to find the optimal parameters before working the motion segmentation by using the piecewise constant model.
REFERENCES
[1] M. Kass, A. Witkin, and D. Terzopoulos. Snakes: active contour models. Int’l J. Comp. Vis., 1:321-331, 1987.
[2] C. Xu and J. Prince. Snakes, shapes, and gradient vector flow. IEEE Trans. Imag. Proc., 7:359-369, 1998.
[3] C. Li, C. Xu, C. Gui, and M. D. Fox, Level set evolution without re-initialization: A new variational
formulation. In IEEE Conference on Computer Vision and Pattern Recognition(CVPR)., volume 1, pages 430-436, 2005.
[4] C. Li, J. Liu, and M. D. Fox. Segmentation of external force field for automatic initialization and splitting of snakes. Pattern Recognition, 38(11):1947-1960, 2005.
[5] C. Xu and J. Prince. Snakes, shapes, and gradient vector flow. IEEE Trans. Imag. Proc., 7:359-369, 1998.
[6] Cremers, D. A multiphase level set framework for variational motion segmentation. In Scale Space Methods in Computer Vision, L. D. Griffin and M.
Lillholm (Ed.) vol. 2695 of Lecture Notes in Computer Science, Springer, Berlin, pp. 599–614. 2003.
[7] T. Chan and L. Vese.Active contours without edges.
IEEE Trans. Imag. Proc., 10(2):266-277, 2001.
[8] L. Vese and T. Chan. A multiphase level set framework for image segmentation using the mumford and shsh model. Int’l J. Comp. Vis., 50:271-293, 2002.
[9] A. Tsai, A.Yezzi, A.Willsky.Curve Evolution Implementation of the Mumford-Shah Functional for Image Segmentation, Denoising, Interpolation, and Magnification. IEEE Transactions on Image Processing, vol. 10, no. 8, pp. 1169-1186, August 2001.
[10] C Li, CY Kao, JC Gore, Z Ding. Implicit Active Contours Driven by Local Binary Fitting Energy.presented at the IEEE Conf.
Computer Vision and Pattern Recognition, 2007.
[11] D Martin, C Fowlkes, D Tal, and J Malik. A database of human segmented natural images and its application to evaluating segmentation algorithms and measuring ecological statistics.in Proc. IEEE Int'l. Conf.
ComputerVision, Vancouver, Canada, July 2001.
[12] M. D. Heath, S. Sarkar, T. Sanocki, and K.W.
Bowyer. A robust visual method for assessing the relativeperformance of edge-detection algorithms.
PAMI, 19(12):1338–1359, 1997.
[13] A. Hoover, G. Jean-Babtiste, X. Jiang, P. J. Flynn, H.
Bunke, D. B. Goldgof, K. Bowyer, D. W. Eggert,A.
Fitzgibbon, and R. B. Fisher. An experimental comparison of range image segmentation algorithms.
IEEE PAMI, 18(7):673–689, Jul. 1996.
[14] Statistics II : ANOVA and regression : course notes,
Cary, NC : SAS Institute, 2005.
주 기 세(Ki See Joo)
1988. 2: Hanyang Univ. Industry Engineering(BE)
1992. 2: Texas A&M Univ. Industry Engineering(ME)
1996. 2: Korea Univ. Industry Engineering(Ph. D)
1997.3 - Present: Mokpo National Maritime Univ.
Concern Field : Image Processing, Material Automation
서 재 형(Jae-Hyung Seo)
1993. 2: Dongguk Univ. Electronic Engineering(BE)
1993. 3 ~ 1998. 6: Hyundai Motor ITS Team
1999. 3 ~ 2006. 5: S&A Tech.
Representative Director
2006. 5 ~ 2010. 4: Getron Electronic-Circuit Systems Department/Head of Research Center
2010. 5 ~ Present: Taesung Electronic-Circuit Systems Research Center(Director)
Concern Field : Image Processing, Signal Processing, Sensor Engineering, System Engineering
조 덕 상(Deog-Sang Cho)
1991. 2: Yonsei Univ. Electronic Engineering(BE)
2010. 8: Mokpo National Maritime Univ. Maritime Transportation Department(ME)
1991. 2 ~ 1998. 6: Hyundai Electronic Industry Electronic Research Center(Researcher)
1999.6. 6 ~ 2001. 6: JBE KOREA Researcher 2001. 7: Argus Establishment/ Representative Director 2007. 7: Argus listed company in KOSDAQ 2009. 7: Argus Representative Director Retirement Concern Field : Signal Processing, Image Processing