JESK
http://jesk.or.kr eISSN:2093-8462Office Environment and Musculoskeletal Complaints of Office Workers
Myoung Hwan Park, Sangbok Lee, Byung Yong Jeong
Department of Industrial and Management Engineering, Hansung University, Seoul, 02876
Corresponding Author Sangbok Lee
Department of Industrial and Management Engineering, Hansung University, Seoul, 02876
Phone : +82-2-760-8048 Email : [email protected]
Received : November 20, 2015 Revised : November 23, 2015 Accepted : November 26, 2015
Objective:This study aims to investigate the correlation between office and work environment satisfaction levels and workers' musculoskeletal symptoms by conducting surveys asking office workers to state their musculoskeletal symptoms and office and work environment satisfaction levels.
Background: The increased number of office workers and their indoor work hours using computers have led to new understandings of the importance of office environment including its temperature, humidity, noise levels, lighting and quality of air, and work environment including monitor arrangement, space arrangement and the functions of desks and chairs.
Method: Specific details on office work, office environment satisfaction levels, work environment satisfaction levels, musculoskeletal symptoms, absence from work and treatment due to musculoskeletal related symptoms were analyzed based on the survey answers given by 397 office workers who were the subjects of this research.
Results: Office workers showed different characteristics of musculoskeletal symptoms depending on their gender, age, work experience, office hours, break time and time spent on computers. Also, differences in symptoms were found for workers’with different satisfaction levels for office environment (temperature, humidity, noise levels, quality of air, lighting) and work environment (location of monitors, area and display of office space, chairs and desks). ANOVA shows the differences between groups of subjects classified by the experience of work-absences and treatments or pain complaints.
Conclusion and Application: Relationship between workers' satisfaction levels with the office and work environment and their musculoskeletal symptoms is expected to be served as essential data for systematic management of the workplace.
Keywords: Office workers, Work-related musculoskeletal disorders, Office environment, Work environment
Copyright@2015 by Ergonomics Society of Korea. All right reserved.
○ccThis is an open-access article distributed under the terms of the Creative Commons Attribution Non-Commercial License (http://
creativecommons.org/licenses/by-nc/3.0/), which permits unrestricted non-commercial use, distribution, and reproduction in any medium, provided the original work is properly cited.
1. Introduction
Nowadays, modern people mostly spend time in offices a day. As the ratio of office workers increases, and time to spend in offices accounts for most daily life, the office space demands pleasantness as well as office work efficiency (Jeong et al., 2015; Jeong and Yoon, 2014; Yoon, 2014).
Previous studies on the office environment include Relations between Office Environment and Work Environment Satisfaction Levels and Building Syndrome (Jeong
et al., 2015), Effects of Indoor Air Quality on Health (Burge et al., 1987; Burge, 2004; Li and Yang, 2004; Kwon and Park, 2007), Relationship between Utilization Hours of Office Facility and Building Syndrome (Jaakkola and Jaakkola, 1999), Correlation between Computer Work Hours and Building Syndrome (Kubo et al., 2006), and Relations between VDT Syndrome and Office Environment (Jeong et al., 2009; Sim and Lee, 2008). Studies on Relations between Office Environment and Musculoskeletal Symptoms include Effects of Building Syndrome on Musculoskeletal Symptoms (Bachmann and Myers, 1995), Improvement of Chairs and Musculoskeletal Symptoms (Nelson and Silverstein, 1998), Correlations between Hospital Workers' Complaints on Environmental Factors and Musculoskeletal Disorders (Magnavita et al., 2011), Effects of Low Temperature and Insufficient Lighting for Computer Users (Tint et al., 2012), and Presentation of Measures according to Musculoskeletal Symptoms by Body Part Caused by Computer Work Hours (Lee and Koo, 2015).
To sum up the studies on office workers and office environment, focus is on the relations between the characteristics of office and work environments and subjective symptoms of building syndrome, VDT syndrome, pain complaints of musculoskeletal system, subjective satisfaction levels, productivity and job stress. However, this study addresses what effects do satisfaction levels and musculoskeletal pain complaints have according to design factors of the office environment and office space, except subjective symptoms related with building syndrome.
For the pleasant office environment, it is important to enhance office workers' health protection and work efficiency through the management of various factors such as lighting, noise, air environment and office space (Passarelli, 2009). In this regard, this study investigates the following: General work characteristics of office workers working long hours in the offices of public agencies (age, gender, office work hours, break time, work experience (length of service), computer-work hours), and the satisfaction levels on the office environment (temperature, humidity, noise level, air quality and lighting), work environment (monitor arrangement, personal space area & passage arrangement, chairs and desks), and musculoskeletal pain complaints by body part that result in absences from work and treatments.
2. Methods
This study conducted a questionnaire survey on musculoskeletal symptoms and subjective symptoms of body parts targeting the office workers at the offices of public agencies. This study aims to classify office workers complaining musculoskeletal symptoms, and analyze symptoms, work characteristics and satisfaction levels on environment.
The questionnaire survey was carried out targeting 483 office workers of 18 public agencies with satisfaction levels and recognition on the office environment. This study actually analyzed 397, the respondents of the survey in their 30s, 40s and 50s, except those workers with less than five years in the length of service, and those in their 20s.
The details of the questionnaire survey are presented below: General matters (building stories, department, age, gender, office work hours, break time, position, length of service and computer-work hours), the adequacy of office environment (temperature, humidity, noise, air quality and lighting), work environment (monitor arrangement, personal space area & passage arrangement, and chairs and desks), experience of pain/symptom complaints of work-related body parts (neck, shoulder, arm, hand, waist and leg), the intensity, frequency and duration time of pain/symptoms, and experience of absences/treatments due to musculoskeletal symptoms.
In this study, the independent variables were the general characteristics of office workers (gender, age, length of service, work hours, break time and computer-work hours), office environment characteristics (temperature, humidity, noise, air quality and lighting), work environment characteristics (monitor, area, chairs and desks), and aggregate office satisfaction levels. The dependent variables were office workers with pain, office workers without pain and pain body part of office workers with pain. A comparative analysis was carried out on whether differences existed by office workers with/without pain and body part with pain according to
general, office environment and work environment characteristics, and aggregate office work satisfaction levels. Through ANOVA, this study classified office workers with pain experience due to musculoskeletal symptoms, those without pain experience and those with experience of absences/treatments. And this study took into account them on the basis of p<0.05 in order to test whether there were the differences of means in general, office environment, work environment characteristics and aggregate office work satisfaction levels.
3. Results
3.1 Subjective conformance for office environment
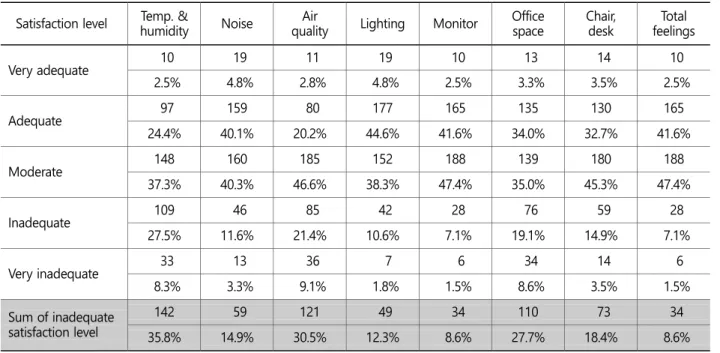
Table 1 sows the subjective conformance level for office environment and work environment of 397 respondents. From Table 1, the respondents who answered "adequate" for aggregate environment satisfaction levels were 44.1%, higher than the respondents who answered "inadequate" at 8.6%. The items with higher inadequate ratio than satisfaction ratio, were temperature, humidity and air quality. The highest dissatisfaction ratios were shown in the following items in the order: temperature and humidity (35.8%), air quality (30.5%), office space area and arrangement (27.7%), and the function of chairs and desks (18.4%). This seems to mean that dissatisfaction level is high on the control of temperature and humidity and air quality, since the office workers of public agencies work in narrow personal space, where many people are engaged in relevant work in one office, for a long time. Also, it is interpreted that supply of chairs including armrest for height control or height control-desks is difficult, due to budget.
3.2 Pain experienced from musculoskeletal symptoms
Table 2 shows the status of pain complaints stated by 397 office workers. The office workers who answered no pain felt on any body part were 44.6%, and those who answered they felt pain on any one part of neck, shoulder, arm, hand, waist and leg at least Table 1. Subjective conformance levels (5 scales) for office environment
Satisfaction level Temp. &
humidity Noise Air
quality Lighting Monitor Office
space Chair,
desk Total feelings
Very adequate 10 19 11 19 10 13 14 10
2.5% 4.8% 2.8% 4.8% 2.5% 3.3% 3.5% 2.5%
Adequate 97 159 80 177 165 135 130 165
24.4% 40.1% 20.2% 44.6% 41.6% 34.0% 32.7% 41.6%
Moderate 148 160 185 152 188 139 180 188
37.3% 40.3% 46.6% 38.3% 47.4% 35.0% 45.3% 47.4%
Inadequate 109 46 85 42 28 76 59 28
27.5% 11.6% 21.4% 10.6% 7.1% 19.1% 14.9% 7.1%
Very inadequate 33 13 36 7 6 34 14 6
8.3% 3.3% 9.1% 1.8% 1.5% 8.6% 3.5% 1.5%
Sum of inadequate satisfaction level
142 59 121 49 34 110 73 34
35.8% 14.9% 30.5% 12.3% 8.6% 27.7% 18.4% 8.6%
were 55.4%. By item with answers feeling pain on plural body parts, the pain complaint ratios of neck (38.3%) and shoulder (38.3%) were higher than those of waist (29.2%), hand (23.2%), leg (16.9%) and arm (16.4%). This seems to be the result of long computer-work hours. In a study of Bachmann and Myers (1995), the complaint ratios of waist, neck and shoulder were higher than those of arm, wrist and finger.
Among 397 survey subjects, the office workers having treatment experience, due to pain, were 66 people (16.6%).
3.3 Distribution of experienced pain by office worker characteristics
Table 3 shows the distribution of body parts of musculoskeletal pain complaints according to gender, age, the length of service, work hours, break time and computer-work hours. In Table 3, females were higher than males at 61.8% and 52.3%, respectively, concerning the pain complaints due to musculoskeletal symptoms. The result is consistent with the research result of Bachmann and Myers (1995). The result that female office workers' hand pain complaint ratio was relatively higher than that of males was also consistent with the research result of Bachmann and Myers (1995). In the study of Sim and Lee (2008), the difference of musculoskeletal system VDT syndrome between males and females was statistically significant, and females showed more VDT syndrome than males.
Table 2. Pain experienced from musculoskeletal symptoms No pain
experienced
Part of body
Total subjects
Neck Shoulder Arm Hand Waist Feet No. of pain
experienced
177 152 152 65 92 116 67 220 397
44.6% 38.3% 38.3% 16.4% 23.2% 29.2% 16.9% 55.4% 100.0%
Table 3. Distribution of experienced pain by office worker characteristics
Variable Count
Part of body
Neck Shoulder Arm Hand Waist Leg/Feet Any pains experienced
Gender Male 266 (67.0%) 34.6% 34.6% 15.0% 18.8% 27.8% 13.5% 52.3%
Female 131 (33.0%) 45.8% 45.8% 19.1% 32.1% 32.1% 23.7% 61.8%
Age (yrs)
30~39 98 (24.7%) 40.8% 37.8% 13.3% 15.3% 32.7% 15.3% 57.1%
40~49 178 (44.8%) 38.2% 42.7% 18.5% 30.3% 29.2% 18.0% 55.6%
50~59 121 (30.5%) 36.4% 32.2% 15.7% 19.0% 26.4% 16.5% 53.7%
Length of service (yrs)
Under 10 80 (20.2%) 37.5% 36.3% 10.0% 13.8% 32.5% 12.5% 53.8%
10~15 51 (12.8%) 41.2% 39.2% 19.6% 27.5% 29.4% 19.6% 58.8%
15~20 84 (21.2%) 39.3% 42.9% 14.3% 23.8% 25.0% 15.5% 58.3%
Over 20 182 (45.8%) 37.4% 36.8% 19.2% 25.8% 29.7% 18.7% 53.8%
As for pain complaint ratios by age bracket, the highest age bracket was shown in 30s (57.1%), 40s (55.6%) and 50 (53.7%) in the order, and the ratio of pain complaint in 30s was the highest. Especially, pain complaint ratios on neck, shoulder and waist in all age brackets were shown high, and pain complaint ratio on hand was high in 40s.
Pain complaint ratio by the length of service was high overall, and the office workers with the length of 10~less than 16 years showed 58.8% of pain complaint ratio, the highest, followed by 15~20 years (58.3%), less than 10 years (53.8%), and 20 years and more (53.8%) in the order. Concerning the distribution of body parts with pain by the length of service, the highest parts in less than 10 years were neck (37.5%), shoulder (36.3%) and waist (32.5%). The highest body parts in 10~15 years were neck (41.2%), shoulder (39.2%) and waist (29.4%). The highest parts in 15~less than 20 years were shoulder (42.9%), neck (39.3%) and waist (25.0%). The highest body parts in 20 years and more were neck (37.4%), shoulder (36.8%) and waist (29.7%).
When it comes to pain complaint ratio by office hours, the office workers pain complaint ratio having less than ten hours of office hours was 58.0%, and was higher than those having ten hours and more of office hours (54.5%), despite not big difference.
As for body part distribution by office hours, the highest body parts for less than ten hours were shoulder (41.0%), neck (36.0%) and waist (26.0%). The highest body parts for ten hours and more were neck (39.1%), shoulder (37.4%) and waist (30.0%).
Regarding the pain complaint ratio according to break time, the pain complaint ratio of the office workers having one hour and more of break time was 66.1%, higher than those having less than one hour of break time at 53.4%. Concerning body part with pain by break time, the highest ratios for one hour and more were shown in the neck (46.8%), shoulder (45.2%) and waist (38.7%).
The highest ratios for less than one hour were shown in the shoulder (37.0%), neck (36.7%) and waist (27.5%).
Although the result that pain complaint ratio is higher as office hours are shorter, and break time is longer is against common sense, the reason can be derived from that older people's office hours, whose musculoskeletal symptom's revelation frequency is high, due to change in human body, are shorter and break time is longer.
Concerning pain complaint ratio according to computer-work hours, more than 10 hours was 64.4%, 8~10 hours was 56.8%, 6~8 hours was 44.7%, and less than 6 hours was 31.0% Actually, as computer-work hours is longer, musculoskeletal symptoms become serious. According to body part distribution by computer-work hours, the highest body parts were neck (47.4%), shoulder Table 3. Distribution of experienced pain by office worker characteristics (Continued)
Variable Count
Part of body
Neck Shoulder Arm Hand Waist Leg/Feet Any pains experienced
Office hours/day
Under 10 100 (25.2%) 36.0% 41.0% 16.0% 21.0% 26.0% 15.0% 58.0%
Over 10 297 (74.8%) 39.1% 37.4% 16.5% 23.9% 30.3% 17.5% 54.5%
Break time/day
Under 1 335 (84.4%) 36.7% 37.0% 14.9% 21.8% 27.5% 15.8% 53.4%
Over 1 62 (15.6%) 46.8% 45.2% 24.2% 30.6% 38.7% 22.6% 66.1%
Computer-work hours/day
Under 6 58 (14.6%) 13.8% 15.5% 8.6% 13.8% 12.1% 10.3% 31.0%
6~8 79 (19.9%) 30.4% 43.0% 19.0% 22.8% 27.8% 12.7% 55.7%
8~10 125 (31.5%) 44.8% 39.2% 15.2% 20.8% 29.6% 17.6% 56.8%
Over 10 135 (34.0%) 47.4% 44.4% 19.3% 29.6% 37.0% 21.5% 64.4%
(44.4%) and waist (37.0%) in the order in more than 10 hours of computer-work hours. The highest body parts were neck (44.8%), shoulder (39.2%) and waist (29.6%) in the order in 8~10 hours. The highest body parts were shoulder (43.0%), neck (30.4%) and waist (27.8%) in the order in 6~8 hours. Shoulder was the highest in less than 6 hours. The results are consistent with the result that musculoskeletal symptoms become more serious, as computer-work hours get longer in the study of Lee and Koo (2015).
3.4 Office and work environment satisfaction levels and workers' musculoskeletal symptoms
This study analyzed satisfaction levels on temperature and humidity, noise, air quality and lighting as office workers' office environment characteristics by classifying them into the office workers suffering from pain and those suffering from no pain, and also analyzed the characteristics by body part. As work characteristics, satisfaction levels on monitor arrangement, personal office area and the function of chairs and desks were analyzed. Aggregate satisfaction levels by body part of the office workers suffering from pain and those suffering from no pain, and the distribution characteristics of absences/treatments of the office workers suffering from pain were analyzed.
3.4.1 Office environment satisfaction levels and workers' musculoskeletal symptoms
Table 4 shows the ratios by body part with musculoskeletal symptoms by degree of adequacy felt on the office environment characteristics (adequacy of temperature and humidity, adequacy of noise level, adequacy of air quality and adequacy of lighting).
In Table 4, "adequate" means the cases that the respondents answered very adequate or adequate, and "inadequate" means the cases that the respondents answered very inadequate or inadequate. In Table 4, when satisfaction levels on temperature and humidity, noise, air quality and lighting are higher, pain complaining workers' ratio gets lower. This result is consistent with the study result of Magnavita et al. (2011) reporting that complaints on environmental characteristics such as temperature, lighting and noise are closely related with upper limb musculoskeletal disorders.
27.0% of the total respondents (107 out of 397) answered adequate, and 35.8% said inadequate on temperature and humidity.
61.3% of the office workers who answered temperature and humidity were inadequate were those who suffered from pain.
According to the distribution of body parts with pain of the office workers who said temperature and humidity were inadequate, the highest body parts with pain were inadequate were neck (44.4%), shoulder (40.8%) and waist (36.6%) in the order. The research result of Tint et al. (2012) reporting that low temperature (20℃) becomes an auxiliary factor of musculoskeletal disorders backs up the result of this study.
Regarding noise, there were more office workers who answered noise level was adequate according to 44.8% of the office workers who answered "adequate", and 14.9% "inadequate". 64.4% of the office workers saying noise was inadequate were those who suffered from pain. According to the distribution of body parts with pain of the office workers who said noise level was inadequate, the highest body parts with pain were neck (49.2%), shoulder (42.4%) and waist (42.4%) in the order.
Regarding air quality, the office workers who answered air quality was inadequate (22.9%) were more than those answered
"adequate" (30.5%). 66.9% of those who answered air quality was inadequate were those who suffered from pain. According to the distribution of body parts with pain of the office workers who said air quality was inadequate, the highest body parts with pain were neck (49.6%), shoulder (43.8%) and waist (41.3%) in the order.
There were more office workers who answered lighting was adequate (49.4%) than those who answered lighting was inadequate (12.3%). 63.3% of those who answered lighting was inadequate were those who suffered from pain. According to the distribution of body parts of the office workers who said lighting was inadequate, the highest body parts with pain were neck (49.0%), shoulder (46.9%) and hand (38.8%) in the order. This result is consistent with the study result of Tint et al. (2012) reporting that
inadequate lighting (less than 400 Lux) becomes an auxiliary factor of musculoskeletal disorders.
3.4.2 Work environment satisfaction levels and workers' musculoskeletal symptoms
Table 5 shows the ratios by body part with pain on musculoskeletal symptoms by degree of adequacy felt on work environment characteristics (adequacy of monitor arrangement, adequacy of area and passage arrangement and adequacy of chair and desk function). When satisfaction levels are higher, the ratio of office workers who suffered from pain falls.
Concerning monitor arrangement, the office workers who said monitor arrangement was adequate (44.1%) were more than those who answered "inadequate" (8.6%). 67.6% of those who answered monitor arrangement was inadequate suffered from pain.
According to the distribution of body parts with pain of the office workers who said monitor arrangement was inadequate, the highest body parts with pain were neck (58.8%) and shoulder (52.9%) in the order.
As for area, the office workers who said area was adequate (37.3%) were more than those who answered "inadequate" (27.7%).
64.4% of those who answered area was inadequate were those who suffered from pain. According to the distribution of body parts with pain of the office workers who said area was inadequate, the highest body parts with pain were neck (46.4%), shoulder (40.0%) and waist (37.3%) in the order.
Regarding the function of chairs and decks, the office workers who said the function of chairs and desks was adequate (36.3%) were more than those who answered "inadequate" (18.4%). 69.9% of those who answered chair and deck function was inadequate suffered from pain. According to the distribution of body parts with pain of the office workers who said the function of chairs and desks was inadequate, the highest body parts with pain were neck (50.0%), shoulder (43.8%) and waist (34.2%) in the order.
Table 4. Ratio of workers who suffered from pain by office environment satisfaction levels Environment Satisfaction N
Part of body
Neck Shoulder Arm Hand Waist Leg/Feet Any pains experienced
Temperature &
humidity
Adequate 107 27.1% 30.8% 7.5% 12.1% 15.9% 5.6% 45.8%
Moderate 148 40.5% 41.2% 16.9% 23.6% 31.8% 23.6% 56.8%
Inadequate 142 44.4% 40.8% 22.5% 31.0% 36.6% 18.3% 61.3%
Noise
Adequate 178 32.0% 32.6% 10.7% 18.5% 21.3% 8.4% 50.6%
Moderate 160 41.3% 43.1% 18.1% 24.4% 33.1% 21.3% 57.5%
Inadequate 59 49.2% 42.4% 28.8% 33.9% 42.4% 30.5% 64.4%
Air quality
Adequate 91 19.8% 30.8% 9.9% 12.1% 16.5% 7.7% 40.7%
Moderate 185 40.0% 38.4% 15.1% 22.7% 27.6% 15.1% 55.1%
Inadequate 121 49.6% 43.8% 23.1% 32.2% 41.3% 26.4% 66.9%
Lighting
Adequate 196 34.2% 34.7% 13.8% 18.4% 19.4% 11.2% 50.5%
Moderate 152 40.1% 40.1% 16.4% 24.3% 39.5% 19.7% 59.2%
Inadequate 49 49.0% 46.9% 26.5% 38.8% 36.7% 30.6% 63.3%
According to the study of Jeong et al. (2009), 69.2% of the respondents who complained discomfort of chairs, and most of them felt physical pain (70%), when the office workers used computers, documents and electronic devices for a long time. The musculoskeletal pain body parts were mainly neck and waist (57.1%). The study of Nelson and Silverstein (1998) asserting that chair improvement relieves musculoskeletal symptoms presents a similar implication. The study of Sim and Lee (2008) also insists that chair height and space under the desk have statistically significant relations with musculoskeletal symptoms.
3.4.3 Absences/treatments or pain complaints and workers' musculoskeletal symptoms
Table 6 shows absences from work by body part with pain of the office workers. Out of 397 respondents, 14 office workers (3.5%) answered they were absent from work, due to musculoskeletal symptoms, and 66 workers (16.6%) got treatment. Concerning the body part of the absent office workers due to musculoskeletal symptoms, the highest body parts with pain were waist (78.6%), shoulder (71.4%) and neck (50.0%) in the order. The treated body parts were shoulder (68.2%), neck (66.7%) and waist (59.1%).
Table 5. Ratio of workers who suffered from pain by work environment satisfaction levels Environment Satisfaction N
Part of body
Neck Shoulder Arm Hand Waist Leg/Feet Any pains experienced
Monitor
Adequate 175 35.4% 35.4% 12.6% 21.7% 23.4% 14.3% 52.6%
Moderate 188 37.2% 38.3% 17.6% 22.9% 34.0% 17.6% 55.9%
Inadequate 34 58.8% 52.9% 29.4% 32.4% 32.4% 26.5% 67.6%
Office space
Adequate 148 31.1% 33.8% 14.2% 19.6% 20.9% 10.1% 45.9%
Moderate 139 39.6% 41.7% 15.8% 23.0% 31.7% 18.7% 58.3%
Inadequate 110 46.4% 40.0% 20.0% 28.2% 37.3% 23.6% 64.5%
Chair and desk
Adequate 144 36.1% 39.6% 16.0% 22.9% 22.9% 13.9% 50.7%
Moderate 180 36.7% 35.0% 15.0% 22.8% 32.2% 18.9% 53.3%
Inadequate 73 46.6% 43.8% 20.5% 24.7% 34.2% 17.8% 69.9%
Table 6. Ratio of workers who suffered from pain by absences/treatments or pain complaints Part of body
Total
Neck Shoulder Arm Hand Waist Leg/Feet
Absence
No 145 142 61 87 105 62 383
37.9% 37.1% 15.9% 22.7% 27.4% 16.2% 96.5%
Yes 7 10 4 5 11 5 14
50.0% 71.4% 28.6% 35.7% 78.6% 35.7% 3.5%
Treatment No 108 107 41 59 77 45 331
32.6% 32.3% 12.4% 17.8% 23.3% 13.6% 83.4%
3.4.4 Distribution of body parts with pain according to office workers' satisfaction levels on aggregate environment
Table 7 shows the ratios by body part with pain on musculoskeletal symptoms by degree of adequacy felt on the satisfaction levels on aggregate environment that integrated office and work environment characteristics. When satisfaction levels is higher, the ratio of the office workers who suffered from pain decreases. The respondents stating adequate and very adequate aggregate satisfaction levels were 175 workers (44.1%) and those stating inadequate and very inadequate were 34 workers (8.6%). Those who suffered from pain out of the respondents answering inadequate were 67.6%, and the highest body parts with pain of the respondents answering inadequate were neck (58.8%) and shoulder (52.9%).
3.5 ANOVA of absences/treatments on general characteristics of office workers
Table 8 classified the respondents into a group with absences or treatments (66 workers) due to musculoskeletal symptoms within Table 6. Ratio of workers who suffered from pain by absences/treatments or pain complaints (Continued)
Part of body
Total
Neck Shoulder Arm Hand Waist Leg/Feet
Treatment Yes 44 45 24 33 39 22 66
66.7% 68.2% 36.4% 50.0% 59.1% 33.3% 16.6%
Total 152 152 65 92 116 67 397
Table 7. Ratio of workers who suffered from pain by aggregate satisfaction levels Satisfaction
level No pain
experienced
Part of body
Total
Neck Shoulder Arm Hand Waist Leg/Feet Pain
experienced Very
adequate
3 6 4 3 3 3 2 7 10
30.0% 60.0% 40.0% 30.0% 30.0% 30.0% 20.0% 70.0% 2.5%
Adequate 80 56 58 19 35 38 23 85 165
48.5% 33.9% 35.2% 11.5% 21.2% 23.0% 13.9% 51.5% 41.6%
Moderate 83 70 72 33 43 64 33 105 188
44.1% 37.2% 38.3% 17.6% 22.9% 34.0% 17.6% 55.9% 47.4%
Inadequate 9 16 15 9 9 9 6 19 28
57.1% 53.6% 32.1% 32.1% 32.1% 21.4% 67.9% 7.1%
Very inadequate
2 4 3 1 2 2 3 4 6
33.3% 66.7% 50.0% 16.7% 33.3% 33.3% 50.0% 66.7% 1.5%
Sum of inadequate
11 20 18 10 11 11 9 23 34
32.4% 58.8% 52.9% 29.4% 32.4% 32.4% 26.5% 67.6% 8.6%
one year, a group without suffering from pain (177 workers), and a group without absences or treatments, despite suffering from pain. The differences and characteristics are identified among the groups through tests by carrying out ANOVA with regard to workers' general characteristics (gender, age, service length, office hours, break time and computer work hours) (significance level:
0.05).
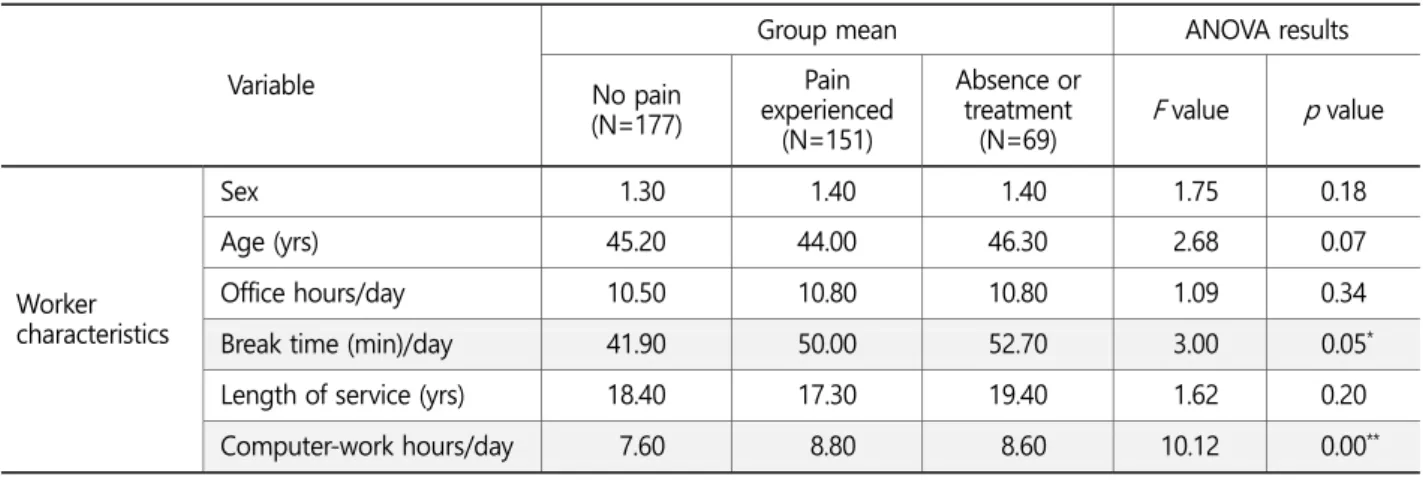
Accordingly, the mean break time of the respondents having experience of absences/treatments was longer in terms of break time.
The computer-work hours of the respondents having experience of absences/treatments and those having no such an experience, but suffering from pain were higher than those answering having no pain. There were no significant differences in gender, age, work hours and the length of service.
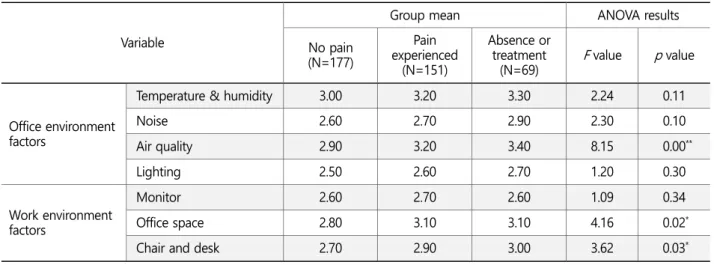
3.6 ANOVA of absences/treatments on dissatisfaction with office workers' environment characteristics Table 9 shows the mean differences and characteristics of each group through tests among the groups with ANOVA on each group in relation with office environment characteristics (temperature and humidity, noise, air quality and lighting) and work environment (monitor arrangement, area and the function of chairs and desks) (significance level: 0.05).
As for the dissatisfaction levels of the office and work environment characteristics, very inadequate was set as five points and very adequate was set as one point with 5-point scale.
The mean of dissatisfaction levels of the respondents experiencing absences/treatments was the highest in terms of air quality (office environment), and there were no significant differences in temperature & humidity, noise and lighting.
In terms of area (work environment), the mean dissatisfaction levels of the respondents experiencing absences/treatments and those without treatments were high. As for chair and desk function, the dissatisfaction levels of the respondents having experience of absences/treatments were high. Monitor arrangement did not show a significant difference.
Table 8. ANOVA for groups of absences/treatments or pain complaints by worker characteristics Variable
Group mean ANOVA results
No pain (N=177)
Pain experienced
(N=151)
Absence or treatment
(N=69) F value p value
Worker characteristics
Sex 1.30 1.40 1.40 1.75 0.18
Age (yrs) 45.20 44.00 46.30 2.68 0.07
Office hours/day 10.50 10.80 10.80 1.09 0.34
Break time (min)/day 41.90 50.00 52.70 3.00 0.05*
Length of service (yrs) 18.40 17.30 19.40 1.62 0.20
Computer-work hours/day 7.60 8.80 8.60 10.12 0.00**
*p<0.05, **p<0.001
4. Conclusion and Discussion
This study investigated the general work characteristics of office workers targeting those working at public agencies, carried out a questionnaire survey on satisfaction levels on office environment and work environment characteristics, and analyzed relations with musculoskeletal pain.
In this study, there were many answers that temperature & humidity and air quality were inadequate. Answers indicating
"adequate" on noise, lighting, monitor, area and chair and desk were more than those indicating "inadequate". From the aggregate satisfaction level aspect on environmental characteristics, the ratio answering "adequate" was higher than the ratio answering
"inadequate". This can be explained from the following: The satisfaction levels on noise, lighting and monitor arrangement affecting office work function were high in terms of aggregate satisfaction levels on office environment and space, and the ratio answering the chair and desk function was relatively adequate was high as well. Meanwhile, the satisfaction levels on temperature and humidity and air quality were relatively lower than the aggregate satisfaction levels.
55.4% of the total respondents complained pain due to musculoskeletal symptoms, and there were many pain complaints on neck and shoulder, which is similar to the study result of Bachmann and Myers (1995).
More female office workers revealed pain complaints, as shown by Sim and Lee (2008). Like the study of Lee and Koo (2015), higher pain complaints were reveled, as computer-work hours were longer. By age bracket, pain complaint ratio was higher in the younger group, and the highest score was revealed in the youngest group (20~30 years old) in the study on VDT syndrome of Sim and Lee (2008).
The office workers with less than 10 hours of office hours showed the highest pain complaint ratio, which conflicts with the study result of Sim and Lee (2008). As for pain complaint ratio according to break time, the ratio having more than one hour of break time was high. In the study on VDT syndrome of Sim and Lee (2008), the group without taking break time was showed higher score. That the pain complaint ratio of the group with shorter office hours and relatively longer break time is high seems to be against common sense. However, it can be interpreted that the office hours of elders with higher musculoskeletal symptom revelations are shorter and their break time is longer in reality.
Table 9. ANOVA for groups of absences/treatments or pain complaints by environment satisfaction Variable
Group mean ANOVA results
No pain (N=177)
Pain experienced
(N=151)
Absence or treatment
(N=69) F value p value
Office environment factors
Temperature & humidity 3.00 3.20 3.30 2.24 0.11
Noise 2.60 2.70 2.90 2.30 0.10
Air quality 2.90 3.20 3.40 8.15 0.00**
Lighting 2.50 2.60 2.70 1.20 0.30
Work environment factors
Monitor 2.60 2.70 2.60 1.09 0.34
Office space 2.80 3.10 3.10 4.16 0.02*
Chair and desk 2.70 2.90 3.00 3.62 0.03*
*p<0.05, **p<0.001
As satisfaction levels on office environment (temperature and humidity, noise, air quality and lighting) and work environment (monitor arrangement, office space area and arrangement and the function of chairs and desks) were lower, higher pain complaint ratio was shown. This is consistent with the study result of Magnavita et al. (2011) reporting that dissatisfaction on such environmental characteristics of temperature, lighting and noise is closely related with upper limb musculoskeletal disorders.
Among the office workers answering temperature and humidity were inadequate, 61.3% suffered from pain, which is backed up by the study result of Tint et al. (2012) asserting that low temperature (20℃) becomes an auxiliary factor of musculoskeletal disorders. 63.3% of the respondents answering lighting was inadequate suffered from pain, which is consistent with the study result of Tint et al. (2012) insisting that inadequate lighting (lower than 400 Lux) can become an auxiliary factor of musculoskeletal disorders.
69.9% of the respondents saying the function of chairs and desks was inadequate suffered from pain. In the study of Jeong et al.
(2009), 69.2% of the total respondents complained discomfort on chairs, and the study of Nelson and Silverstein (1998) reporting chair improvement relieves musculoskeletal symptoms on neck and shoulder also presents a similar implication. In the study of Sim and Lee (2008), the height of a chair and space under the desk had statistically significant relations with musculoskeletal symptoms.
The mean break time of the respondents with experience of absences/treatments was longer. The computer-work hours of the respondents having absences/treatments and those without absences/treatments, but suffering from pain were longer than those having no pain.
The mean of dissatisfaction levels of the respondents having experience of absences/treatments was the highest in air quality.
The dissatisfaction levels of those having experience of absences/treatments and those without such an experience were high in terms of area, and the dissatisfaction levels of those having experience of absences/treatments were high in terms of chair and desk function.
Musculoskeletal disorders are the most common disorders related with occupation and work. The environment using computers continually is a main factor of such disorders to the office workers. Measures to prevent musculoskeletal disorders mainly on shoulder, back and neck are presented in the studies of Sim and Lee (2008) and Lee and Koo (2015). Regular resting, the stretching of neck and shoulders, acquisition and arrangement of area, chair height and functional fortification to ensure proper posture are mainly needed. As for temperature, a review on maintaining low indoor temperature as part of energy saving activity in winter executed by public agencies is required. Low temperature makes human body shrink, and if this is repeated, there is a concern that human body shrinking can deteriorate to musculoskeletal symptoms.
The results in this study have a limitation in that this study surveyed and analyzed the office workers' satisfaction levels on the office environment and work environment, and musculoskeletal symptoms targeting 397 office workers of public agencies. In addition, this study analyzed relations between satisfaction levels on office/work environment and musculoskeletal symptom complaints, based on respondents’subjective answers, and interpreted the results. Therefore, a further study considering various types of office worker groups, in addition to public agencies, and increasing the subjects of questionnaire survey is expected.
Nonetheless, this study has significance in that this study systematically surveyed the work characteristics of the public agencies' office workers who work in offices all day long, satisfaction levels on office environment and work environment, and musculoskeletal pain complaint ratios. The findings of this study are expected to be valuable as basic data for office environment design.
Acknowledgements
This research was financially supported by Hansung University.
References
Bachmann, M.O. and Myers, J.E., Influences on sick building syndrome symptoms in three buildings, Social Science & Medicine, 40(2), 245-251, 1995.
Burge, P.S., Sick building syndrome. Occupational and Environmental Medicine, 61(2), 185-190, 2004.
Burge, S., Hedge, A., Wilson, S., Bass, J.H. and Robertson, A., Sick building syndrome: a study of 4373 office workers, Annals of Occupational Hygiene, 31(4A), 493-504, 1987.
Jaakkola, M.S. and Jaakkola, J.J., Office equipment and supplies: A modern occupational health concern?, American Journal of Epidemiology, 150(11), 1223-1228, 1999.
Jeong, B.Y., Shin, D.S. & Park, M.H., A Study on Office Environment Satisfaction and Worker" s Subjective Symptoms, Journal of the Ergonomics Society of Korea, 34(3), 223-234, 2015.
Jeong, B.Y. and Yoon, A., Ergonomics of Office Seating and Postures, Journal of the Ergonomics Society of Korea, 33(2), 167-174, 2014.
Jeong, S., Lee, S.Y., Eu, S.M. Kim D.H. & Lee, E.H., Study on the Environmental Factors and Symptoms of VDT Syndrome, Journal of Korean Ophthalmic Optics Society, 14(4), 65-69, 2009.
Kubo, T., Mizoue, T., Ide, R., Tokui, N., Fujino, Y., Minh, P.T., Shirane, K., Matsumoto, T. & Yoshimura, T., Visual display terminal work and sick building syndrome-the role of psychosocial distress in the relationship. Journal of Occupational Health, 48, 107-112, 2006.
Kwon, K.W. and Park, J.S., Cost Benefit Analysis of Improved Indoor Air Quality in Office Buildings, Journal of the Architectural Institute of Korea, 23(10), 203-212, 2007.
Lee, J. and Koo, J., Occupational Diseases Among Office Workers and Prevention Strategies, J Ergon Soc Korea, 34(2): 125-134, 2015.
Li, D.W. and Yang, C.S., Fungal contamination as a major contributor to sick building syndrome, Advances in Applied Microbiology, 55, 31-112, 2004.
Magnavita, N., Elovainio, M., De Nardis, I., Heponiemi. T.and Bergamaschi, A., Environmental discomfort and musculoskeletal disorders, Occupational Medicine, 61, 196-201, 2011.
Nelson, N.A. and Silverstein, B.A., Workplace Changes Associated with a Reduction in Musculoskeletal Symptoms in Office Workers, Human Factors, 40(2), 337-350, 1998.
Passarelli, G.R., Sick building syndrome: An overview to raise awareness, Journal of Building Appraisal, 5, 55-66, 2009.
Sim, M.J. and Lee, Y,S., A study on the VDT syndrome and relating work factors of office workers, Journal of Korean Society for Health Education and Promotion, 25(3), 95-109, 2008.
Tint, P., Traumann, A., Pille, V., Tuulik-Leisi, V.R. & Tuulik, V., Computer users' health risks caused by the simultaneous influence of inadequate indoor climate and monotonous work. Agronomy Research, 10, 261-268, 2012.
Yoon, A., A study of work environment factor of influencing officer satisfaction, Unpublished master's thesis, Hansung University, Seoul, 2014.
Author listings
Myoung Hwan Park: [email protected]
Highest degree: PhD, Department of Industrial Engineering, KAIST
Position title: Professor, Department of Industrial and Management Engineering, Hansung University Areas of interest: Operations Management, Innovation Engineering
Sangbok Lee: [email protected] Highest degree: PhD, Purdue University
Position title: Assistant Professor, Department of Industrial and Management Engineering, Hansung University Areas of interest: Service Engineering, Quality Management
Byung Yong Jeong: [email protected]
Highest degree: PhD, Department of Industrial Engineering, KAIST
Position title: Professor, Department of Industrial and Management Engineering, Hansung University Areas of interest: Ergonomics, Safety and Health Management, UX