Progress in Superconductivity and Cryogenics
Vol.15, No.2, (2013), pp.34~38 http://dx.doi.org/10.9714/psac.2013.15.2.034
```
1. INTRODUCTION
It is important to reduce ac loss for application of coated conductors (CCs) to electric devices [1, 2] because the loss results in temperature increase of the devices, which leads to increase of risk and cost in operation. In general, power loss is determined by the inner product of electric field (E(r,t)) and current density (J(r,t)) at a position, r, and time, t. For a thin strip superconducting (SC) layer, the current flows along the surface due to the large aspect ratio of width to thickness, hence, the electric field vector positioned in the current-flow plane predominantly attributes to the ac loss. According to the Faraday Law,
t E B=−∇×
∂
∂ , the time derivative of the surface normal component of B(r,t) is related to the in-plane electric field.
Therefore, for mitigation of the loss for a CC, it is essential to control penetration of the surface normal component of B into the SC layer. For that reason, many efforts have been made to decrease that field. The striation is one of the effective methods for suppressing normal component B
penetrating into the SC layer for a CC to carry high current [3]. The ac loss was inversely proportional to the number of the filaments in the striated CCs [4, 5]. Another way to suppress the normal component penetration is to twist several CC tapes. For example, in the Roebel cable, a serpentine shaped conductor, that magnetic field generated from each SC wire or externally applied can be compensated due to the chain shaped current path [6]. The ac loss was markedly reduced by using the narrow strand.
Recently, H. S. Ha and his colleagues in Korea Electrotechnology Research Institute (KERI) suggested a kind of round shaped wire by stacking four CCs vertically, eventually to twist them for mitigation of the loss [7]. They fabricated a small square shaped SC wire, however, it was not sure that the stack itself could have an influence on ac loss properties before taking advantage of the expected merit via twisting them. In this paper, we are aim to verify whether the loss is possibly reduced or not calculating numerically the ac loss of the stack. We used the H-formulation combined with the E-J power law and the Kim model fit for the measured Jc(B). The model including time dependent partial differential equations with respect to magnetic field vector components was implemented in the finite element method (FEM) program by a commercial
AC transport current loss analysis for a face-to-face stack of superconducting tapes
Jaeun Yoo*, a, Dojun Youmb, and SangSoo Ohc
a Department of Physics, Chonbuk National University, Jeonju, Korea
b Department of Physics, Korea Advanced Institute of Science and Technology, Daejeon, Korea
c Superconducting Materials Research Group, KERI, Changwon, Korea ) (Received 6 June 2013; revised or reviewed 27 June 2013; accepted 28 June 2013)
Abstract
AC Losses for face to face stacks of four identical coated conductors (CCs) were numerically calculated using the H-formulation combined with the E-J power law and the Kim model. The motive sample was the face to face stack of four 2 mm-wide CC tapes with 2 µm thick superconducting layer of which the critical current density, Jc, was 2.16×10⁶ A/cm2 on IBAD-MgO template, which was suggested for the mitigation of ac loss as a round shaped wire by Korea Electrotechnology Research Institute. For the calculation the cross section of the stack was simply modeled as vertically aligned 4 rectangles of superconducting (SC) layers with E = Eo(J(x,y,t)/Jc(B))n in x-y plane where Eo was 10-6 V/cm, Jc(B) was the field dependence of current density and n was 21. The field dependence of the critical current of the sample measured in four-probe method was employed for Jc(B) in the equation. The model was implemented in the finite element method program by commercial software. The ac loss properties for the stacks were compared with those of single 4 cm-wide SC layers with the same critical current density or the same critical current. The constraint for the simulation was imposed in two different ways that the total current of the stack obtained by integrating J(x,y,t) over the cross sections was the same as that of the applied transport current: one is that one fourth of the external current was enforced to flow through each SC. In this case, the ac loss values for the stacks were lower than those of single wide SC layer. This mitigation of the loss is attributed to the reduction of the normal component of the magnetic field near the SC layers due to the strong expulsion of the magnetic field by the enforced transport current. On the contrary, for the other case of no such enforcement, the ac loss values were greater than those of single 4cm-wide SC layer and . In this case, the phase difference of the current flowing through the inner and the outer SC layers of the stack was observed as the transport current was increased, which was a cause of the abrupt increase of ac loss for higher transport current.
Keywords : AC Loss, superconducting tape, finite element method, vertical stack
* Corresponding author: [email protected]
Jaeun Yoo, Dojun Youm, and SangSoo Oh
software, COMSOL Multi- physics, which makes the modeling of the super- conductivity simple, flexible and extendable [8, 9]. The ac loss properties for the stacks were compared with those of single 4 cm-wide SC layers with the same critical current density or the same critical current.
2. NUMERICAL SIMULATION 2.1. Sample Modeling
The motive sample was the vertical stack of four 2 mm-wide CC tapes with 2 µm thick SmBa2Cu3O7-δ layer of which the critical current density at self-field, Jc0, was 2.16×10⁶ A/cm2 on IBAD-MgO template, which was suggested for the mitigation of ac loss as a round shaped wire by KERI [7]. The schematic view of the 2-dimensional model for the numerical simulation was showed in Fig. 1.
The large circle with the radius of 1.5 cm was the outer boundary. The rectangles in the x-y plane (the plane of the paper) were considered as the cross sections of four infinitely-long SC layers along the z-axis normal to the x-y plane, which is the subdomain 2, 3, 4, and 5 from the bottom. The region between the outer boundary and the SC subdomains was the domain 1 which was air in this paper.
We scaled up the cross section of the SC layer by multiplying 20 to the thickness of the real sample, so the vertical length of the rectangle in the model was 40 µm, which is because 40 µm is the minimum value in a 10-6 sec time step without convergence problem for an appropriate mesh structure shown in Fig. 1. The gap between the SC layers was fixed as 1.2 mm since the substrate thickness of the sample was 60 µm. The width of the model, if multiplied by 20, should have been 4 cm, which consumed too much time. Instead, for saving the calculation time, the width was set up for 2 cm, and corresponding critical current for each SC layer was 17300 A. So the Ic of the stack was 69200 A. It took about 5 days to obtain the simulation results under the condition of high external current, Ia = 0.9 Ic0 sin(ωt), in the PC with RTM i7-2670QM CPU @ 2.2 GHz, 6 GB RAM and 64 bit operation system. For exploring ratio effect of the width to gap, ac loss for a vertical stack of four 1cm-wide SC layers was calculated, too, of which the critical current was half of the 2cm-wide stack. The commercial finite element method (FEM) software was used in this paper.
Fig. 1. The schematic view of model for SC vertical stack in 2-dimensional model.
(a)
(b)
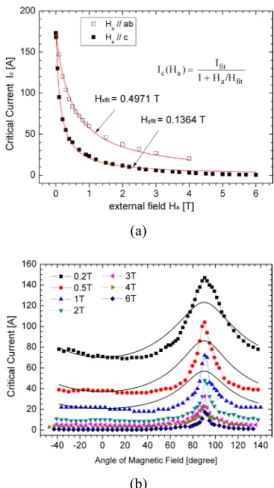
Fig. 2. (a) The field dependence of critical current Ic of the motive sample (symbols) and Kim model fit (solid lines).
Open squares: for the condition of the external field parallel to the ab-plane of the SmBCO CC sample and solid squares: for the external field parallel to the c-axis (b) The angle dependence of critical current Ic of the sample and the fitting curves by equation (2) in the text (solid lines).
2.2. Superconducting Modeling
The electric field is a function of the current, and the Faraday’s law determines the complete system as in
H μ - ) J (
E 0 t
∂
=
×
∇ where E(J)
is the current dependent electric field, and the permeability of vacuum, µ0 is 4π×10-1 Oe cm/A. For the geometry shown in Fig. 1 Hx and Hy
represent the components of the magnetic field in the x- and y-directions. The current density, Jz, and the electric field, Ez, are the z-direction. Combining the Ampere's law and the Faraday's law, we finally obtained the time dependent partial differential equation describing our system.
0 0 0
) (J E -
) (J E 0 H
H μ 0
0 μ
z z
z z y
t x t 0
0
=
⋅
∇
+
∂
∂
(1)
The electric field is modeled by the E-J power law [5] for
superconducting domain as
n c 0 z z
z J (B)
t) y, (x, E J ) (J
E
= ,
where E0 was 10-6 V/cm, Jc(B) was the field dependence of current density and n was 21. For the domain1 (air), the 35
AC transport current loss analysis for a face-to-face stack of superconducting tapes
Ohmic law, E =z ρairJz, was applied, where ρair = 1×10⁸ Ωcm [9]. The measured values of Ic(Ha) under external field, Ha, were fitted with parameters Hxfit = 4971 Oe, Hyfit
= 1364 Oe, and Ifit = Ic = 173 A at self-field by the Kim model
fit a a fit
c 1 H /H
) I (H
I = + , as shown Fig. 2(a). Fig.2 (b) showed the angle dependence of Ic(Ha) measured and there observed no marked peak of Ic for the condition of Ha parallel to the c-axis of the sample. So the field and angle dependence properties of Ic was embedded in the software in the form of equation (2)
yfit 2 y 2 0
xfit x 0 z fit
) /H H H
H ( 1 (H) J
J = + µ / ) +(µ (2)
The solid lines in Fig. 2 (b) represent the fitting curves by the equation (2).
The transport current, Ia, was set as Ia=I0sin(ω t), where ω = 2π×50 Hz and I0 was varied between 0.07 and 0.9 Ic
values of the SC model.
2.3. Boundary Conditions and Constraints
For the inner boundaries, the magnetic continuity )
H H (
n× 1− k was automatically satisfied in the H- formulation [9], where n
is the surface normal vector, and k is the index representing the subdomains 2, 3, 4, and 5.
The constraint was imposed at one point of the circle that the total current, Itotal, resulted from the simulation was the same as Ia in two different ways.
a k k
total I I
I =Σ = where Ik =∫Jkz(x,y,t)dAk (3) One is that each SC layer carries the one fourth of Ia, Ik = (1/4)Ia, and the other is that the sum of the current carried by each SC is the same as Ia as the equation (3) is.
The ac loss, Q, per cycle was defined as the equation (4), where Jkz(x,y,t)⋅Ekz(x,y,t) was integrated over the SC subdomains and the second period. The loss of the virgin state was lower than those calculated over the second or later period [9]. It was confirmed that Qs were identical after the first period of Ia(t).
dt dA t) y, (x, E t) y, (x, J
Q=Σk∫ ∫ kz ⋅ z k (4) where k = 2, 3, 4, 5. The Qs of the single wide SC layers were predicted theoretically, too, using Norris equations [11, 12] as follows:
thin elliptical conductor:
/2]
x - x x) - x)ln(1 - (1 ) / π I (μ
Q= 0 c2 ⋅[ + 2 (5) thin strip conductor:
(a)
(b)
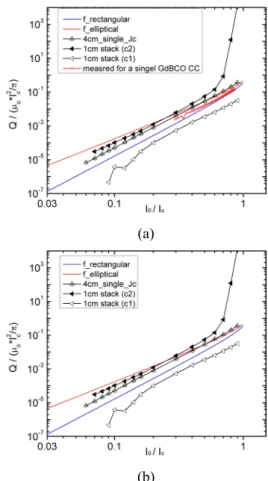
Fig. 3. The current dependence of the normalized ac losses, f, per cycle for (a) the 2-cm-wide stack and (b) the 1-cm-wide stack. (c1: constraint 1, c2: constraint 2).
x)]
x)ln(1 (1
x) - x)ln(1 - (1 ) / π I (μ
Q= 0 c2 ⋅[ + + + (6)
where x is I0/Ic.
The Q values for the stack were compared with those calculated in the same way for single 4-cm-wide SC layers, for verifying mitigation of ac loss for the face-to-face stacks.
AC loss depends on critical current of superconductor, as seen in equation (5) and (6): loss is generated proportionally to the second power of the critical current.
Therefore, the two cases of the single SC layers were considered: one is that the critical current density of the 4-cm-wide single SC layer was twice than Jc = 2.16×10⁶ A/cm2 of the motive sample, where the critical current was the same as that of the 2-cm wide stack (Ic = 69200 A). As a matter of fact, ac loss of a 8-cm-wide single SC layer model should have been compared, however, it would take too much time to calculate for the width of 8 cm case. Thus we decided to calculate ac loss for the 4-cm-wide SC layer with 2 Jc values. The other case, the same Jc value put on the 4-cm-wide single SC layer, the critical current was the same as that of the 1-cm wide stack.
3. RESULTS AND DISCUSSION
The cross section of the SC layer in the model was magnified by 20 times for the thickness and 10 times for the width of the motive sample. Hence the modeled stack 36
Jaeun Yoo, Dojun Youm, and SangSoo Oh
carried 200 times higher current than the real current capacity of the sample. The Q values were not realistic as they were calculated themselves. Instead, the behavior and relative values of Q depending on external current for the different geometry are relevant, therefore, we introduced one parameter called the normalized ac loss, f, per cycle which is defined as Q/ (μ0I2c / π) [12]. It is useful to compare loss properties for SC wires having the different critical current values.
Figure 3 (a) and (b) shows the current dependence of the normalized ac loss, f, per cycle, for the 2-cm-wide and the 1-cm-wide stacks, respectively where the horizontal axis indicates I0/Ic. (For convenience, f, will be called just the loss below). The two solid lines represent the analytical solution predicted by the Norris equations (5) and (6). The loss was proportional to the 3rd-power and 4th-power of the current for the thin elliptical conductor and the thin strip, respectively. The ac loss values measured for a single GdBa2Cu3O7-d (GdBCO)CC with the critical current 235 A from KERI were included in the Fig. 3 (a). The loss was in good agreement with those predicted by the Norris’ thin strip model. The numerical calculation results for the single SC layers were deviated from those theoretically predicted.
The f values of those samples were between the 3rd-power and 4th-power predicted for the model with Jc value of the.
This feature was often observed for the samples with relatively lower Jc [13]. For the 2Jc case of the single 4-cm-wide SC layer the f values agreed with the loss of the
(a)
(b)
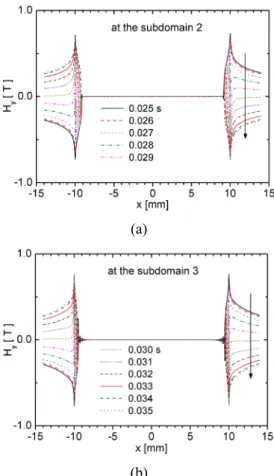
Fig. 4. The magnetic flux density distributions at the middle of (a) the subdomain 2 (or 5) and (b) the subdomain 3 (or 4) under the constraint 1 for Ia=0.7Icsin(ω t) at t = 25 ~ 35 ms in a 1 ms –step increment (the arrow indicates the time increment, and the legend is the same in both figure 4 and 5).
thin strip except the abnormal increase near I0/Ic = 1. Such abnormal behavior of the loss was observed previously for the YBa2Cu3O7-δ CC on the IBAD-YSZ template [8]. All the losses of the stacks seemed to increase in proportion to 3rd power or 4th -power of transport current. The losses of the 1- and 2-cm wide stacks were reduced under the constraint 1 (c1), which is lower than Norris’ prediction for the thin strip (blue solid line). On the contrary, the loss under constraint 2 (c2) became greater than those of the other cases, and increased abnormally for the higher external current (I0 > 0.6Ic). There was no characteristic property due to the ratio of the width to gap: as seen in Fig.
3 (a) and (b), the current dependence of the loss of 1-cm wide stack was very similar to that of the 2-cm wide stack.
In order to understand the ac loss properties in Fig. 3 (a) and (b), the magnetic flux density distributions in the SC layers were investigated. The figure 4 and 5 show the magnetic flux density distributions at the middle of the subdomains of the stack model for Ia=0.7Icsin(ω t) under the constraint 1 and 2, respectively. For the case of the constraint 1, as seen in Fig. 4, the magnetic flux rarely penetrated the SC layer while it penetrated deeply inside SC layers under the constraint 2. Therefore the mitigation of the loss under the constraint 1 is attributed to the reduct ion of the normal component of the magnetic field near the
(a)
(b)
Fig. 5. The magnetic flux density distributions at the middle of (a) the subdomain 2 (or 5) and (b) the subdomain 3 (or 4) under the constraint 2 for Ia=0.7Icsin(ω t) at t = 25 ~ 35 ms in a 1 ms –step increment.
37
AC transport current loss analysis for a face-to-face stack of superconducting tapes SC layers due to the strong expulsion of the magnetic field
by the enforced transport current which equally flowed through each SC layer
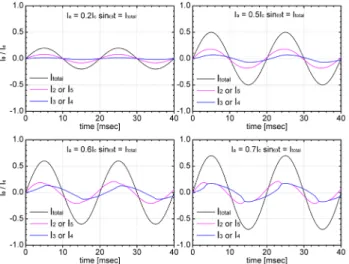
Figure 6 shows the Ik’s integrated using Eq. (3) over the cross section of the SC layers in the 2cm -width stack under the constraint 2 when the transport current Ia=I0sin(ω t) for I0 = 0.2, 0.5, 0.6, 0.7 Ic was applied. As seen in figure 6(a) and (b), for lower I0, the most of current flowed through the outer SC layers. As I0 increased up to 0.7 Ic , the inner and outer current are increased, and the peak values of Ik’s became almost same for both layers. The interesting feature is the phase change of the transport current in the SC layer which clearly appeared from I0 = 0.5Ic. Although the total current satisfied the constraint 2, Itoal = Iapp, the absolute value of the current flow through the stack was larger than that of the applied current because the current flowed through the inner SC layers in the opposite direction to the current of the outer SC layers in certain range of time period. This resulted in the abrupt increase of the loss when I0 was larger than 0.6Ic.
4. CONCLUSION
The ac loss properties for the face to face stack of the four identical coated conductors (CCs) were numerically calculated and compared for the two different constraints during the simulation process: the first is that one fourth of the applied transport current was enforced to flow through each SC while the second is that the total current, that is, the sum of the current of each SC layer was the same as the applied transport current.
Fig. 6. The Ik’s integrated using Eq. (3) over the cross section of the SC layers in the 2cm -width stack under the constraint 2 when the transport current Ia=I0sin(ω t) for I0 = 0.2, 0.5, 0.6, 0.7 Ic was applied.
In the case of the first constraint, the ac loss values for the stacks were much lower than those of single 4-cm-wide SC layer or those predicted using Norris’ equations. This mitigation of the loss is attributed to the reduction of the normal component of the magnetic field near the SC layers due to the strong expulsion of the magnetic field by the enforced transport current. On the contrary, for the case of no such enforcement, the ac loss values were greater than any other cases due to the deep magnetic flux penetration and the change of the current phase which cause the increase of the absolute amount of the current flow.
ACKNOWLEDGMENT
This work was supported by Basic Science research Program through the National Research Foundation (NRF) funded by the Ministry of Education, Science and Technology (MEST) (NRF-R1A4A003-2011-0013170).
The authors are thankful to Dr. Ha in KERI for the ac loss data for the single GdBCO CC tape.
REFERENCES
[1] 17th International Superconductivity Industry Summit (ISIS-17), Tsukuba, Japan, Oct. 30-31, 2008.
[2] M. J. Gouge, "High temperature superconducting power cables - an over view," International workshop on coated conductors for applications (CCA2008), Huston, Texas, Dec. 4, 2008.
[3] S. Kasai and N. Amemiya, IEEE Trans. Appl. Phys., vol. 15, pp.
2885-2858, 2005.
[4] C. B. Cobb, P. N. Barnes, T .J. Haugan, J. Tolliver, E. Lee, M.
Sumption, E. Collings, and C. E. Oberly, Physica C, vol. 382, pp.
52–56, 2002.
[5] M. Polak, L. Krempasky, S. Chromik, D.Wehler, and B. Moenter, Physica C, vol. 372–376, pp. 1830–1834, 2002.
[6] N J Long1, R Badcock, P Beck, M Mulholland, N Ross, M Staines, H Sun, J Hamilton, R G Buckley, “Narrow strand YBCO Roebel cable for lowered AC loss,” Journal of Physics: Conference Series vol. 97, pp. 012280, 2008.
[7] H. S. Ha, H. S. Kim, S. S. Oh, D. Youm, S. H. Moon, "Fabrication and property of round shape wire using coated conductors,"
International workshop on coated conductors for applications (CCA2010), Fukuoka, Japan, O-E11, Oct. 27-30, 2010.
[8] COMSOL Multiphysics 3.5a Model library/ AC DC module / general industrial application / superconducting wire.
[9] Z. Hong, A. M. Campbell, T. A. Commbs, Supercond. Sci. Technol., vol. 19, pp. 1246-1252, 2006.
[10] D. N. Nguyen, P. V. P. S. Sastry, D. C. Knoll, G. Zhang, J. Schwartz, J. Appl. Phys., vol. 98, pp. 073902, 2005.
[11] W. T. Norris, J. Phys. D, vol. 3, pp. 489-507, 1970.
[12] E. Brandt and M. Indemn, Phys. Rev. B, vol. 48, pp. 12893-12906, 1993.
[13] Y. Iijima, M. Hosaka, N. Sadakkata, T. Saito, O. Kohno, K. Takeda, App. Phys. Lett., vol. 71, pp. 2695-2697, 1997.
38